
Key issues
- For the week ending 23 November 2022, cold fronts across southern Australia brought significant rainfall and strong winds. Weekly rainfall totals exceeding 50 millimetres were observed across alpine areas of New South Wales and Victoria, northern parts of Western Australia and the Northern Territory, western Tasmania, and parts of northern Queensland and Victoria.
- Moderate rainfalls across southern New South Wales and Victorian cropping regions are likely to have prolonged the waterlogging of winter crops and exacerbated flooding of low-lying crops in riverine areas. Another week of dry conditions across most of Queensland and northern New South Wales will have allowed harvesting of winter crops and planting of summer crops to continue. In Western Australia, harvesting activity continued with minimal delay on the expected large winter crop.
- La Niña continues in the tropical Pacific, with atmospheric and oceanic indicators reflecting a mature La Niña event. Meanwhile, sea surface temperature anomalies across the northern Indian Ocean have eased significantly over recent weeks, reflecting the decline in the negative Indian Ocean Dipole (IOD) event. The Southern Annular Mode (SAM) is currently positive and is likely to remain positive into early summer. A Madden-Julian Oscillation (MJO) of moderate strength is active over the western Pacific Ocean, increasing rainfall over north-eastern Australia.
- The rainfall outlook for December 2022 to February 2023 suggests there is a greater than 60% chance of exceeding median rainfall across most of Victoria, southern and eastern New South Wales, eastern Queensland, Tasmania, and eastern parts of South Australia. As crops in these regions reach the final stages of maturation, a continuation of wet conditions may cause further grain quality downgrades and delay harvesting. Moreover, the wet conditions are likely to continue to interrupt the planting of summer crops.
- Over the 8-days to 1 December 2022, low-pressure systems and a broad trough is forecast to bring moderate to heavy rainfall to northern and eastern Queensland, and northern areas of the Northern Territory and Western Australia. Moderate falls forecast across most cropping regions in Queensland and northern New South Wales are likely to bring renewed delays to the harvesting of winter crops and planting of summer crops following two relatively dry weeks. The easing of wet conditions across flood-affected cropping regions of south-eastern Australia will likely allow floodwaters to recede and reduce the risk of further waterlogging and reductions in yield potential.
- Water storage levels in the Murray-Darling Basin (MDB) decreased between 16 November 2022 and 23 November 2022 by 70 gigalitres (GL). Current volume of water held in storage is 23 938 GL which represents 95 per cent of total capacity. This is 5 percent or 1219 GL more than at the same time last year.
- Allocation prices in the Victorian Murray below the Barmah Choke increased from $24 per ML on 17 November to $26 per ML on 24 November 2022. Prices are lower in the Goulburn-Broken due to the binding of the Goulburn intervalley trade limit.
Climate
For the week ending 23 November 2022, cold fronts across southern Australia brought significant rainfall and strong winds, while low-pressure troughs across northern Australia drew down moist, tropical air, resulting in heavy rainfall. Wet conditions across south-eastern Australia exacerbated riverine flooding. Weekly rainfall totals exceeding 50 millimetres were observed across alpine areas of New South Wales and Victoria, northern parts of Western Australia and the Northern Territory, western Tasmania, as well as isolated parts of northern Queensland and Victoria. Meanwhile, high-pressure systems resulted in mostly dry conditions across remaining parts of Australia.
In Australian cropping regions, rainfall totals of between 10 and 50 millimetres were recorded across much of Victoria and South Australia, as well as parts of southern New South Wales, Central Queensland and Western Australia. Little to no rainfall was recorded in remaining cropping regions of New South Wales, Queensland and Western Australia for the week ending 23 November 2022.
Moderate rainfalls across southern New South Wales and Victorian cropping regions are likely to have prolonged the waterlogging of winter crops and exacerbated flooding of low-lying crops in riverine areas. A late plant and wet finish to the winter cropping season mean that many winter crops across south-eastern Australia are yet to fully mature, delaying harvest. For early planted crops, the continued wet conditions are likely to contribute to quality downgrades. The wet conditions have also inhibited the planting of summer crops across southern New South Wales, with the end of planting windows fast approaching. Rainfall across South Australian cropping regions is expected to delay winter crop harvesting, but production prospects remain largely favourable.
Another week of dry conditions across most of Queensland and northern New South Wales will have allowed harvesting of winter crops and planting of summer crops to continue. Meanwhile, dry conditions through central cropping regions of New South Wales have allowed soil profiles to drain, with continued dry conditions required to allow field access. In Western Australia, harvesting activity continued with minimal delay on the expected large winter crop.
Rainfall for the week ending 23 November 2022
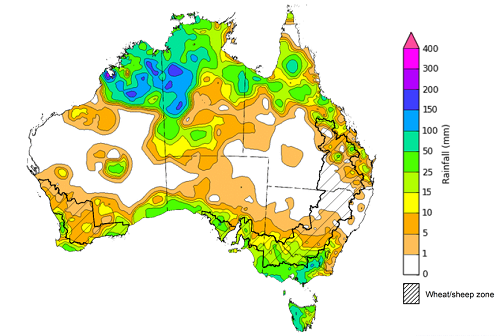
Note: The rainfall analyses and associated maps utilise data contained in the Bureau of Meteorology climate database, the Australian Data Archive for Meteorology (ADAM). The analyses are initially produced automatically from real-time data with limited quality control. They are intended to provide a general overview of rainfall across Australia as quickly as possible after the observations are received. For further information go to http://www.bom.gov.au/climate/rainfall/
Throughout Australia’s late spring/early summer period the climate drivers with the largest potential impact on Australia’s climate patterns are the El Niño–Southern Oscillation (ENSO), the Indian Ocean Dipole (IOD), the Southern Annular Mode (SAM), and the Madden-Julian Oscillation (MJO). These climate drivers are likely to influence pasture growth across much of Australia, grain quality prospects and harvest conditions for winter crops, as well as the planting and establishment of summer crops.
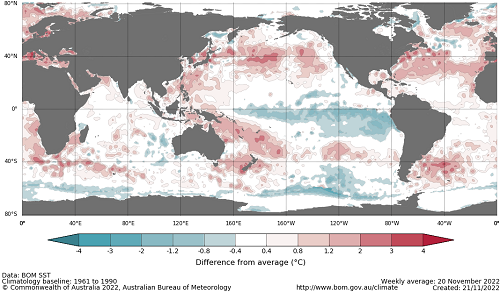
La Niña continues in the tropical Pacific, with atmospheric and oceanic indicators reflecting a mature La Niña event. Cool sea surface temperature (SST) anomalies have persisted in the central and eastern equatorial Pacific Ocean in recent weeks. However, the strength and extent of cool SST anomalies have eased across the eastern Pacific Ocean. Warmer than average temperatures continue in the far-west of the Pacific, across the Maritime Continent, and to the north-east of Australia. Trade winds have been slightly stronger than average in the western Pacific and cloudiness has also remained below average around the Date Line, which reflect the ongoing La Niña event.
Sea surface temperature anomalies across the northern Indian Ocean have eased significantly over recent weeks, reflecting the decline in the negative IOD event. The negative IOD event in the tropical Indian Ocean has persisted since mid-June and is expected to end in early December, reducing its influence on Australian rainfall patterns.
The SAM is currently positive and is likely to remain positive into early summer. An MJO of moderate strength is currently active over the western Pacific Ocean and is expected to move eastwards and remain moderately strong over the coming days. Given current and expected conditions, including the La Niña event and the return to a positive SAM, above average rainfall is expected to persist across eastern Australia over the coming weeks.
Difference from average sea surface temperature observations 14 to 20 November 2022
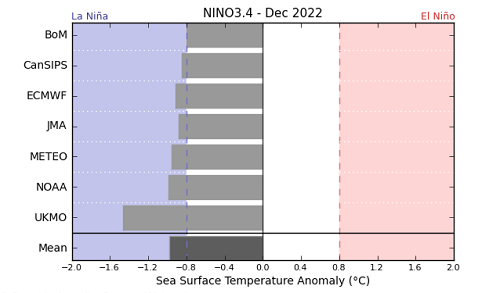
International climate model outlooks for the NINO 3.4 region in December 2022
Issued: 22/11/2021
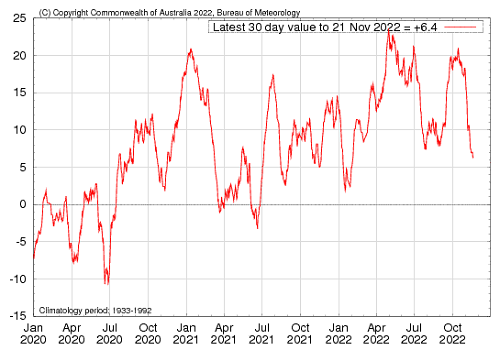
The La Niña event currently underway in the Pacific Ocean is expected to persist through the end of 2022 but start to ease in early 2023. All seven of the international models surveyed predict the La Niña event to remain active in December, but all models expect the La Niña event to dissipate by February 2023. For the period ending 21 November, the 30-day Southern Oscillation Index (SOI) value was +6.4 and the 90-day value was +14.3. The 30-day value has recently dropped below the La Niña threshold of +7, while the 90-day value remains above the threshold. La Niña events are associated with above average rainfall across eastern and northern Australia through spring and summer.
30-day Southern Oscillation Index (SOI) values ending 21 November 2021
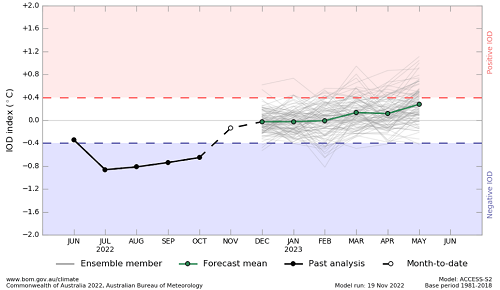
The negative IOD event in the Indian Ocean, which has persisted since mid-June, has continued to decline. As of 20 November 2022, the Indian Ocean Dipole (IOD) weekly index value was -0.06°C. This is the third consecutive week since mid-June that the IOD index value has not met the negative IOD threshold (−0.4°C). If the IOD index value remains below the negative threshold for another two weeks, the negative IOD event will be deemed over.
Sea surface temperature anomalies across the Indian Ocean have dissipated over the past two weeks, with temperatures returning close to average. Warmer than average sea surface temperatures have eased to the north-west of Australia compared to two weeks ago, while cooler than average sea surface temperatures near the horn of Africa have receded. Warm sea surface temperatures in the east of the Indian Ocean tend to result in above average rainfall across southern Australia and the far north throughout spring.
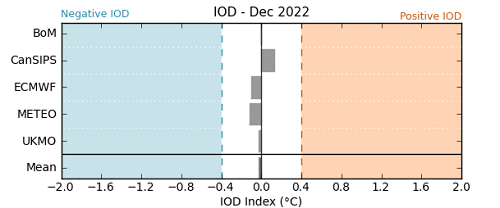
All international climate models surveyed by the Bureau of Meteorology predict the negative IOD event to persist throughout November, before declining rapidly by early summer.
Monthly sea surface temperature anomalies for IOD region
International climate model outlooks for the IOD in December 2022
Issued: 22/11/2022
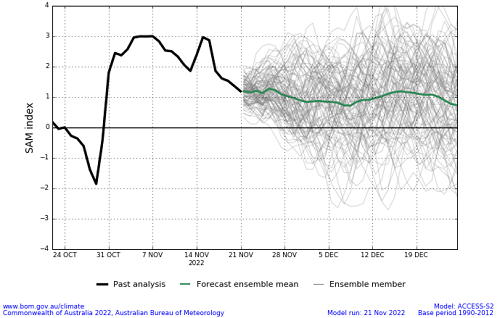
The Southern Annular Mode (SAM) is currently positive and expected to remain positive into early summer. The SAM refers to the north-south shift of the band of rain-bearing westerly winds and weather systems in the Southern Ocean compared to the usual position. A positive SAM in spring is associated with increased rainfall for parts of eastern New South Wales and Victoria as well as southern Queensland. It is also associated with decreased rainfall for parts of south-western and south-eastern Australia.
Southern Annular Mode (SAM) daily index
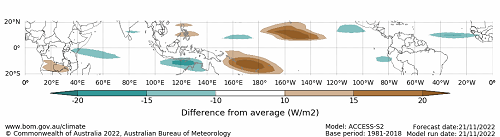
As of 21 November 2022, the Madden–Julian Oscillation (MJO) is at moderate strength over the western Pacific Ocean and is expected to remain moderately strong over the coming days. The MJO is a pulse of cloud and rainfall that moves eastward along the equator. An active MJO in the Pacific at this time of year increases the chance of above average rainfall over the eastern half of Australia.
Madden–Julian Oscillation (MJO) daily index
These climate outlooks are generated by ACCESS–S (Australian Community Climate Earth-System Simulator–Seasonal). ACCESS–S is the Bureau of Meteorology's dynamic (physics-based) weather and climate model used for monthly, seasonal, and longer-lead climate outlooks. For further information, go to http://www.bom.gov.au/climate/ahead/about/
The Bureau of Meteorology’s latest rainfall outlook for December indicates wetter than average conditions are expected across parts of Australia. The ACCESS-S climate model suggests there is a 60% to 80% chance of exceeding median rainfall for large areas of eastern, southern and northern Australia, with a 60% to 80% chance of below median rainfall for much of the north-west of Western Australia.
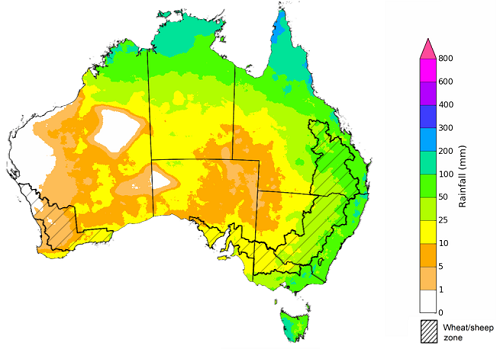
The outlook for December 2022 indicates that there is a 75% chance of rainfall totals between 10 and 100 millimetres across much of New South Wales, Queensland, Victoria, the Northern Territory, and the northern tip of Western Australia. For most areas in South Australia and the remainder of Western Australia, rainfall totals are not expected to exceed 25 millimetres. Rainfall totals in excess of 100 millimetres are expected across northern parts of Queensland and the Northern Territory, as well as isolated parts of north-eastern New South Wales and western Tasmania.
Across cropping regions there is a 75% chance of rainfall totals of between 25 and 100 millimetres across much of New South Wales and Queensland, as well as isolated parts of eastern Victoria. There is a 75% chance of less than 25 millimetres of rainfall for cropping regions in Western Australia, South Australia, and the remainder of Victoria, and the far south-west of New South Wales.
Given above average to well above average soil moisture level across most growing regions in eastern Australia this forecast rainfall is unlikely to further benefit winter crop yields but will allow for average or better pasture growth potential. Given the current wet conditions and an expectation for above average rainfall for the coming months, we are likely to see a drawn-out 2022 winter crop harvest and difficulties in completing intended summer crop planting in many regions.
Rainfall totals that have a 75% chance of occurring December 2022
Issued:24/11/2022
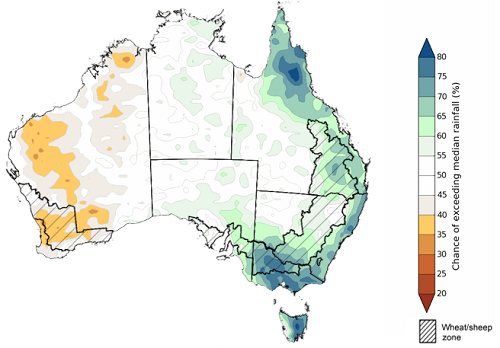
The rainfall outlook for December 2022 to February 2023 suggests there is a greater than 60% chance of exceeding median rainfall across most of Victoria, southern and eastern New South Wales, eastern Queensland, Tasmania, and eastern parts of South Australia. However, below median rainfall is more likely for large areas of Western Australia between December to February. For most of the remaining regions of Australia, there is no strong tendency towards above or below median rainfall (Bureau of Meteorology ‘National Climate Outlook’, 24 November 2022).
Bureau of Meteorology rainfall outlooks for December to February have greater than 55% past accuracy across most of Australia. Outlook accuracy is greater than 65% across parts of Queensland, South Australia, and the west coast of Western Australia. Past accuracy is low (less than 50%) for isolated parts of Western Australia, Queensland, the Northern Territory, and South Australia.
Chance of exceeding the median rainfall December 2022 to February 2023
Issued: 24/11/2022
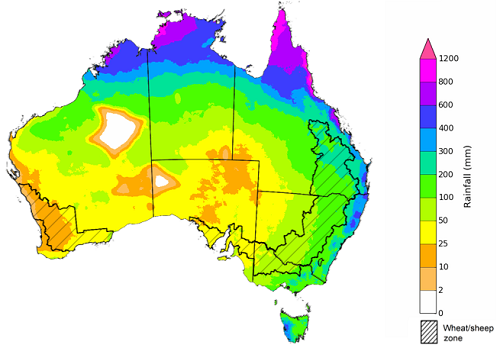
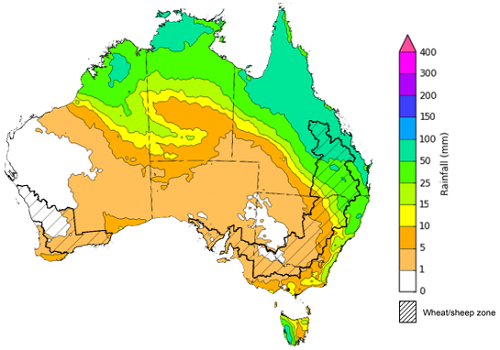
The outlook for December 2022 to February 2023 suggests there is a 75% chance of rainfall totals between 50 and 200 millimetres across most of Victoria, New South Wales, Queensland, the Northern Territory, Tasmania, as well as the north of Western Australia. Rainfall totals in excess of 200 millimetres are forecast for the north and east of Queensland, and northern parts of Western Australia and the Northern Territory, as well as isolated parts of alpine and eastern New South Wales, alpine Victoria, and south-west Tasmania.
Across cropping regions, there is a 75% chance of receiving between 50 and 200 millimetres across much of Victoria, New South Wales, and Queensland. Rainfall totals exceeding 200 millimetres are expected across most cropping regions in northern Queensland. Rainfall totals are not expected to exceed 50 millimetres in the cropping regions of South Australia and Western Australia.
Through late spring and early summer, winter crop grain quality, crop abandonment and the inability to plant summer crops are major risk factors associated with excessive moisture. Above average rainfall through late spring also increases the risk of waterlogging, negatively impacting crop development.
Across eastern Australia, winter cropping has already been heavily impacted by excessive moisture. As crops in these regions reach the final stages of maturation, a continuation of wet conditions may cause further grain quality downgrades and delay harvesting. Moreover, the wet conditions are likely to continue to interrupt the planting of summer crops. In Western Australia and South Australia, average to below average rainfall over the next few months will likely allow the harvesting of winter crops to progress with minimal interruption.
Rainfall totals that have a 75% chance of occurring December 2022 to February 2023
Issued: 24/11/2022
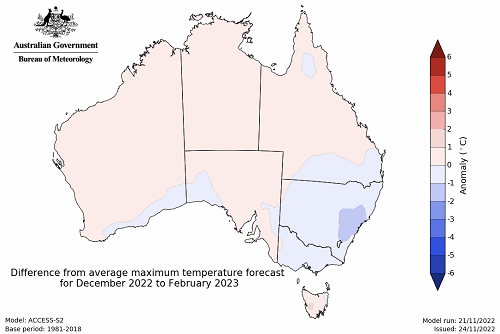
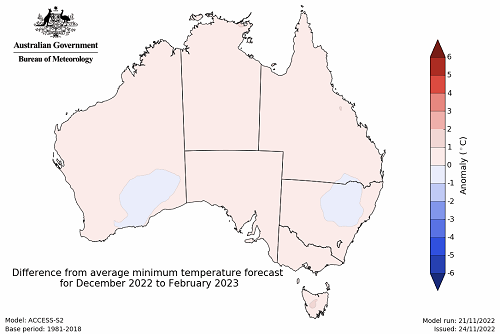
The temperature outlook for December 2022 to February 2023 indicates that maximum temperatures across most of Australia are likely to be close to the 1990-2012 average (the difference in the range of - 1°C to +1°C), with slightly lower than average maximum temperatures across eastern New South Wales. Minimum temperatures across most of Australia are expected to be close to the 1990-2012 average (the difference in the range of - 1°C to +1°C) (Bureau of Meteorology ‘National Climate Outlook’, 24 November 2022).
Predicted maximum temperature anomaly for December 2022 to February 2023
Predicted minimum temperature anomaly for December 2022 to February 2023
Over the 8-days to 1 December 2022, high-pressure systems over southern Australia are forecast to bring limited rainfall across much of the southern half of Australia. Meanwhile, low-pressure systems and a broad trough is forecast to bring moderate to heavy rainfall to northern and eastern Queensland, and northern areas of the Northern Territory and Western Australia. Low-pressure systems and frontal activity are forecast to bring moderate rainfall to parts of eastern New South Wales and western Tasmania.
In Australian cropping regions, rainfall totals of between 10 to 100 millimetres are expected across much of Queensland, as well as isolated parts north-eastern New South Wales. Little to no rainfall is forecast for remaining cropping regions during the next 8-days.
The easing of wet conditions across flood-affected cropping regions of eastern Australia will likely allow floodwaters to recede and reduce the risk of further waterlogging and reductions in yield potential. The forecast drier conditions are also expected to provide an opportunity for soils to drain and allow improved access to fields for harvest activities. Moderate falls forecast across most cropping regions in Queensland and northern New South Wales are likely to bring renewed delays to the harvesting of winter crops and planting of summer crops following two relatively dry weeks.
The outlook for winter crops across South Australia and Western Australia remains very promising, as ideal conditions for the season to-date have established strong yield potentials. With little rainfall forecast for cropping regions across these two states over the next week, this should provide favourable conditions for crop maturation and harvesting activities.
Total forecast rainfall (mm) for the period 24 November to 1 December 2022
Note: This rainfall forecast is produced from computer models. As the model outputs are not altered by weather forecasters, it is important to check local forecasts and warnings issued by the Bureau of Meteorology.
Water
Water storages, water markets and water allocations - current week
The Tableau dashboard may not meet accessibility requirements. For information about the contents of these dashboards contact ABARES.
