
This indicator measures the harvest levels of wood products in relation to future yields. The capacity to implement strategies to deal with changing demand for forest products based on future yields from both native and plantation forests is an integral part of sustainable forest management.
This part of Indicator 2.1c: Annual removal of wood products compared to the volume determined to be sustainable for native forests, and future yields for plantations, published October 2024, presents harvested wood volumes for sawlogs, pulplogs and other wood products from native forests and commercial plantations.
- Australia harvested a total of 3.5 million cubic metres of native forest logs, 7.0 million cubic metres of plantation hardwood logs, and 16.7 million cubic metres of plantation softwood logs in 2020-21.
- Plantations contributed 87% of Australia’s total sawlog and pulplog harvest in 2020-21.
- Softwood plantations supplied 82% of the total sawlog volume produced in Australia in 2020-21.
- Native forests remain the main source of hardwood sawlogs, producing 72% of the total volume in 2020-21.
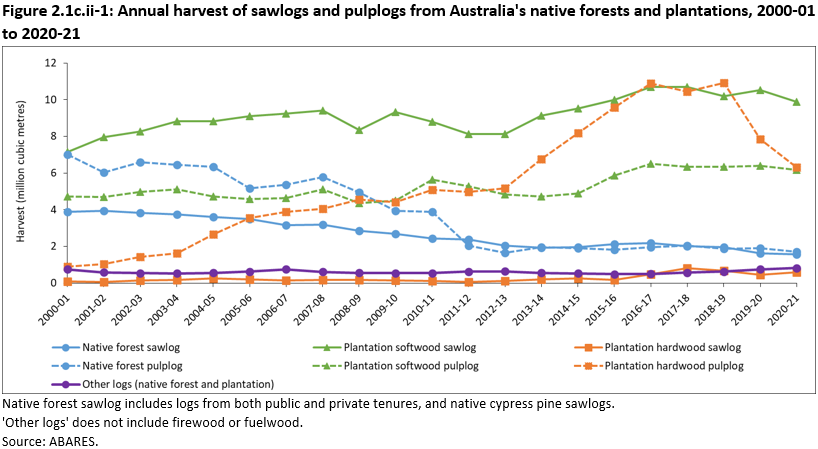
A total of 3.5 million cubic metres of native forest logs, 7.0 million cubic metres of plantation hardwood logs and 16.7 million cubic metres of plantation softwood logs were harvested in 2020-21 from both public and private land tenures (Figure 2.1c.ii-1).
Of the total logs harvested in native forest in 2020-21, 48% by volume were sawlogs and 52% were pulplogs. Of the harvested hardwood plantation logs, 9% of the volume was sawlogs and 91% was pulplogs. For plantation softwood logs, 62% of the harvested volume was sawlogs and 38% was pulplogs. A comparatively small volume of other logs (not including firewood or fuelwood) account for the remaining total log harvest from native forests and plantations.
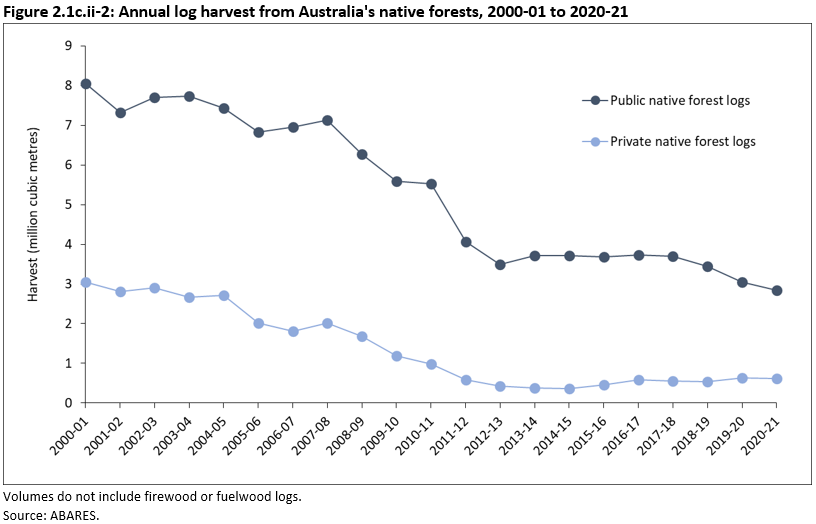
From 2000-01 to 2020-21, the sawlog and pulplog harvest from native forests steadily decreased (by 70%), while the harvest volume from plantations generally increased (by 79%, Figure 2.1c.ii-1). The harvest volume from private native forests followed a declining trend from 2000-01 to 2014-15, rising in 2015-16 and then remaining relatively steady over the 2016-17 to 2020-21 five-year period (Figure 2.1c.ii-2). The contribution of plantations to Australia’s total combined sawlog and pulplog harvest volume steadily increased from 54% in 2000-01 to 87% in 2020-21.
Native forests remain the main source of hardwood sawlogs, producing 72% of the total volume in 2020-21, compared to 92% in 2015-16 (Figure 2.1c.ii-1). Although the overall proportion of hardwood sawlogs from plantations increased slightly since 2015-16, it remains low because most existing hardwood plantations are not managed to produce sawlogs, or are not able to produce sawlogs (due to factors such as species suitability and growth rates). Plantation grown hardwoods generally cannot be used to produce the feature-grade sawn timber products attainable from native forest hardwood sawlogs.
Softwood plantations supplied 82% of the total sawlog volume produced in Australia in 2020-21, compared to 64% in 2000-01 (Figure 2.1c.ii-1). This proportional increase was due to the reduction of harvest volumes in native forests over this time and additional softwood plantations reaching maturity.
A sharp reduction in harvested plantation hardwood pulplog harvest volumes was observed between 2018-19 and 2020-21 (42% reduction over that time) (Figure 2.1c.ii-1). As the majority of hardwood plantation pulplogs are exported as woodchips to markets in Asia, harvest levels are sensitive to global demand and competition. From 2018-19, international competition increased, and importers sought lower priced resource from alternative suppliers.
Click here for a Microsoft Excel workbook of the data for Figure 2.1c.ii-1.
Click here for a Microsoft Excel workbook of the data for Figure 2.1c.ii-2.
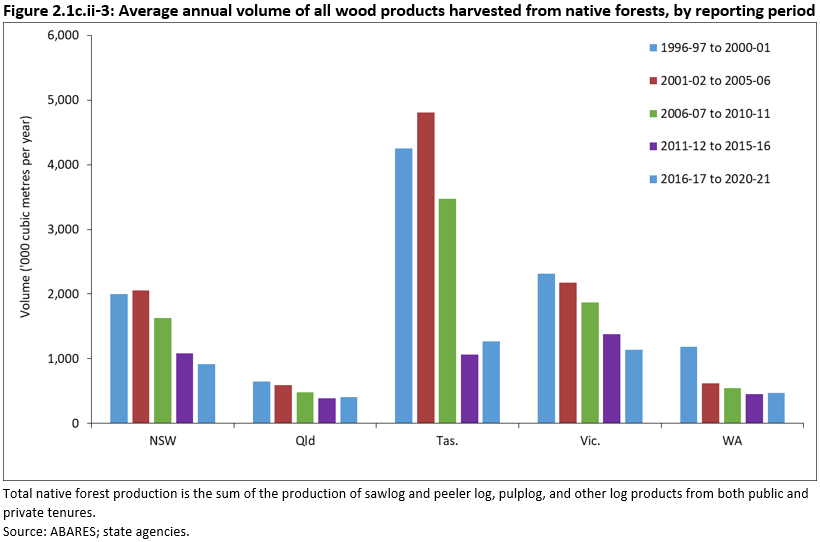
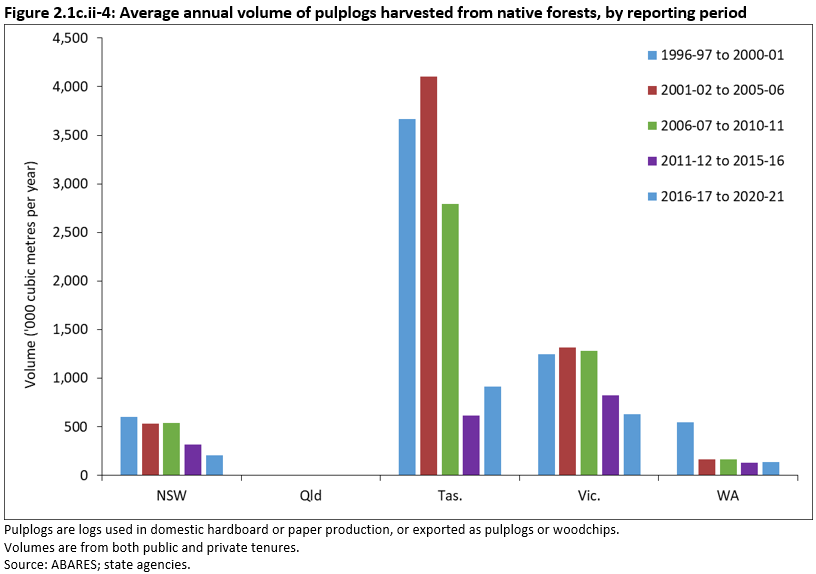
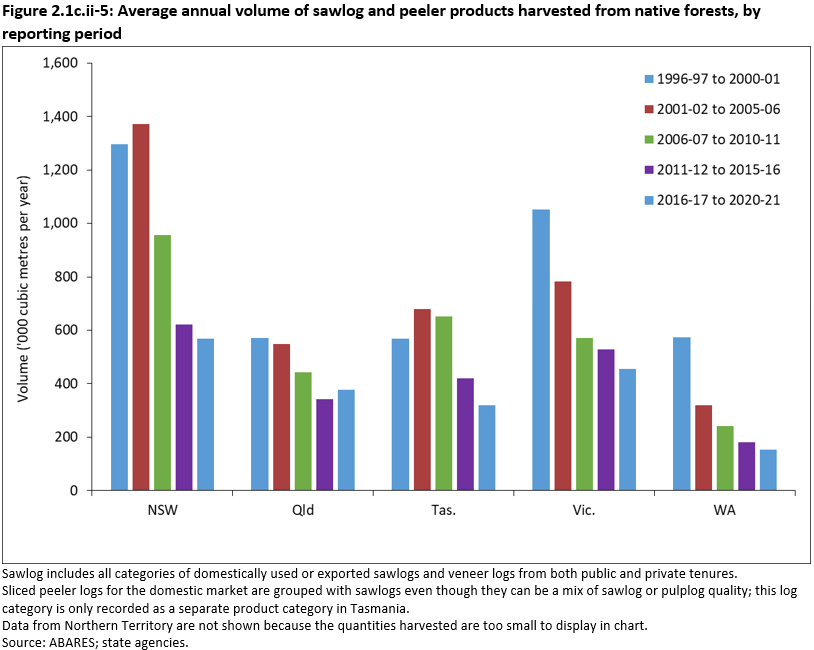
Since the Australia’s State of the Forests Report series began in 1998, the average annual harvest of total wood products from all native forests managed for wood production in Australia fell by 60% from 10.4 million cubic metres in 1996-97 to 4.2 million cubic metres in 2020-21 (Figure 2.1c.ii-3). The largest component of this was the decrease in the national average annual pulplog harvest, from 6.1 million cubic metres to 1.9 million cubic metres for the same period (a 69% decrease) (Figure 2.1c.ii-4). The national average annual sawlog harvest (including peeler logs) fell from 4.1 million cubic metres to 1.9 million cubic metres for the same period (a 54% decrease) (Figure 2.1c.ii-5). Note the composition of products in each category differ to those presented in sections of Indicator 2.1c.i (refer to notes for Figures 2.1c.ii-1 and 2.1cii-3 to 2.1c.ii-6).
For all reporting periods except 2011-12 to 2015-16, Tasmania produced the largest volume of wood products from native forests. Proportionally, 40% of the total volume of wood products harvested from native forests in Australia since 1996-97 has come from Tasmania. This high level was due primarily to the production of high pulplog volumes between 1996-97 and 2010-11 (Figure 2.1c.ii-4). Outcomes of Tasmanian Forest Agreements in 1997 and 2013, and disruptions to pulplog and woodchip export markets, resulted in significant declines in total harvested volumes.
Since 1996-97, New South Wales has consistently been the highest producer of sawlogs from native forests, followed by Victoria. Together these two states have contributed 56% of the total sawlog volume harvested from native forests in Australia (Figure 2.1c.ii-5).
Tasmania and Victoria have been the highest producers of pulplogs from native forests since the Australia’s State of the Forests Report series began in 1998 and together have contributed 84% of the total harvested volume of pulplogs in Australia between 1996-97 and 2020-21. During the most recent five-year reporting period these two states produced 82% of Australia’s total harvested pulplog volume from native forests. The majority of pulplogs harvested from native forests in Victoria have been processed locally and used in the production of paper, with the remainder exported as woodchips. Most pulplogs harvested from native forests in Tasmania, New South Wales and Western Australia have been exported as woodchips, primarily to Asia. Queensland has not produced pulplogs from native forests since the 1996-97 to 2000-01 reporting period because harvested tree species from these forests are generally not suitable for use in paper production.
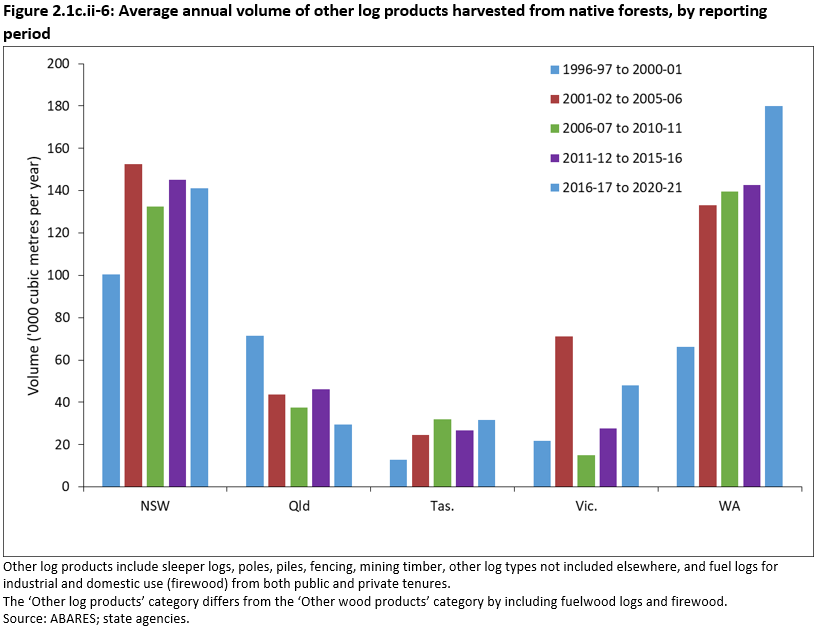
All five states produce a range of ‘other log products’ from native forests such as poles and piles, fencing timbers, firewood and fuelwood (Figure 2.1c.ii-6). The 2016-17 to 2020-21 five-year reporting period saw an increase in ‘other log product’ volume harvested in native forests from the preceding five-year period in all states except New South Wales (3% decrease) and Queensland (36% decrease). The increases in Tasmania, Victoria and Western Australia were primarily due to an increase in reported harvest volumes of firewood/fuelwood.
Poles and piles represent a comparatively high proportion of the ‘other log product’ volumes harvested in New South Wales native forests. Between 2016-17 and 2020-21 an average annual volume of 27.1 thousand cubic metres of poles and piles were harvested in New South Wales, primarily for use as high-value power poles. Since 1996-97, New South Wales has produced 59% and Queensland 22% of the total volume of poles and piles harvested from native forests in Australia.
Click here for a Microsoft Excel workbook of the data for Figure 2.1c.ii-3.
Click here for a Microsoft Excel workbook of the data for Figure 2.1c.ii-4.
Click here for a Microsoft Excel workbook of the data for Figure 2.1c.ii-5.
Click here for a Microsoft Excel workbook of the data for Figure 2.1c.ii-6.
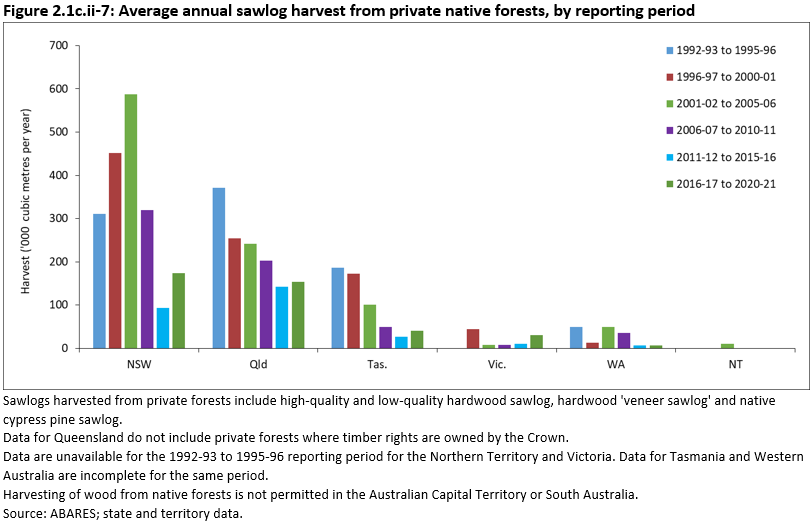
For all Australia’s State of the Forests Report reporting periods, the supply of sawlogs from private native forests has been significant in New South Wales, Queensland and Tasmania, and comparatively small in Victoria and Western Australia (Figure 2.1a.ii-7). The Northern Territory only reported private native forest sawlog production in two of the past six reporting periods. The harvesting of sawlogs from private native forests is not permitted in the Australian Capital Territory or South Australia.
In the 2016-17 to 2020-21 period, the volume of sawlogs harvested from private native forests increased by 87% in New South Wales, 8% in Queensland, 56% in Tasmania, and 185% from a very low volume in Victoria (harvested volumes are small in that state) from the 2011-12 to 2015-16 period (Figure 2.1c.ii-7). These increases are partly due to the processing industry taking a more proactive approach to the sourcing of resource from private native forests as an alternative to the diminishing supply from multiple-use public native forests.
For the period 2016-17 to 2020-21, the Northern Territory reported a small amount of sawlog production from native forests in East Arnhem Land under Indigenous ownership. An average annual of 240 cubic metres of hardwood sawlog (primarily Darwin stringybark – Eucalyptus tetrodonta) was processed at a small sawmill owned by Gumatj Corporation Ltd.
There is no calculated sustainable yield for wood production from native forests on private land for any state or territory, and there is insufficient information to adequately assess whether the current or future rate of wood harvest from private native forests is sustainable. Increased harvesting restrictions in all states over time have led to a general reduction in wood volumes harvested from private native forests.
In practice, most private native forest owners/managers make limited use of their native forests for wood production and only react to immediate needs and market opportunities (Commonwealth of Australia 2016). A study by Dare et al. (2017) found that only 20% of private native forest owners in northern New South Wales intended to carry out commercial wood harvesting in their native forests at some stage in the future. In a similar study by Dare and Eversole (2013), Tasmanian private native forest owners were surveyed to estimate future harvesting intent. This study found that 88% of respondents did not intend to harvest their forests in the three years following the survey.
A national assessment of the role, values and potential of private native forests completed in 2009 provided estimates of the contribution of private native forests to regional wood supply (Parsons and Pritchard 2009). This assessment found that despite adequate information on the area of private native forests, there was little information on their quality, condition, value, current management regime and future management intent. Although there has been no similar national-scale study since 2009, private native forest resource assessments have been carried out for the important wood producing regions of north-eastern New South Wales (NSW DPI 2019), Tasmania (Wilson and Tys 2020) and south-eastern Queensland (Francis et al. 2023). A 2024 study also examined the commercial potential for native forest wood harvesting in Indigenous-owned forests of East Arnhem, Northern Territory (Meadows et al. 2024).
Click here for a Microsoft Excel workbook of the data for Figure 2.1c.ii-7.
Pulplogs, low-quality sawlogs and other wood products are usually residual products from public and private native forest harvesting operations targeting high-quality products (such as high-quality sawlogs and veneer). Sometimes these lower-quality logs are produced during silvicultural operations such as thinning which is aimed at promoting the growth of future high-quality sawlogs. Thus, sustainable yields are not determined specifically for pulplogs and other lower quality wood products, which instead are usually treated as arisings from the high-quality sawlog harvest yields.
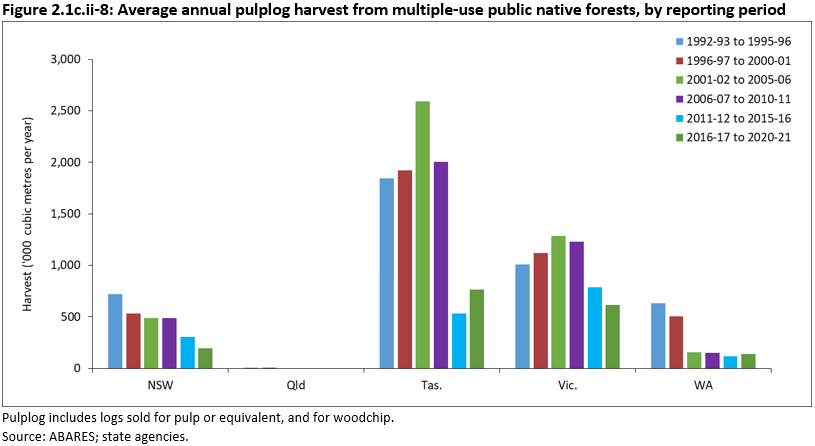
During the period 2016-17 to 2020-21, the average annual volume of pulplogs harvested from public native forest (Figure 2.1c.ii-8) in:
- Australia was 1.72 million cubic metres, a decrease of 59% since the reporting period 1992-93 to 1995-96
- New South Wales was 196 thousand cubic metres, a 35% decrease compared to the 303 thousand cubic metres in the preceding five-year period (2011-12 to 2015-16)
- Tasmania was 765 thousand cubic metres, a 44% increase compared to the 532 thousand cubic metres in the preceding five-year period
- Victoria was 616 thousand cubic metres, a 22% decrease compared to the 789 thousand cubic metres in the preceding five-year period
- Western Australia has remained relatively consistent since the 2001-02 to 2005-06 period.
In Queensland no pulplogs have been harvested from public native forests since a small amount was reported in the 1996-97 to 2000-21 period.
Click here for a Microsoft Excel workbook of the data for Figure 2.1c.ii-8.
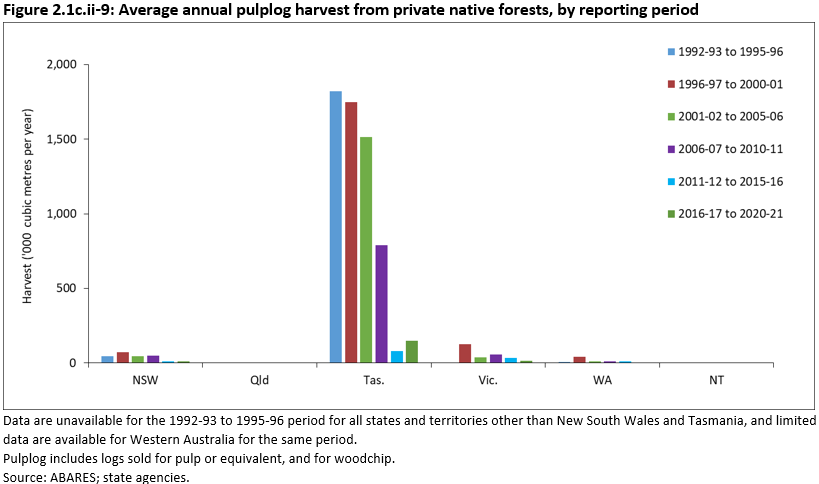
During the period 2016-17 to 2020-21, the average annual volume of pulplogs harvested from private native forests in Australia was 178 thousand cubic metres. This represents a decrease of 90% from 1996-97 to 2000-01 levels.
During the period 2016-17 to 2020-21, the average annual volume of pulplogs harvested from private native forest (Figure 2.1c.ii-9) in:
- New South Wales remained relatively steady compared to the 2011-12 to 2015-16 reporting period
- Tasmania increased from 82 thousand cubic metres for the reporting period 2011-12 to 2015-16 to 148 thousand cubic metres (80% increase)
- Victoria decreased from 33 thousand cubic metres for the period 2011-12 to 2015-16 to 17 thousand cubic metres (48% decrease).
Limited pulplogs were harvested from private native forests in Western Australia during the period 2016-17 to 2020-21 and none were harvested in any period in Queensland or the Northern Territory.
Click here for a Microsoft Excel workbook of the data for Figure 2.1c.ii-9.
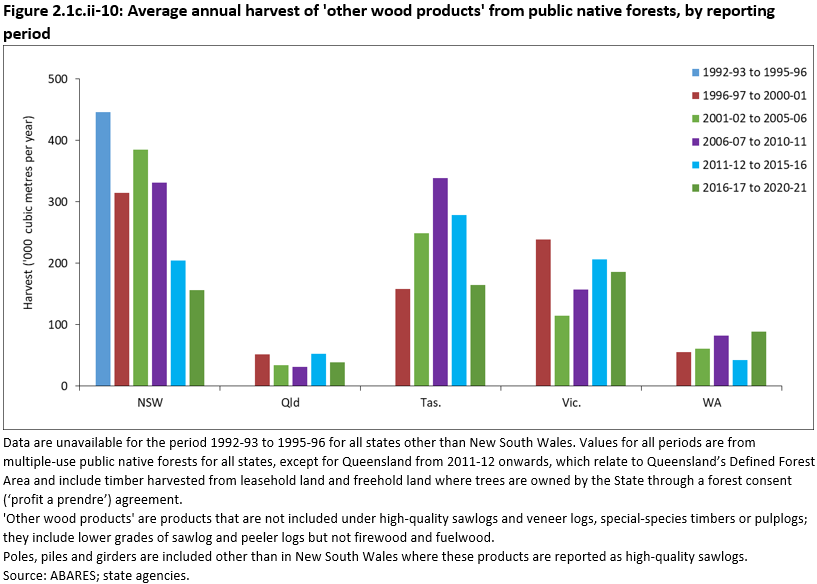
The national average annual harvest volume of ‘other wood products’ from public native forests for the period 2016-17 to 2020-21 was 634 thousand cubic metres. This compares with 818 thousand cubic metres for the 1996-97 to 2000-01 period, a decrease of 22% (Figure 2.1c.ii-10). Limited data are available for these products from private native forests, and from plantations.
The supply of ‘other wood products’, such as low-quality sawlogs, girders, poles, piles, as well as wood used in mines, split and round posts, bush sawn/hewn timber and sleepers (but excluding fuelwood logs and firewood) from native forests, varies by state. Although generally considered of lower quality than high-quality sawlogs and veneer, these products are nonetheless important for meeting the needs of Australian society. For example, hardwood timber pallets made from low-quality sawlogs are used to transport much of the nation’s food and other consumer goods. Most power poles currently in use to transmit electricity across the grid are made from hardwood timber sourced from public and private native forests. Hardwood power poles are preferred over concrete and metal alternatives due to cost, conductive properties and carbon footprint. As at 2006, an estimated 5 million (mostly hardwood) timber power poles were in-service across Australia, compared to 570 thousand poles made from concrete or metal (Qld DPIF 2006).
Fuelwood and firewood are treated separately and are discussed in the earlier section Wood products from native forests, and in Indicator 6.1d.
Click here for a Microsoft Excel workbook of the data for Figure 2.1c.ii-10.
Commonwealth of Australia (2016). Transforming Australia’s forest products industry: recommendations from the Forest Industry Advisory Council, Forest Industry Advisory Council, Department of Agriculture and Water Resources, Canberra.
Dare L, Eversole R (2013). Forest owner intent: Harvesting Tasmania’s non-industrial private forests – The intent of Tasmania’s private forest growers to harvest their forest estate, Report prepared for Private Forests Tasmania, Institute for Regional Development, Private Forests Tasmania, Hobart.
Dare L, Schirmer J, Mylek M (2017). Private native forest owner attitudinal survey – Northern NSW, University of Canberra, Canberra.
Francis B, Venn T and Lewis T (2023). Timber Production Opportunities from Private Native Forests in Southern Queensland, Small-scale Forestry 23:1-24. doi.org/10.1007/s11842-023-09550-2
NSW DPI (New South Wales Department of Primary Industries) (2019). A rating model applied to private native forest on the NSW north coast: Valuing the suitability of native forests for timber production, DPI Forest Science, Parramatta.
Parsons M, Pritchard P (2009). The Roles, Values and Potential of Australia’s Native Forests, RIRDC publication 09/049, Rural Industries Research and Development Corporation, Canberra.
Qld DPIF (Queensland Department of Primary Industries and Fisheries) (2006). Australian Timber Pole Resources for Energy Networks, Queensland Department of Primary Industries and Fisheries, Brisbane.
Wilson J, Tys E (2020). 2020 Tasmanian Private Forests Resource Review: A regional review of privately managed native and planted forest resources in Tasmania. Report prepared for Private Forests Tasmania, Hobart.