
This indicator is used to provide an understanding of the impact of fire on forests through the reporting of planned and unplanned fire. Fire is an important part of many forest ecosystems in Australia and may have either positive or negative impacts on forest health and vitality.
This is the Key information for Indicator 3.1b, published October 2024.
- Many of Australia’s forests are flammable, particularly if dominated by eucalypts.
- Larger areas of frequent low intensity fires generally occur in northern Australia, and infrequent but more intense fires generally occur in eastern, southern and south-western Australia.
- Over the period 2016-17 to 2020-21,
- a total of 46.9 million hectares (35%) of Australia’s total forest area was burnt. The balance (65%) did not experience fire.
- the largest national annual area of forest fire was 21.1 million hectares in 2019-20, of which 8.5 million hectares was burnt by the 2019-20 Black Summer bushfires in southern and eastern Australia.
- the area proportion of fire that was unplanned fire was highest (79%) during 2019-20, driven by unusually large forest areas burnt by bushfires in southern and eastern Australia.
- the lowest national annual area of forest fire was 10.5 million hectares in 2020-21.
- the cumulative area of fire in forest was 77.4 million hectares when accounting for forest areas burnt in each year of the period, with 84% of the cumulative area of fire in forests in Queensland and the Northern Territory reflecting the high frequency of fire experienced in northern Australia.
- Of the cumulative area of fires in forests 35% was planned and 65% was unplanned over the period 2016 17 to 2020-21.
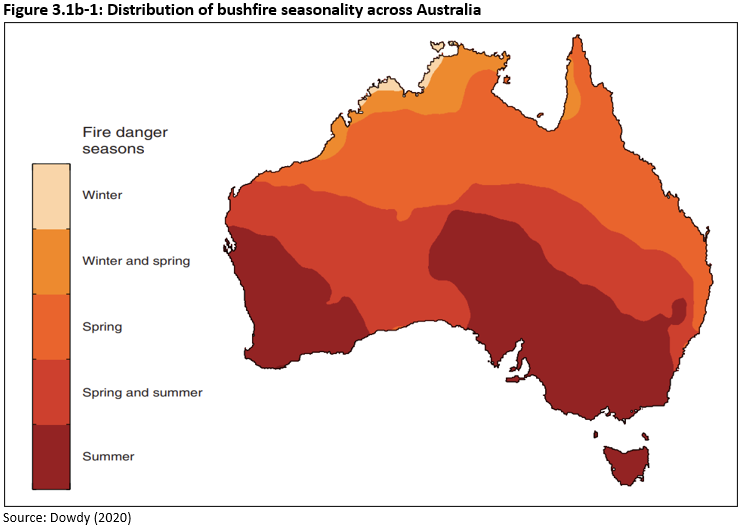
Many of Australia’s forests are flammable, particularly if dominated by eucalypts, and are adapted to a particular fire regime. Fires can be frequent but of relatively low intensity, as occur in much of northern Australia, or infrequent but more intense, as occur in eastern, southern and south-western Australia. Broadly, the incidence of fire in northern Australia usually occurs in winter and spring (monsoonal dry season) and is limited by fuel loads, while the incidence of fire in southern Australia usually occurs from spring into summer and is essentially limited by dryness of fuel (Figure 3.1b-1). For areas in northern New South Wales and southern Queensland, peak risk usually occurs in spring and early summer. The greatest extent of fire typically occurs in the Northern Territory and northern areas of Western Australia and Queensland, where large expanses of woodland forest are often ignited by lightning in the monsoonal dry season.
In Australia, planned fire is used by land managers to manage vegetation, and to protect properties from uncontrolled bushfire by reducing fuel loads. Indigenous Australians have long used fire as a land management tool, for example to maintain forest condition. The National Bushfire Management Policy Statement for Forests and Rangelands outlines Australian, state and territory governments’ objectives and policies for the management of landscape-level fire in Australia’s forests and rangelands. The statement was developed by the Forest Fire Management Group, a national body within the Australian Government ministerial council structure. A set of Objectives and Key Performance Indicators for the policy statement was released in October 2022.
Vegetation characteristics, weather patterns and their variability are among the key factors that affect the occurrence and severity of bushfires. Climate change is bringing more extreme weather conditions, longer bushfire seasons, and increasing occurrence of previously unusual events such as pyroconvection (the formation of a thunderstorm within a fire plume), with higher summer temperatures and lower or more patchy rainfall increasing the risks of fire and the challenges associated with fire management. The elements of fire weather are described by the Australian Bureau of Meteorology Fire Weather Knowledge Centre.
The fire area data used in this indicator were provided by state and territory agencies, and intersected by ABARES with the most recent forest extent dataset (Forests of Australia (2023)) to give the annual area of fire in forest in each jurisdiction for the five years from 2016-17 to 2020-21. Each year of data relates to Australia’s financial year from 1 July to 30 June.
Most fire data were classified into planned and unplanned fires by the providing agency. If data were unavailable then ABARES attributed fires as planned or unplanned based on the fire season and the location of each fire.
Summary fire area data are reported both as the cumulative area of forest fire in the five years from 2016-17 to 2020-21 (i.e. the sum of the annual forest fire areas), and also as the total area of forest burnt during the five-year period (the net fire footprint over the five years, which can be a smaller area than the cumulative area as some forest areas are burnt in more than one year in that period). Reporting the cumulative area of forest burnt can provide insights into the total scale of fire in the landscape and as such the potential fire management effort, context for the dynamics of fire in the landscape, and implications for ecological impact within the reporting period.
Comparisons to data published in Australia’s State of the Forests Report 2018 for the period 2011-12 to 2015-16 are also included to provide a 10-year overview as those data were collated by the same process.
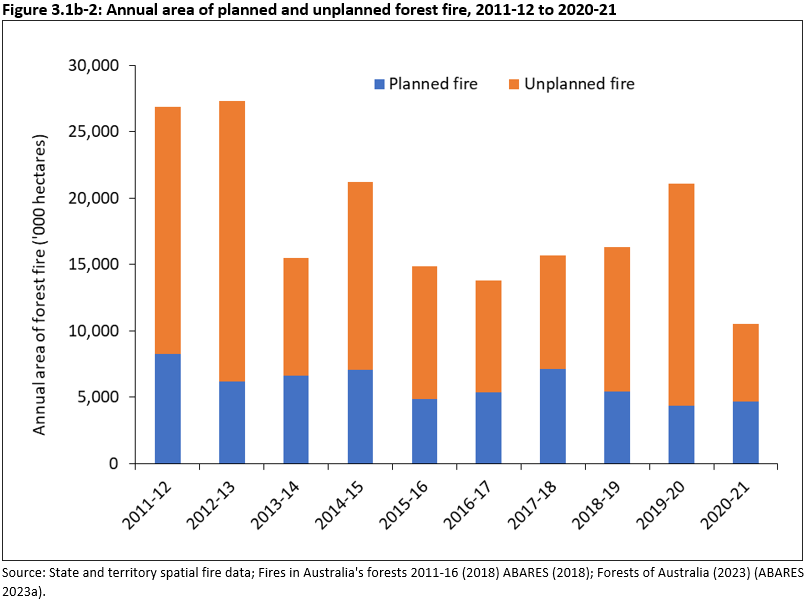
The annual area of fire in Australia (planned and unplanned) varies substantially between individual years (Figure 3.1b-2). The largest national annual area of forest fire over the 10-year period from 2011-12 to 2020-21 was 27.3 million hectares in 2012-13 (Figure 3.1b 2). The lowest national annual area of forest fire in this period was 10.5 million hectares in 2020-21.
Between 2016-17 and 2020-21, the area of forest burnt by unplanned fire exceeded the area burnt by planned fire in each year (Figure 3.1b 2). Furthermore, over the reporting period the annual area of forest burnt by unplanned fire is more variable than the area burnt by planned fire. Between 2016-17 and 2020-21, the area proportion of fire that was unplanned fire was highest (79%) during 2019-20, driven by unusually large forest areas burnt by bushfires in southern and eastern Australia—especially in New South Wales, Victoria, Western Australia and the Australian Capital Territory—during that fire year, referred to as the Black Summer bushfires (Figure 3.1b 2 and Table 3.1b-5 in Supporting information for Indicator 3.1b).
Click here for a Microsoft Excel workbook of the data for Figure 3.1b-2.
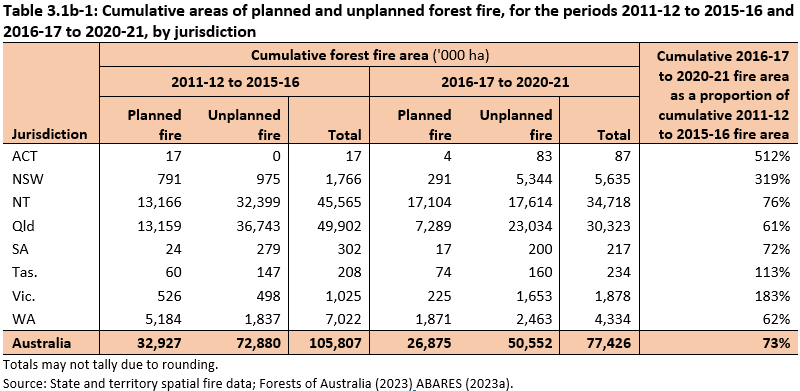
The total national cumulative forest fire area for the five fire seasons in the period 2016-17 to 2020-21 was 77.4 million hectares (Table 3.1b-1). This was calculated by summing the forest fire areas for the five individual years between 2016-17 and 2020-21. Of the cumulative forest fire area for 2016-17 to 2020-21:
- 50.6 million hectares (65%) was due to unplanned fire
- 26.9 million hectares (35%) to planned fire.
The Northern Territory and Queensland together accounted for 84% of the cumulative area of fire in forest for the five-year period 2016-17 to 2020-21, including 91% of the area of planned fire and 80% of the area of unplanned fire (Table 3.1b-5 in Supporting information for Indicator 3.1b).
The national cumulative forest fire area for the 2016-17 to 2020-21 period was 73% of the cumulative area reported for the previous five-year period (2011-12 to 2015-16) (Table 3.1b-1). This was driven by a reduction in fire areas across parts of northern Australia in both the Northern Territory (76%) and Queensland (61%). In contrast, the cumulative forest fire areas for each of the Australian Capital Territory, New South Wales and Victoria were substantially larger in the period 2016-17 to 2020-21 than in the period 2011-12 to 2015-16, driven by the unusually large areas of unplanned fire during 2019-20.
Click here for a Microsoft Excel workbook of the data for Table 3.1b-1.
The annual forest fire areas by jurisdiction and planned/unplanned status for the period 2016-17 to 2020-21 are given in Table 3.1b-5 in Supporting information for Indicator 3.1b.
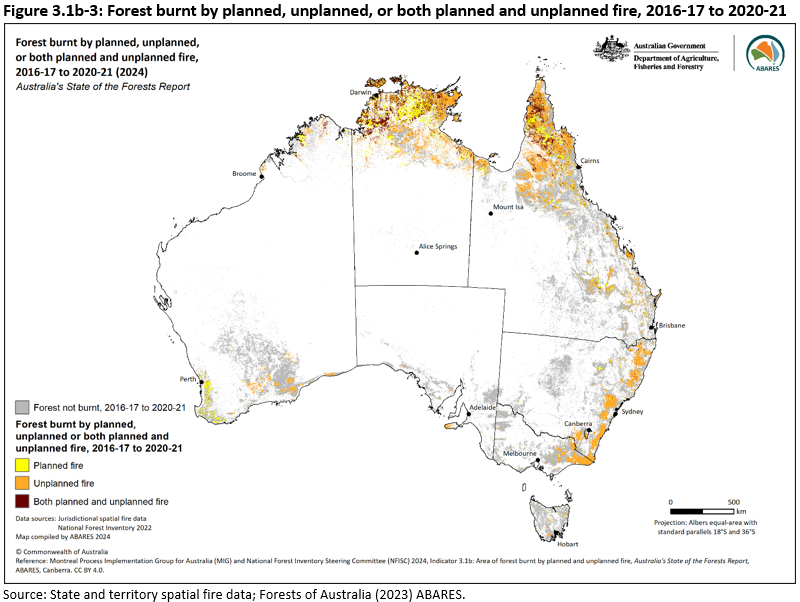
Figure 3.1b-3 shows the distribution of forest areas burnt during the period 2016-17 to 2020-21, by planned/unplanned status. In south-eastern Australia, forest was burnt mostly by unplanned fire, whereas in south-western Australia forest was burnt mostly by planned fire. In northern Australia, significant areas were burnt by planned fire only, unplanned fire only, and by both planned and unplanned fire during this period.
Click here to download a high-resolution version of Figure 3.1b-3.
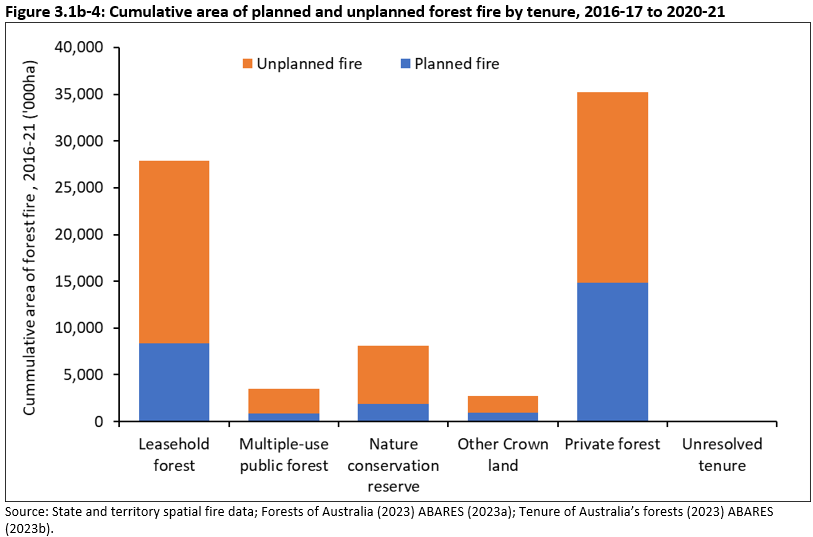
The largest cumulative areas of fire in forest during the period 2016-17 to 2020-21 were in Private forests (35.2 million hectares) and Leasehold forests (27.8 million hectares) (Figure 3.1b-4).
Planned fire during this period consistently accounted for smaller proportions of total forest fire area than unplanned fire. By tenure class, the proportion of total forest fire area that was planned fire varied from 24% of forest in Nature conservation reserves and 25% in Multiple-use public forest, to 42% in Private forest. (See Indicator 1.1a-ii for data and information on forests and land tenure).
Click here for a Microsoft Excel workbook of the data for Figure 3.1b-4.
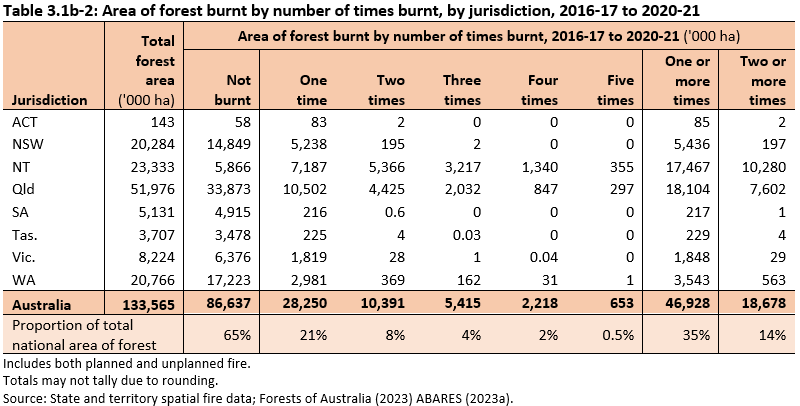
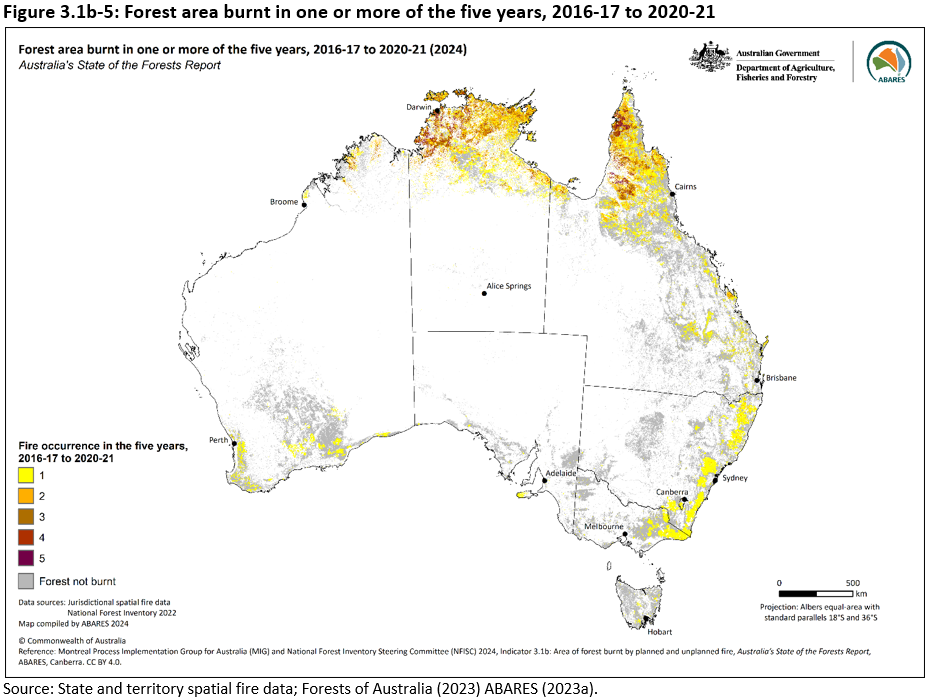
A total of 46.9 million hectares of forest (35% of Australia’s total forest area) burnt one or more times in this period, with the largest areas in Queensland (18.1 million hectares) and the Northern Territory (17.5 million hectares) (Table 3.1b-2) (Figure 3.1b-5). This is substantially less than the cumulative area of forest burnt multiple times in this period (77.4 million hectares, Table 3.1b 1) because some areas of forest were burnt multiple times in the five-year period from 2016-17 to 2020-21.
Of the 46.9 million hectares of forest that burnt one or more times during the five-year period 2016-17 to 2020 21, 28.3 million hectares was burnt once, and 18.7 million hectares of forest burnt two or more times. Of the forest burnt multiple times, 10.4 million hectares was burnt twice, and 0.6 million hectares was burnt five times (the latter mostly in Queensland and the Northern Territory) (Table 3.1b-2). The largest areas of forest that burnt two or more times were in Queensland (7.6 million hectares) and the Northern Territory (10.3 million hectares), together comprising 96% of the area of forest burnt two or more times. Most areas of forest burnt in southern Australia burnt only once during this period (Figure 3.1b-5).
A total of 86.6 million hectares of forest (65% of Australia’s forest area) did not burn during the five-year period 2016-17 to 2020-21. South Australia (96%) and Tasmania (94%) had the highest proportions of forest area that was not burnt during this period.
Click here for a Microsoft Excel workbook of the data for Table 3.1b-2.
Click here to download a high-resolution version of Figure 3.1b-5.
Of the 46.9 million hectares of forest burnt in the period 2016-17 to 2020-21, the largest areas of forest that burnt were in Private forest (18.2 million hectares, 43% of the forest on that tenure) and Leasehold forest (16.6 million hectares, 35% of the forest on that tenure) (Table 3.1b-3). Forest burnt on these two typically privately managed tenures comprises 74% of the total area of forest burnt in Australia in this period.
Forest in Nature conservation reserves (6.7 million hectares, 30% of the forest on that tenure) and Multiple-use public forest (3.3 million hectares, 31% of the forest on that tenure) also had significant proportions of forest area burnt during this period.
Most of the forest burnt in the period 2016-17 to 2020-21 in southern Australia occurred on publicly managed tenures of Nature conservation reserve and Multiple-use public forest (with most of this by unplanned fire). In Queensland and the Northern Territory, most of the forest burnt was on Private and Leasehold tenures, and was burnt by a combination of planned and unplanned fire.

Click here for a Microsoft Excel workbook of the data for Table 3.1b-3.
A total of 228 thousand hectares of commercial plantation area were burnt during the period 2016-17 to 2020-21. This represents 13% of Australia’s commercial plantation area (Table 3.1b-4). The area of commercial plantation burnt comprises bushfires, post-harvest burns, and light ground burns to reduce fuel loads.
The largest area of commercial plantation burnt during the period 2016-17 to 2020-21 was in New South Wales (97 thousand hectares), which is 43% of the total area of commercial plantation burnt in Australia during this period, and 26% of the area of commercial plantation in New South Wales.
Of the commercial plantation area burnt during this period, 61% (139 thousand hectares) was burnt during 2019-20. During that year, New South Wales (88 thousand hectares), South Australia (18 thousand hectares) and Victoria (10 thousand hectares) had the largest areas of commercial plantation affected by fire.
The potential impacts of the 2019-20 fire on forestry and the wood processing sector are reported in ABARES Insights paper - Issue 6, 2020.
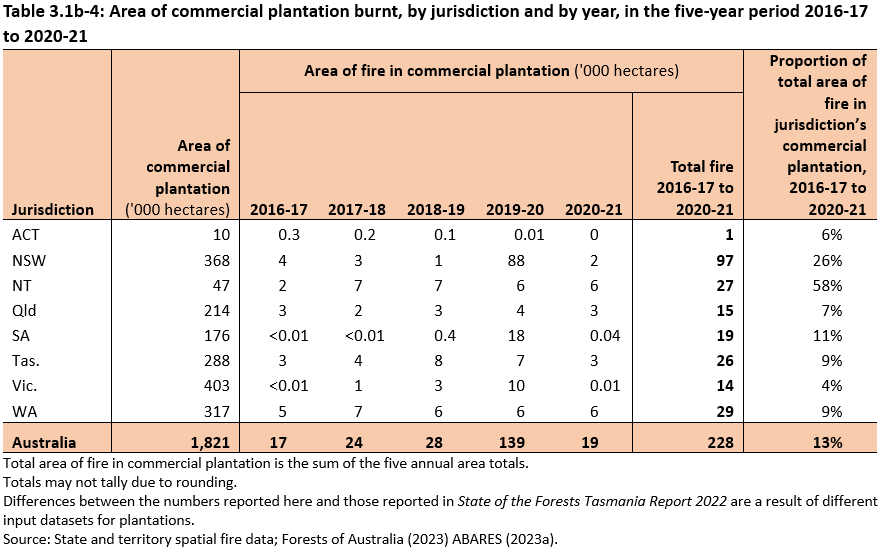
Click here for a Microsoft Excel workbook of the data for Table 3.1b-4.
ABARES (2023a). Forests of Australia (2023), Australian Bureau of Agricultural and Resource Economics and Sciences, Canberra, December. CC BY 4.0. doi.org/10.25814/6cay-a361
ABARES (2023b). Tenure of Australia's forests (2023), Australian Bureau of Agricultural and Resource Economics and Sciences, Canberra, December. CC BY 4.0. doi.org/10.25814/rb7t-hv26
Australian Government (2020). Royal Commission into National Natural Disaster Arrangements Report, Canberra, October 2020.
Dowdy AJ (2020). Seamless climate change projections and seasonal predictions for bushfires in Australia, Journal of Southern Hemisphere Earth Systems Science 70, 120-138. doi.org/10.1071/ES20001
Further information
- Area of forest fire by year, jurisdiction and planned/unplanned status, 2016-17 to 2020-21: full table
- Mapping the area of forest affected by planned and unplanned fire
- Case study: the 2019-20 Black Summer bushfires in southern and eastern Australia