
Key issues
- For the week ending 13 October 2021, weak low-pressure troughs across much of Australia resulted in isolated showers across central Australia. In the middle of the week, a low-pressure system and associated cold front resulted in substantial rainfall for parts of eastern Australia. Meanwhile, high pressure systems over southern Australia brought clear skies and dry conditions across the remainder of the country.
- For the 3 months to September 2021, modelled pasture growth was above average to extremely high across large areas of New South Wales, Victoria, eastern Queensland, parts of southern South Australia and the west of Western Australia. In contrast, modelled pasture growth was extremely low to below average across scattered areas of New South Wales, parts of southern Queensland, eastern South Australia, central Western Australia, and parts of central Northern Territory.
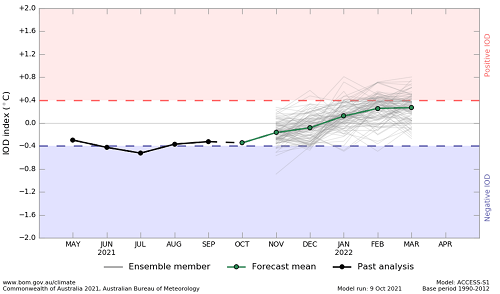
- The El Niño-Southern Oscillation (ENSO) conditions currently remain neutral. However, several indicators and all international climate models surveyed suggest the likely formation of a La Niña event in the coming months. The value of the Indian Ocean Dipole (IOD) index returned below the negative threshold (−0.4 °C) following a brief period of neutral values. The decline in the IOD value reflects warmer than average sea surface temperatures in the eastern Indian Ocean. A negative IOD is associated with increased spring rainfall in parts of southern Australia.
- The outlook for November 2021 to January 2022 suggests there is a 75% chance of rainfall totals between 50 and 300 millimetres across much of New South Wales, Queensland, Victoria, the Northern Territory and eastern Tasmania, as well as parts of South Australia and Western Australia. Rainfall totals in excess of 300 millimetres are likely across parts of eastern New South Wales and Queensland, alpine regions of New South Wales and Victoria, much of northern Australia and western Tasmania.
- Low-pressure systems and an associated cold front are expected to bring rainfall to eastern parts of Australia in the coming days. A low-pressure trough later in the week is expected to result in rainfall in the south-west. Otherwise, high-pressure systems across central and eastern Australia are expected to produce clear, dry conditions. Rainfall expected in southern New South Wales, the west of South Australia and Western Australia are likely to provide a final boost to yield potentials for winter crops as they continue to mature. However, dry conditions in western Victoria and eastern South Australia are expected to continue.
- Water storage in the Murray–Darling Basin (MDB) decreased by 63 gigalitres (GL) between 5 October 2021 and 12 October 2021. The current volume of water held in storage is 21,803 GL, which represents 86% of total capacity. This is 46% or 6,870 GL more than at the same time last year.
- Allocation prices in the Victorian Murray below the Barmah Choke increased from $116 per ML on 1 October 2021 to $152 per ML on 8 October 2021. Prices are lower in the Goulburn-Broken, Murrumbidgee, and regions above the Barmah Choke due to the binding of the Goulburn intervalley trade limit, Murrumbidgee export limit, and Barmah Choke trade constraint.
Climate
[expand all]
Rainfall this week
For the week ending 13 October 2021, weak low-pressure troughs across much of Australia resulted in isolated showers across central Australia. In the middle of the week, a low-pressure system and associated cold front resulted in substantial rainfall for parts of eastern Australia. Meanwhile, high pressure systems over southern Australia brought clear skies and dry conditions across the remainder of the country.
Rainfall totals of between 10 and 50 millimetres were recorded across north-eastern New South Wales, parts of southern and western Queensland, south-eastern Victoria, as well as isolated parts of South Australia, south-west Western Australia, the Northern Territory and eastern Tasmania. Rainfall totals in excess of 50 millimetres were recorded across parts of north-eastern New South Wales, as well as isolated parts of Queensland, the Northern Territory and western Tasmania.
In cropping regions, rainfall totals of between 10 and 50 millimetres were recorded across northern New South Wales, parts of southern Queensland, and the south-east of Western Australia. Little to no rainfall was recorded in cropping regions in southern New South Wales, central and northern Queensland, Victoria, South Australia and much of Western Australia.
The patchy falls across part of southern Queensland and northern New South Wales have likely delayed harvesting activities for winter crops. Rainfall in these regions may also negatively impact mature crops through quality downgrades. Despite the lack of rainfall across southern cropping regions, soil moisture levels are generally average to above average, and yield potentials remain strong. Flowering and grain filling in southern regions will continue over the remainder of October and into November as winter crops mature and senesce leading into harvest in late spring to early summer. During these final stages approaching harvest, dry conditions will benefit crop quality and harvesting activities. For summer crops, the relatively dry conditions in parts of Queensland likely encouraged planting activity to increase following rainfalls from previous weeks.
Rainfall for the week ending 13 October 2021

©Commonwealth of Australia 2021, Australian Bureau of Meteorology - Issued: 13/10/2021
Note: The rainfall analyses and associated maps utilise data contained in the Bureau of Meteorology climate database, the Australian Data Archive for Meteorology (ADAM). The analyses are initially produced automatically from real-time data with limited quality control. They are intended to provide a general overview of rainfall across Australia as quickly as possible after the observations are received. For further information go to http://www.bom.gov.au/climate/rainfall/
Pasture Growth
Pasture growth during the July to September period is typically low across large areas of central and northern Australia as it is firmly in the dry season. Across southern Australia, July to September pasture growth influences the number of livestock than can be supported without supplementary feeding over winter and the level of reliance on hay and grain to boost livestock production with the onset of spring.
For the 3 months to September 2021, above average rainfall totals and mild temperatures resulted in well above average pasture production for this time of year across most grazing regions.
Modelled pasture growth was above average to extremely high across large areas of New South Wales, Victoria, eastern Queensland, parts of southern South Australia and the west of Western Australia. This growth is likely to enable farmers to continue to rebuild stock numbers and provide opportunities to replenish fodder supplies during spring. In contrast, modelled pasture growth was extremely low to below average across scattered areas of New South Wales, parts of southern Queensland, eastern South Australia, central Western Australia, and isolated parts of central Northern Territory.
A dry end to winter and start to spring, and below average soil moisture levels in parts of western Victoria and the east of South Australia resulted in below average to average pasture growth. As a result, livestock producers in western Victoria and eastern South Australia will require substantial rainfalls through the remainder of spring to build soil moisture levels and supplementary feed to maintain current stock numbers.
Relative pasture growth for 3-months ending September 2021 (1 July to 30 September 2021)
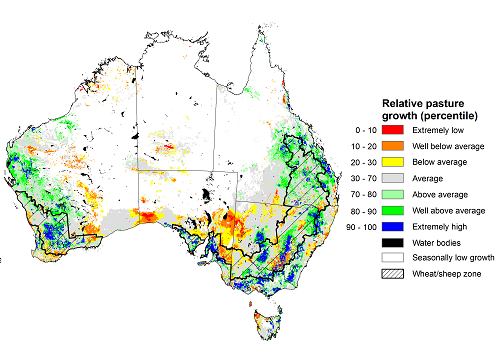
Notes: AussieGRASS pasture growth estimates are relative to the long-term record and shown in percentiles. Percentiles rank data on a scale of zero to 100. This analysis ranks pasture growth for the selected period against average pasture growth for the long-term record (1957 to 2016). Pasture growth is modelled at 5km2 grid cells.
Source: Queensland Department of Science, Information Technology and Innovation
Climate Drivers
Throughout late spring and early summer the climate drivers with the largest potential impact on Australia’s climate patterns are the El Niño–Southern Oscillation (ENSO), the Indian Ocean Dipole (IOD) and the Southern Annular Mode (SAM). These climate drivers will likely influence the final yield prospects for Australia’s winter cropping season, pasture growth rates during this peak growth period and planting conditions for summer crops.
ENSO conditions currently remain neutral. However, several indicators and all international climate models surveyed suggest the likely formation of a La Niña event in the coming months. The Bureau of Meteorology recently upgraded its ENSO Outlook to La Niña ALERT, with a 70% likelihood of an event forming. La Niña events are associated with above-average rainfall for northern and eastern Australia during spring and summer.
The value of the IOD index returned below the negative threshold (−0.4 °C) following a brief period of neutral values. The decline in the IOD value reflects warmer than average sea surface temperatures in the eastern Indian Ocean. A negative IOD, and warmer sea surface temperatures in the eastern Indian Ocean, is associated with above average rainfall for much of southern Australia in spring. However, the negative IOD event is expected to dissipate with the onset of the northern monsoon in late spring to early summer, with the southward shift of the monsoon trough. The SAM is currently neutral and is expected to remain neutral over the coming week.
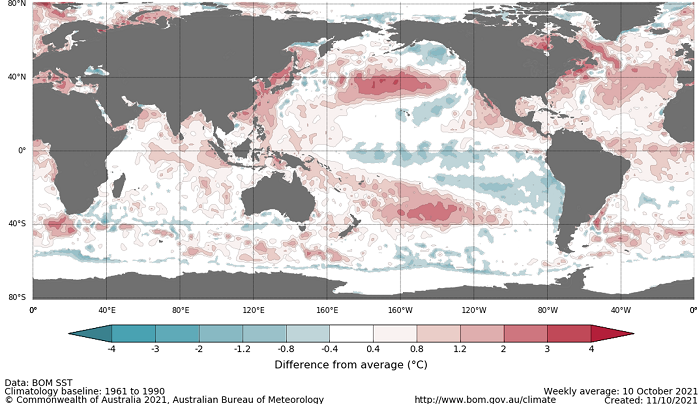
Below average sea surface temperature anomalies increased in the central and eastern tropical Pacific Ocean over the past week. Despite these temperature anomalies remaining within the neutral ENSO range, a continued cooling is anticipated across the equatorial Pacific, contributing to the development of a La Niña event in the coming months. Meanwhile, above average anomalies in the western Pacific Ocean and Maritime Continent have eased slightly. In the Indian Ocean, above average sea surface temperatures in the east and north of the basin have persisted, as reflected by a continuation of the negative IOD event.
Difference from average sea surface temperature observations 4 October to 10 October 2021
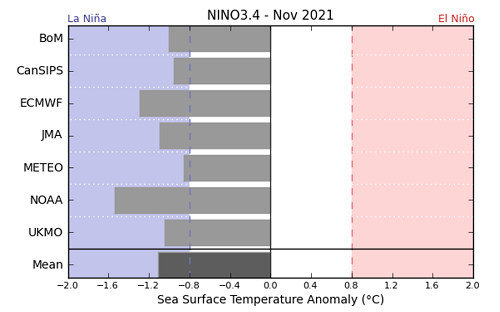
International climate model outlooks for the NINO 3.4 region in November 2021
©Commonwealth of Australia 2021, Australian Bureau of Meteorology Issued: 12/10/2021
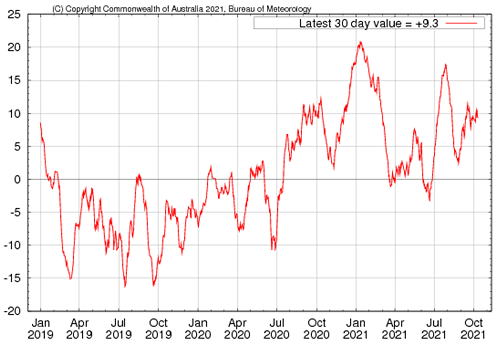
Atmospheric and oceanic indicators increasingly suggest the likely formation of a La Niña event over the coming months. Although monthly sea surface temperatures remain within the neural range, all international models surveyed predict the formation of a La Niña event in November 2021. The anticipation of a La Niña event is underpinned by a cooling of sea surface temperatures in the central and eastern equatorial Pacific Ocean, a strengthening of tropical trade winds and consistently below average cloudiness near the Date Line. Furthermore, for the period ending 10 October the 30‑day Southern Oscillation Index (SOI) value was 9.4 and the 90‑day value was 8.8, both of which are above the La Niña threshold of +7.
30-day Southern Oscillation Index (SOI) values ending 10 October 2021
As at 10 October 2021, the Indian Ocean Dipole (IOD) weekly value was -0.53°C. The majority of international climate models surveyed by the Bureau of Meteorology expect the IOD to return to neutral in November and remain neutral throughout summer. Above average sea surface temperatures in the eastern Indian Ocean are likely to persist as the negative IOD event dissipates and will continue to influence rainfall patterns.
Monthly sea surface temperature anomalies for IOD region
National Climate Outlook
These climate outlooks are generated by ACCESS–S (Australian Community Climate Earth-System Simulator–Seasonal). ACCESS–S is the Bureau of Meteorology's dynamical (physics-based) weather and climate model used for monthly, seasonal and longer-lead climate outlooks.
For further information, go to http://www.bom.gov.au/climate/ahead/about/
The Bureau of Meteorology’s latest rainfall outlook indicated wetter than average conditions are expected for much of eastern, central, northern and southern Australia during November. The wetter than average conditions expected for most cropping regions may delay the harvesting of winter crops in eastern and southern cropping regions but support the germination and establishment of summer crops. The ACCESS-S climate model suggests there is close to a 65% chance of exceeding median November rainfall totals across much of eastern, central and southern Australia.
The outlook for November 2021 indicates that there is a 75% chance of rainfall totals between 10 and 100 millimetres across parts of eastern, northern, central and south-western Australia. Rainfall totals in excess of 100 millimetres are expected in parts of north-eastern New South Wales, alpine regions of New South Wales and Victoria, the north of the Northern Territory and western Tasmania.
Across cropping regions there is a 75% chance of rainfall totals of between 10 and 100 millimetres across New South Wales, Victoria, South Australia and southern parts of Western Australia. There is a 75% chance of rainfall less than 10 millimetres for northern and central cropping regions of Western Australia. The expected rainfall across northern growing regions is likely to boost soil moisture levels and support the establishment of summer crops. On the other hand, the rainfall is likely to disrupt harvesting of winter crops.
Rainfall totals that have a 75% chance of occurring November 2021
©Commonwealth of Australia 2021, Australian Bureau of Meteorology Issued: 7/10/2021
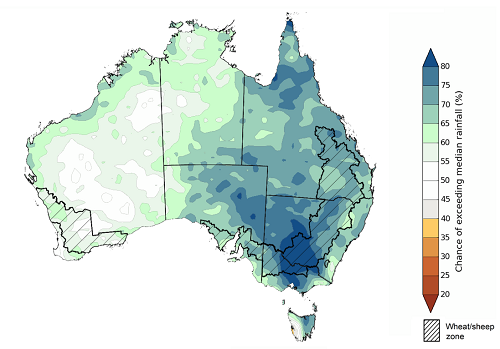
The rainfall outlook for November 2021 to January 2022 suggests there is a greater than 65% chance of exceeding median rainfall across much of New South Wales, Queensland, Victoria, South Australia and the south-east of the Northern Territory. For remaining regions of Australia, there is a 50% of above chance of exceeding median rainfall, with no regions expecting to receive below average rainfall between November 2021 and January 2022 (Bureau of Meteorology ‘National Climate Outlook’, 7 October 2021).
Bureau of Meteorology rainfall outlooks for November to January have greater than 55% past accuracy across most of Australia. Outlook accuracy is greater than 65% across parts of northern New South Wales, southern and northern Queensland, western Victoria, the south of South Australia and south-west Western Australia. On the other hand, there is low past accuracy for large areas of the south and north of the Northern Territory and parts of South Australia.
Chance of exceeding the median rainfall November to January 2021
©Commonwealth of Australia 2021, Australian Bureau of Meteorology Issued: 7/10/2021
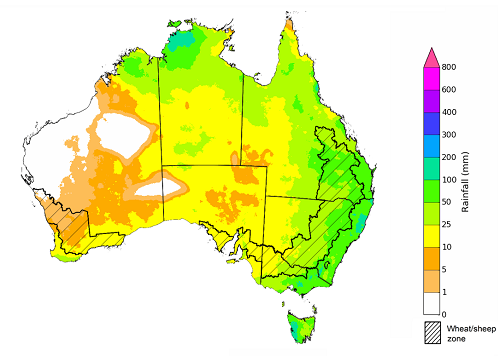
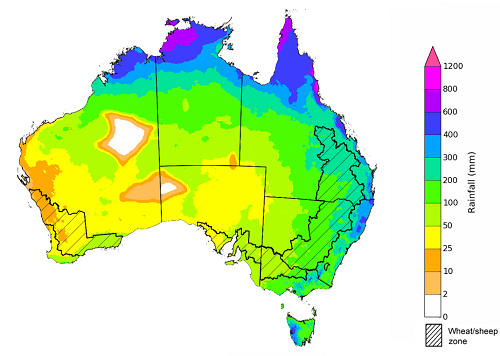
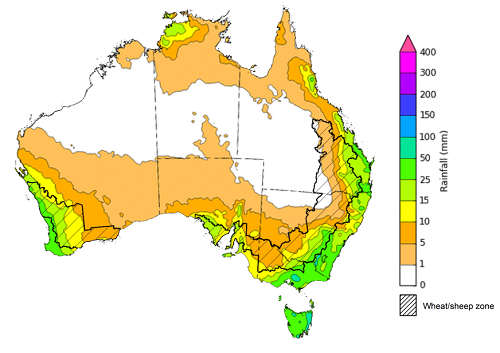
The outlook for November 2021 to January 2022 suggests there is a 75% chance of rainfall totals between 50 and 300 millimetres across much of New South Wales, Queensland, Victoria, the Northern Territory and eastern Tasmania, as well as parts of South Australia and Western Australia. Rainfall totals in excess of 300 millimetres are likely across parts of eastern New South Wales and Queensland, alpine regions of New South Wales and Victoria, much of northern Australia and western Tasmania.
Across cropping regions, there is a 75% chance of receiving between 50 and 200 millimetres across much of New South Wales, southern Queensland, Victoria, the east of South Australia and southern cropping regions of Western Australia. Rainfall totals in excess of 200 millimetres are forecast for north-eastern New South Wales, plus south-eastern and northern Queensland. Totals of less than 50 millimetres are expected across remaining cropping regions in the west of South Australia and Western Australia.
These rainfall totals are average or better for this three-month period across most Australian cropping regions, with the exception of northern cropping regions in Western Australia. Harvesting of winter crops will continue to progress southwards as we enter the late spring, early summer period. The above average rainfall expected for November across eastern and southern Australia is likely to delay harvesting activities and may adversely impact grain quality. As the winter crop season draws to a close, attention turns to northern growing regions and the summer crop. The above average rainfall expected between November and January will support the establishment and development of summer crops, as well as boosting soil moisture and water storage levels and supporting yield potentials.
Rainfall totals that have a 75% chance of occurring November to January 2021
©Commonwealth of Australia 2021, Australian Bureau of Meteorology Issued: 7/10/2021
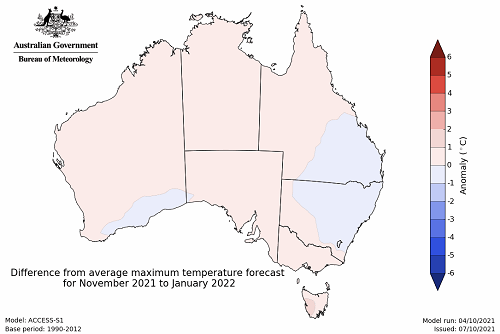
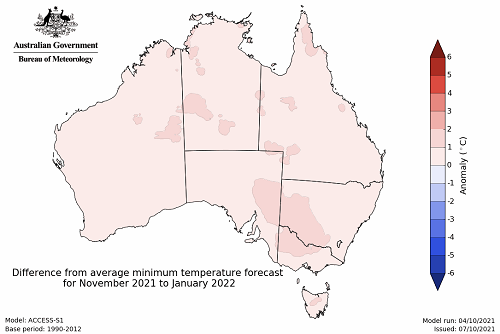
The temperature outlook for November 2021 to January 20221indicates that maximum temperatures across most of Australia are likely to be close to the 1990-2012 average (- 1°C to 1°C). Minimum temperatures are expected to be slightly above average for isolated patches across Australia and close to average for the rest of Australia (Bureau of Meteorology ‘National Climate Outlook’, 7 October 2021).
Predicted maximum temperature anomaly for November 2021 to January 2022
Predicted minimum temperature anomaly for November 2021 to January 2022
Rainfall forecast for the next eight days
Low-pressure systems and an associated cold front are expected to bring rainfall to eastern parts of Australia in the coming days. A low-pressure trough later in the week is expected to result in rainfall in the south-west. Otherwise, high-pressure systems across central and eastern Australia are expected to produce clear, dry conditions.
Rainfall totals of between 10 and 50 millimetres are forecast for much of eastern New South Wales and Queensland, south-eastern Victoria, the south of South Australia, the south-west of Western Australia, the north of the Northern Territory, as well as much of Tasmania. Rainfall in excess of 50 millimetres is expected in isolated parts of southern New South Wales and Victoria, as well as eastern Tasmania.
In Australian cropping regions, rainfall totals of between 10 and 50 millimetres are expected across south-eastern New South Wales, eastern Queensland, south-eastern Victoria, central and western parts of South Australia, as well as much of Western Australia. Lower rainfall totals of between 5 and 10 millimetres are expected across western and northern New South Wales, western Queensland and much of Victoria, the east of South Australia, as well as south-eastern cropping regions of Western Australia during the next 8 days.
The relatively dry conditions forecast across most northern growing regions will likely allow harvesting of winter crops to progress, as well as the planting of summer crops. Rainfall expected in southern New South Wales, the west of South Australia and Western Australia are likely to provide a final boost to yield potentials for winter crops as they continue to mature. Dry conditions in western Victoria and eastern South Australia are expected to continue. After a poor start to the winter season and a dry spring thus far, yield potentials are likely to continue to decline in areas with low soil moisture reserves, such as parts of western Victoria and eastern South Australia.
Total forecast rainfall (mm) for the period 14 October to 21 October 2021
©Commonwealth of Australia 2021, Australian Bureau of Meteorology - Issued: 13/10/2021
Note: This rainfall forecast is produced from computer models. As the model outputs are not altered by weather forecasters, it is important to check local forecasts and warnings issued by the Bureau of Meteorology.
Water
Water storages, water markets and water allocations - current week
The Tableau dashboard may not meet accessibility requirements. For information about the contents of these dashboards contact ABARES.
