
[expand all]
Fishery gross value of production (GVP)
Fishery gross value of production (GVP) provides an estimate of the activity level, in monetary terms, of commercial fisheries and aquaculture production. GVP is calculated by multiplying the whole weight of production by the landed unit value. The landed unit value is defined as the beach price for fish species caught in wild-catch fisheries and the farm gate price for aquaculture products. Beach price is used so that GVP measures what is directly produced from the resource and not the value-added component as product moves through the supply chain.
Price data can be derived from various sources, including fishers and aquaculture farm operators, seafood markets and seafood buyers and processors. Most fish are sold on a market away from the point of landing or aquaculture farm gate. As a result, transport and marketing margins are subtracted to estimate the beach or farm gate price that commercial fishers and aquaculture farmers receive (Figure 27).

Source: ABARES
To value production at the point of landing, whole weight equivalents are used for production volume. Similar to beach prices, valuing production in whole weight equivalents enables comparisons across regions and species. Whole weight equivalents for semi-processed fish are obtained by applying conversion factors for each species where production is not landed whole but in a semi-processed state, such as gutted, headed and gutted, or in an otherwise reduced condition.
Measurement of fisheries products trade
In this report the volume and value of fisheries trade is reported on a different basis from the volume and value of Australian fisheries and aquaculture production.
Exports are valued on a free on board (fob) basis—that is, the market price of fisheries products is valued as fob at the border. This may differ from the beach price because it will include any processing and transportation costs required for the product to be readied for export from Australia (Figure 28). The volume of exports is reported on a processed basis. Because of these differences volume and value of exports are not directly comparable to the volume and value of fisheries and aquaculture production. See Calculating apparent seafood consumption to understand how ABARES adjusts for these differences for the purposes of measuring seafood consumption in Australia.

Difference between real and nominal values
Broad-level increases in price levels across the economy are referred to as inflation. In the Australian context inflation is measured by the Australian Bureau of Statistics quarterly and reported as movement in the consumer price index (CPI) from one quarter to the next. Inflation makes comparing the value of fisheries production over the longer term problematic if the influence on the value of fisheries production from
CPI movements is not separated out when reporting in current period (nominal) terms. Changes in prices and the value of production between years can be more directly compared if they are inflation adjusted because the value of a dollar is held constant over time. The inflation-adjusted values used in Australian fisheries and aquaculture statistics reports are referred to as ‘real’ values and indicate the base year in which values are measured, for example in 2019–20 dollars.
Inflation in Australia generally averages around 2% a year, so changes to prices in the short run are not as affected by this as prices in the long run. For this reason recent year price changes are generally discussed in current period dollars.
Calculating apparent seafood consumption
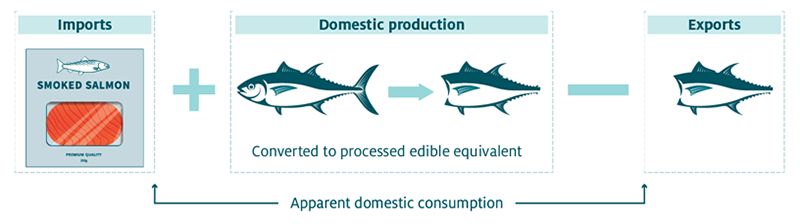
ABARES estimates annual apparent consumption as total edible quantity of seafood supplied domestically—that is, total production plus imported seafood, less exports of seafood (Figure 30). Apparent consumption provides an estimate of the total amount of seafood consumed in Australia assuming zero change in stocks. Apparent consumption is a measure often used to track the consumption of agricultural commodities over time.
The production quantity of Australian fishery and aquaculture products is reported in this publication on a whole weight basis, whereas trade data are reported on a processed basis. To align the units of measurement between production and trade data, production volume needs to be converted to a processed edible equivalent. Production volumes are adjusted to an edible quantity basis using species-specific conversion rates and excluding species that are known to be predominantly supplied for non-human consumption purposes, such as for aquaculture feed or bait. Imports and exports of seafood are sourced from the Australian Bureau of Statistics (ABS) trade data and are reported as edible weight. The apparent consumption per person is calculated as the total apparent consumption divided by the total Australian population in each year. The method applied here is consistent with that used by ABARES to estimate apparent consumption of other agricultural commodities produced in Australia.
The Food and Agriculture Organization of the United Nations (FAO) also compiles statistics on apparent consumption of seafood, applying a consistent method across all countries. FAO estimates indicate that for any given year annual consumption of seafood in Australia is higher on a per-person basis than estimates derived by ABARES using the above methodology. The discrepancy between FAO and ABARES estimates reflects differences in methodological approaches to estimating consumption. ABARES estimates seafood consumption on a processed edible basis, whereas the FAO provides its estimates on a whole weight basis.
Economic geography in Australian fisheries and aquaculture statistics
In this report a distinction is made between jurisdiction and location of catch. Jurisdiction of catch refers to whether the catch falls into state or Commonwealth jurisdictional waters. Location of catch refers to the state that the catch is landed in and includes Commonwealth catch distributed to the states. State catch data are reported on a jurisdictional basis.
Within jurisdictions management of fisheries are by fish stocks. This can involve restrictions on the type of fishing gear allowed as well as spatial boundaries of the fishery itself. Sometimes the spatial extent of two or more fisheries within the same jurisdiction will overlap. One example of this is the Commonwealth Eastern Tuna and Billfish Fishery and the Commonwealth Small Pelagic Fishery off eastern Australia.
State and territory fisheries agencies typically manage fisheries out to 3 nautical miles, while the Australian Government generally manages fisheries in waters from 3 nautical miles out to 200 nautical miles out from the Australian coast (Figure 31). This area is referred to as the Australian Fishing Zone. The majority of economic activity (wild-catch and aquaculture) occurs within the combined area of state-managed fisheries. This is because of the higher biological productivity of waters closer to shore, the location of high-value species and the geographic location of aquaculture production.
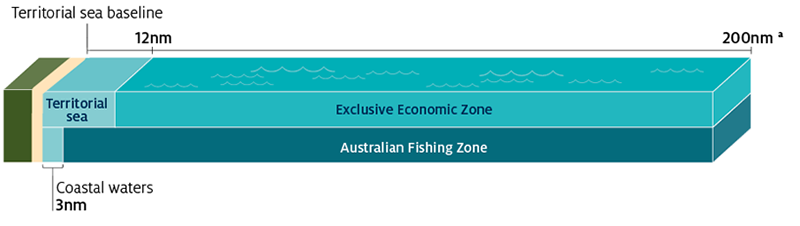
Source: Adapted from Geoscience Australia 2018