
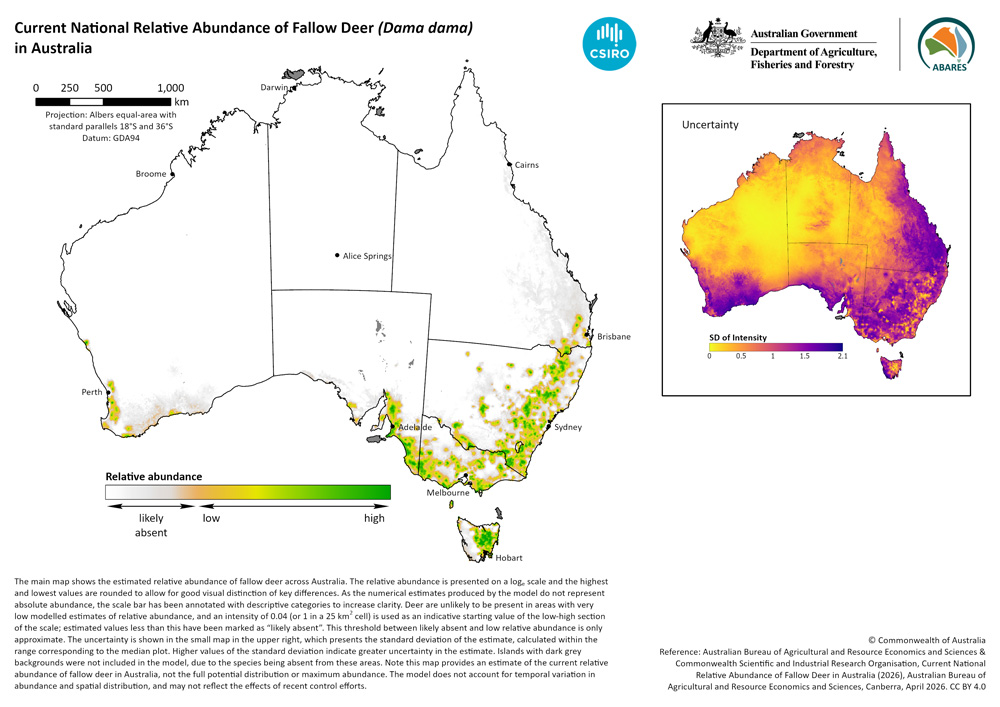
Current National Relative Abundance of Fallow Deer in Australia (2026) is a continental spatial dataset of the modelled current distribution of fallow deer (Dama dama) in Australia. The dataset contains a national map of the current relative abundance of fallow deer for each 5 km × 5 km cell in the raster grid, which is proportional to, but not equal to, the true or absolute abundance of fallow deer in that cell.
An integrated species distribution model was used to create this dataset. The model integrates different types of fallow deer data: ‘presence only’ (PO) data, which consists of opportunistic and unstructured observations of fallow deer from citizen science programs, biodiversity data atlases, feral animal control programs and other sources, ‘presence-absence’ (PA) datasets that are derived from camera trapping, and an ‘abundance-absence’ (AA) dataset from a roadside spotlight survey program. These were collated from Commonwealth, state and territory government agencies and other sources ranging from research institutions to citizen science platforms. A full list of data sources is provided in the metadata document.
To estimate the current distribution of fallow deer across Australia, conditional on the available data, a model was fit with seven environmental covariates representing the needs of fallow deer and the likelihood of colonisation (maximum temperature, distance to water, forest cover, grassland, topographic wetness, rainfall seasonality, and distance to modified grazing) along with a spatial random effect. The spatial random effect accounts for patterns in the data that are not explained by the covariates including spatial dependence in the current distribution of fallow deer (i.e., deer are more likely present or abundant at locations nearby other locations where they are present or abundant, and vice-versa) due to dispersal constraints or management effects. A more detailed description of the modelling methodology is provided in the metadata.
The dataset covers mainland Australia, Tasmania and King Island. Other offshore islands were excluded from the analysis as the barrier to spread means that island populations are predominately a result of historic introductions and eradications, rather than habitat suitability.
This modelled dataset should be used as a broad-scale estimate of the current distribution and relative abundance of fallow deer in Australia. It should not be used to plan local-scale control or monitoring efforts. Deer distribution is modelled at the national scale at a 5 km × 5 km grid and therefore does not reflect patterns of distribution and abundance that are influenced by environmental variation at finer scales. Information about imperfect detection and sampling design effects (in some data types) was not available and thus not accounted for in the model. For this reason, the model does not estimate deer abundance on an absolute scale, but rather a relative scale.
While every effort has been made to ensure that the dataset is correct at the time of publication, it is unlikely to accurately reflect the current distribution and relative abundance of feral deer where recent lethal suppression efforts, eradication programs, range expansions, or accidental or illegal releases have taken place, as the data available for mapping inherently lag the true distribution of the species. In particular, the South Australian government is currently conducting a state-wide deer eradication program which aims for population reductions followed by total eradication by 2032. As a result, the current relative abundance of fallow deer in South Australia may be overestimated by this dataset, which does not account for recent population declines due to control efforts. Similarly, current relative abundance of fallow deer is likely overpredicted in the Walls of Jerusalem National Park, where the Tasmanian government conducted a control program from 2023-2025 to prevent the spread of deer into the Tasmanian Wilderness World Heritage Area.
Records of fallow deer occurrence (presence or absence) are few or non-existent in some parts of Australia and frequent in others due to spatial biases in where occurrence data are collected. Although the model does account for some of these biases, there are still limitations in the occurrence data and modelling methods that will affect the accuracy of the modelled dataset. Lack of occurrence data in particular areas may lead to local underestimation of deer abundance. It will also increase the uncertainty associated with the estimates in those regions. It is therefore important for users to examine the standard deviation provided alongside median estimates to assess model uncertainty.
More information and updates about the occurrence and abundance of fallow deer can also be obtained from state and territory government primary industries and environment departments. Recent work from the Arthur Rylah institute has modelled the distribution and abundance on public lands of the four main deer species (fallow, red, sambar and hog deer) which occur in Victoria. The NSW and Queensland governments regularly produce maps of deer species in their states based on consultation with land and pest management organisations (DPIRD NSW distribution maps for vertebrate pests and DPI Qld annual pest distribution survey. The Tasmanian NRE has released a report estimating the abundance of fallow deer through much of the core of the species distribution in Tasmania, and project work is underway in the Tasmanian Wilderness World Heritage Area that includes eDNA monitoring for deer, which will improve understanding of deer distribution in this region.
This dataset is a product of the National Vertebrate Pests and Weeds Distribution project. An accompanying dataset for sambar deer (Cervus unicolor) is available: Current National Relative Abundance of Sambar Deer in Australia (2026). While the statistical methods are similar between these datasets, the relative abundance scales cannot be compared between the species. The Current National Occurrence of Feral Deer in Australia (2026) dataset contains maps of the known occurrence of each of the six species of deer in Australia (chital deer, hog deer, fallow deer, red deer, rusa deer and sambar deer), and the combined known occurrence of all deer in Australia.
This dataset was produced from a collaboration between the Australian Bureau of Agricultural and Resource Economics and Sciences (ABARES), the Commonwealth Scientific and Industrial Research Organisation (CSIRO), and data contributors, as part of the National Vertebrate Pests and Weeds Distribution Project. ABARES collated, cleaned, and standardised fallow deer distribution data from government agencies and other external sources. CSIRO developed the integrated species distribution methodology, and the two organisations collaborated in the application to fallow deer data. Guidance for this project was provided by a steering committee comprising representatives from environment and primary industries agencies from all states and territories. The project was supported with funding from the Australian Government Department of Agriculture, Fisheries and Forestry’s Established Pest Animals and Weeds Management Pipeline Program and Supporting Communities Manage Pest Animals and Weeds Program.
Current National Relative Abundance of Fallow Deer in Australia (2026)
- Current National Relative Abundance of Fallow Deer in Australia (2026) Metadata (PDF 1 MB)
- Current National Relative Abundance of Fallow Deer in Australia (2026) Metadata (Word 1 MB)
- Current National Relative Abundance of Fallow Deer in Australia (2026) Spatial Dataset (ZIP 7.3 MB)
- Current National Relative Abundance of Fallow Deer in Australia (2026) Map (PNG 1.4 MB)
If you have difficulty accessing these files, contact us for help.
Australian Bureau of Agricultural and Resource Economics and Sciences & Commonwealth Scientific and Industrial Research Organisation 2026, Current National Relative Abundance of Fallow Deer in Australia (2026), Australian Bureau of Agricultural and Resource Economics and Sciences, Canberra, April, https://doi.org/10.25814/ff2e-me64. CC BY 4.0.