
This data dashboard contains farm performance statistics for farms of different sizes, by industry and region. These data have been collected through ABARES surveys of broadacre and dairy farms. The statistics displayed on this data dashboard complement other ABARES farm performance statistics, and highlight the significant differences in financial performance that exist across farms of different sizes.
September 2025 update
Data in this dashboard was updated in September 2025 to include historical data from 2000-01 to 2022-23 and the latest data for 2023-24.
This PowerBI data dashboard may not meet accessibility requirements. For more information about the contents of this product contact ABARES.
Key points
Between 2021-22 and 2023-24:
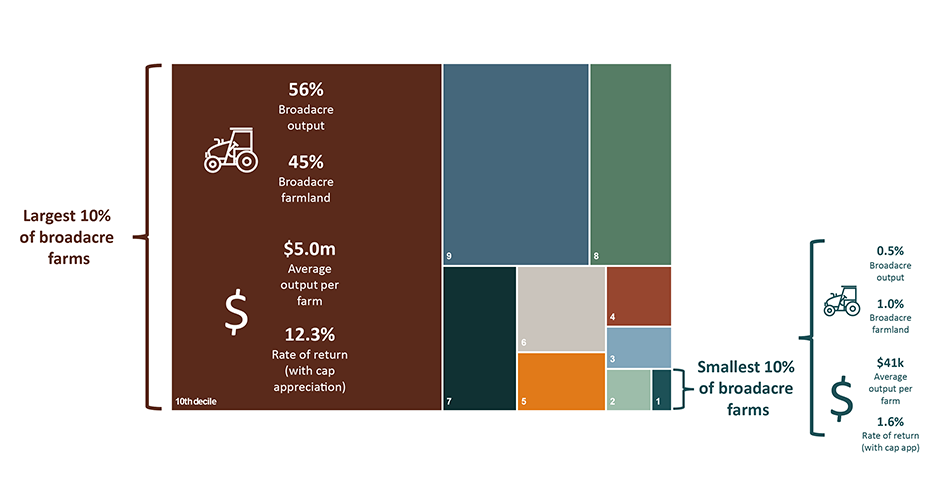
- The largest 10% of broadacre farms accounted for 56.3% of output, while the smallest 10% of farms accounted for 0.5% of broadacre output. Taking advantage of their scale of operations, broadacre farms recorded an average rate of return (inclusive of capital appreciation) of 12.3% compared with 1.6% for the smallest 10% of broadacre farms. When capital appreciation is excluded, one-half of broadacre farms would have earned a negative rate of return.
- The beef industry was the most concentrated of all broadacre industries, with the largest 10% of farms accounting for almost 60% of beef output. This concentration was greater still in northern Australia. As with other broadacre industries, the average rate of return (including capital appreciation) for the largest 10% of farms in the beef industry was significantly higher (10.1%) than the smallest 10% of farms (2.4%). When capital appreciation is excluded only 30% of beef farms see a positive rate of return.
- The cropping industry was the least concentrated of the broadacre industries, with the largest 10% of farms accounting for about 38% of output and an average rate of return (including capital appreciation) of 15.5%. The smallest 10% of farms accounted for 0.4% of output and an average rate of return of -0.7%. It was also the most robust broadacre industry, with only the smallest 20% of farms earning negative rates of return excluding capital appreciation.
- Of all the industries covered in this report, dairy farms were the least concentrated. The largest 10% of dairy farms accounted for almost 35% of all dairy output and recorded an average rate of return of 12.6%, whereas the smallest 10% of farms accounted for only 1.2% of output and recorded an average rate of return of 2.7%. Moreover, only the smallest 10% of dairy farms recorded negative rates of return when capital appreciation is excluded.
Overview
Size is an important determinant of farm business performance. Larger farms tend to be more profitable, invest more, and generate a higher rate of return on capital than smaller farms. This is because larger farms have more capacity to invest in productivity-enhancing investments that allow them to reduce their marginal costs through scale.
Many small farms exhibit negative rates of return and are only profitable because of the appreciation of their farmland values. Although capital appreciation also contributes to the rate of return of larger farms, it is of less importance to profitability than it is for smaller farms.
The importance of farm size is even more pronounced when considered in terms of the geographic size of the farm. Although the largest 10% of broadacre farms (when measured in terms of output) accounted for 56% of output, they only accounted for 45% of area in 2023-24. In contrast, the three smallest deciles accounted for 6.6% of all broadacre hectarage but only 2.8% of broadacre output in that year.
Variables
The statistics presented in the dynamic tables include the following variables:
- Share of total output produced
- Share of operating area operated, at 30 June of each year
- Total cash receipts
- Total cash costs
- Farm cash income
- Farm business profit
- Total capital excluding leased equipment, at 1 July of year
- Farm business equity ratio
- Rate of return on capital, without capital appreciation
- Rate of return on capital, with capital appreciation
- Area operated, at 30 June of each year
All dollar-denominated data are in 2022-23 constant prices.
Source data
This data dashboard provides statistics sourced from the following ABARES farm surveys:
- Australian Agricultural and Grazing Industries Survey (AAGIS)
- Australian Dairy Industry Survey (ADIS)
Farms in the broadacre and dairy industries are separated into size deciles based on farm total cash receipts—a measure of total revenue received by the business in a given financial year. Each category or ‘decile’ represents 10% of the farm population in each industry or region, ranked from smallest to largest based on revenue.
Farm performance varies significantly from year to year, reflecting volatility in seasonal conditions and commodity prices. Therefore, data are averaged over a three-year period to provide a more meaningful measure of farm performance than would be provided by a single year. For example, the data for 2023-24 are an average for 2021–22 to 2023–24.
Industry and region coverage
Statistics for the broadacre industry are further split into the sub-industries of wheat and other crops, beef, sheep, grains, and mixed cropping–livestock. The grains industry is separated into the Grains Research and Development Corporation Western, Northern and Southern regions and the beef industry into the Meat & Livestock Australia Northern and Southern regions. Data are presented in dynamic tables according to classification by industry and region.
Historical estimates for the vegetables industry
ABARES previously undertook a survey of Australian vegetable growing farms. The most recent vegetables industry survey was conducted for the 2018–19 financial year. Historical disaggregated farm performance statistics for the vegetables industry are available.
Further reading
Farm survey definitions and methods used to produce these statistics are available on the ABARES website. For further analysis and information about the design of these statistics see Boult and Jackson (2019).