
Authors: Mihir Gupta and Neal Hughes

Research by the Australian Bureau of Agricultural and Resource Economics and Sciences
Research report
July 2018
Summary
This study
Since the peak of the Millennium drought in 2008, the southern Murray-Darling Basin (sMDB) has seen large increases in nut and cotton plantings, decreases in water supply due to environmental water recovery and tighter limits on water trade between regions. These changes have raised concerns about how the water market might cope under drought conditions.
In this study, the ABARES water trade model is used to simulate what would happen to the water market under a repeat of the Millennium drought, with current water demand, environmental water recovery, trade limits and carryover rules. These scenarios indicate future water price levels and trade patterns across the sMDB under a repeat of historical climate conditions (for the period 2002–03 to 2016–17).
Key findings
Modelling results suggest that, under a repeat of historical conditions, allocation water prices in the sMDB would rise no higher than the peaks observed during the previous drought.
Although demand for water has increased for cotton in southern New South Wales and almonds in the lower Victorian Murray, this has been offset by general decreases in demand for water from other sectors, including grazing (dairy), rice and other broadacre crops. Modelling results show a slight net decrease in total demand for water in the sMDB at most price levels (comparing 2002–03 and 2016–17). At a regional level, water demand has increased significantly in the lower Victorian Murray due to almond plantings, but has decreased in most other regions especially the Murrumbidgee.
Improvements in carryover rules also help to limit price rises under a repeat of the drought. Under the current carryover rules, much larger volumes of water are being stored between years. These reserves leave the region better placed to withstand future droughts. Carryover helps to smooth fluctuations in prices, resulting in slightly higher prices in wet to average years, in turn for significantly lower prices in dry years.
However, the results also suggest that key limits on inter-regional water trade (such as the Murrumbidgee export limit and the Barmah choke) are likely to affect the market more often in the future, due mostly to the expansion in water demand in the lower Victorian Murray. As a result, modelled allocation prices are frequently higher in the Murray below Barmah trading zones compared with other regions in the sMDB.
These results are consistent with recent experience in the market with binding Murrumbidgee export limits in 2015–16 and 2016–17 and a binding Goulburn export limit in 2017–18. Murrumbidgee trade flows reversed in 2017–18, but modelling results suggest this may be a temporary situation reflecting water supply conditions (low allocations in the Murrumbidgee).
Finally, although water price peaks are simulated to be no higher under a repeat of extreme drought conditions, they are higher on average due in part to environmental water recovery. The modelled scenarios also suggest a change in the distribution of prices, with fewer years of low prices.
Water market reform
This study demonstrates the importance of water trading and carryover to the irrigation sector. Both help farmers adapt to seasonal conditions while also supporting long-term adjustment to changes in technology and commodity prices. Water market reforms in the sMDB to date have been successful, but scope remains for further reform—particularly for water trading and carryover rules.
In practice, some limits on inter-regional water trading will be necessary to ensure markets respect hydrological constraints. However, managing inter-regional water trade more efficiently may be possible, allowing more trade to occur while adhering to physical limits. Alternative arrangements should be considered, given the potential for trade limits to become more of an issue in future.
Finally, previous research has identified a range of options for fine-tuning carryover rules in the MDB. In particular, more frequent ‘continuous’ water allocation accounting systems could be adopted in the sMDB similar to those implemented in northern New South Wales and southern Queensland. These carryover reforms could also help regulators to reduce inter-regional trade limits (Hughes et al. 2013).
[expand all]
Introduction
The southern Murray–Darling Basin (sMDB) water market has been subject to a number of structural changes over the past decade.
Following the introduction of the Water Act 2007, nearly 2,000 GL of water entitlement in the sMDB has been acquired by the Commonwealth for environmental purposes, through a combination of buyback and infrastructure upgrades (CEWO 2018). This has reduced the supply of water allocations available for irrigation. Commonwealth investments in infrastructure have also affected farm productivity and water use efficiency (Department of Agriculture and Water Resources 2017).
Over the same period, changes in technology and commodity prices have been transforming the irrigation sector. New commodities have emerged, including cotton in southern New South Wales and almonds in northern Victoria, and some traditional commodities, including dairying, rice and wine grapes, have contracted. In recent years, the growth in almonds and cotton has been dramatic. Cotton has now overtaken rice as the major irrigated broadacre crop in the Basin (Gupta & Hughes 2018b). In the Victorian Sunraysia region, the expansion in almonds has increased horticultural water demand by more than 250 per cent, from around 100 GL in 2006–07 to around 340 GL in 2015–16 (Figure 6).
Water market rules have also changed significantly over the past decade, including limits on inter-region water trade and inter-year carryover. Since the peak of the Millennium drought (2006–07 to 2008–09) a number of new trade limits have been introduced and others have been applied more strictly. In recent years, these limits—particularly the Murrumbidgee inter-valley transfer (IVT)—have frequently constrained inter-regional trade, leading to persistent differences in water prices between regions (ABARES 2018). Over the same period, carryover rule changes—particularly the introduction of carryover in Victoria—have resulted in large increases in the volume of water held in storage between years (Hughes, Gupta & Rathakumar 2016).
These changes all have implications for water market prices in the region and in-turn on market participants, including irrigators and environmental agencies. In recent times, concerns have been raised about how the water market and the irrigation sector might cope under a repeat of extreme drought, such as that observed between 2006–07 and 2008–09. Firstly, there is a fear that drought would lead to extremely high water prices given the reductions in water supply and expansions in demand since the last drought. In addition, there are concerns about physical delivery of water to farmers in the lower Victorian Murray region, given recent increases in almond plantings and tighter limits on importing water into the region from other catchments (ABARES 2018).
In this study, the ABARES water trade model is used to simulate what would happen to the water market under a repeat of the Millennium drought, with current water demand, environmental water recovery, trade limits and carryover rules. In doing so, this report also aims to isolate the effect of key structural changes in the region, including changes in water demand, trading and carryover rules and environmental water recovery.
These scenarios indicate future water price levels across the sMDB under a repeat of historical climate conditions, and associated future inter-regional trade flows. The scenario results also indicate how scarce water is likely to be allocated between different irrigation activities in the future given the current industry structure. Finally, the results indicate the extent to which different inter-regional water trade limits may constrain the sMDB market in future years.
The water trade model
Overview
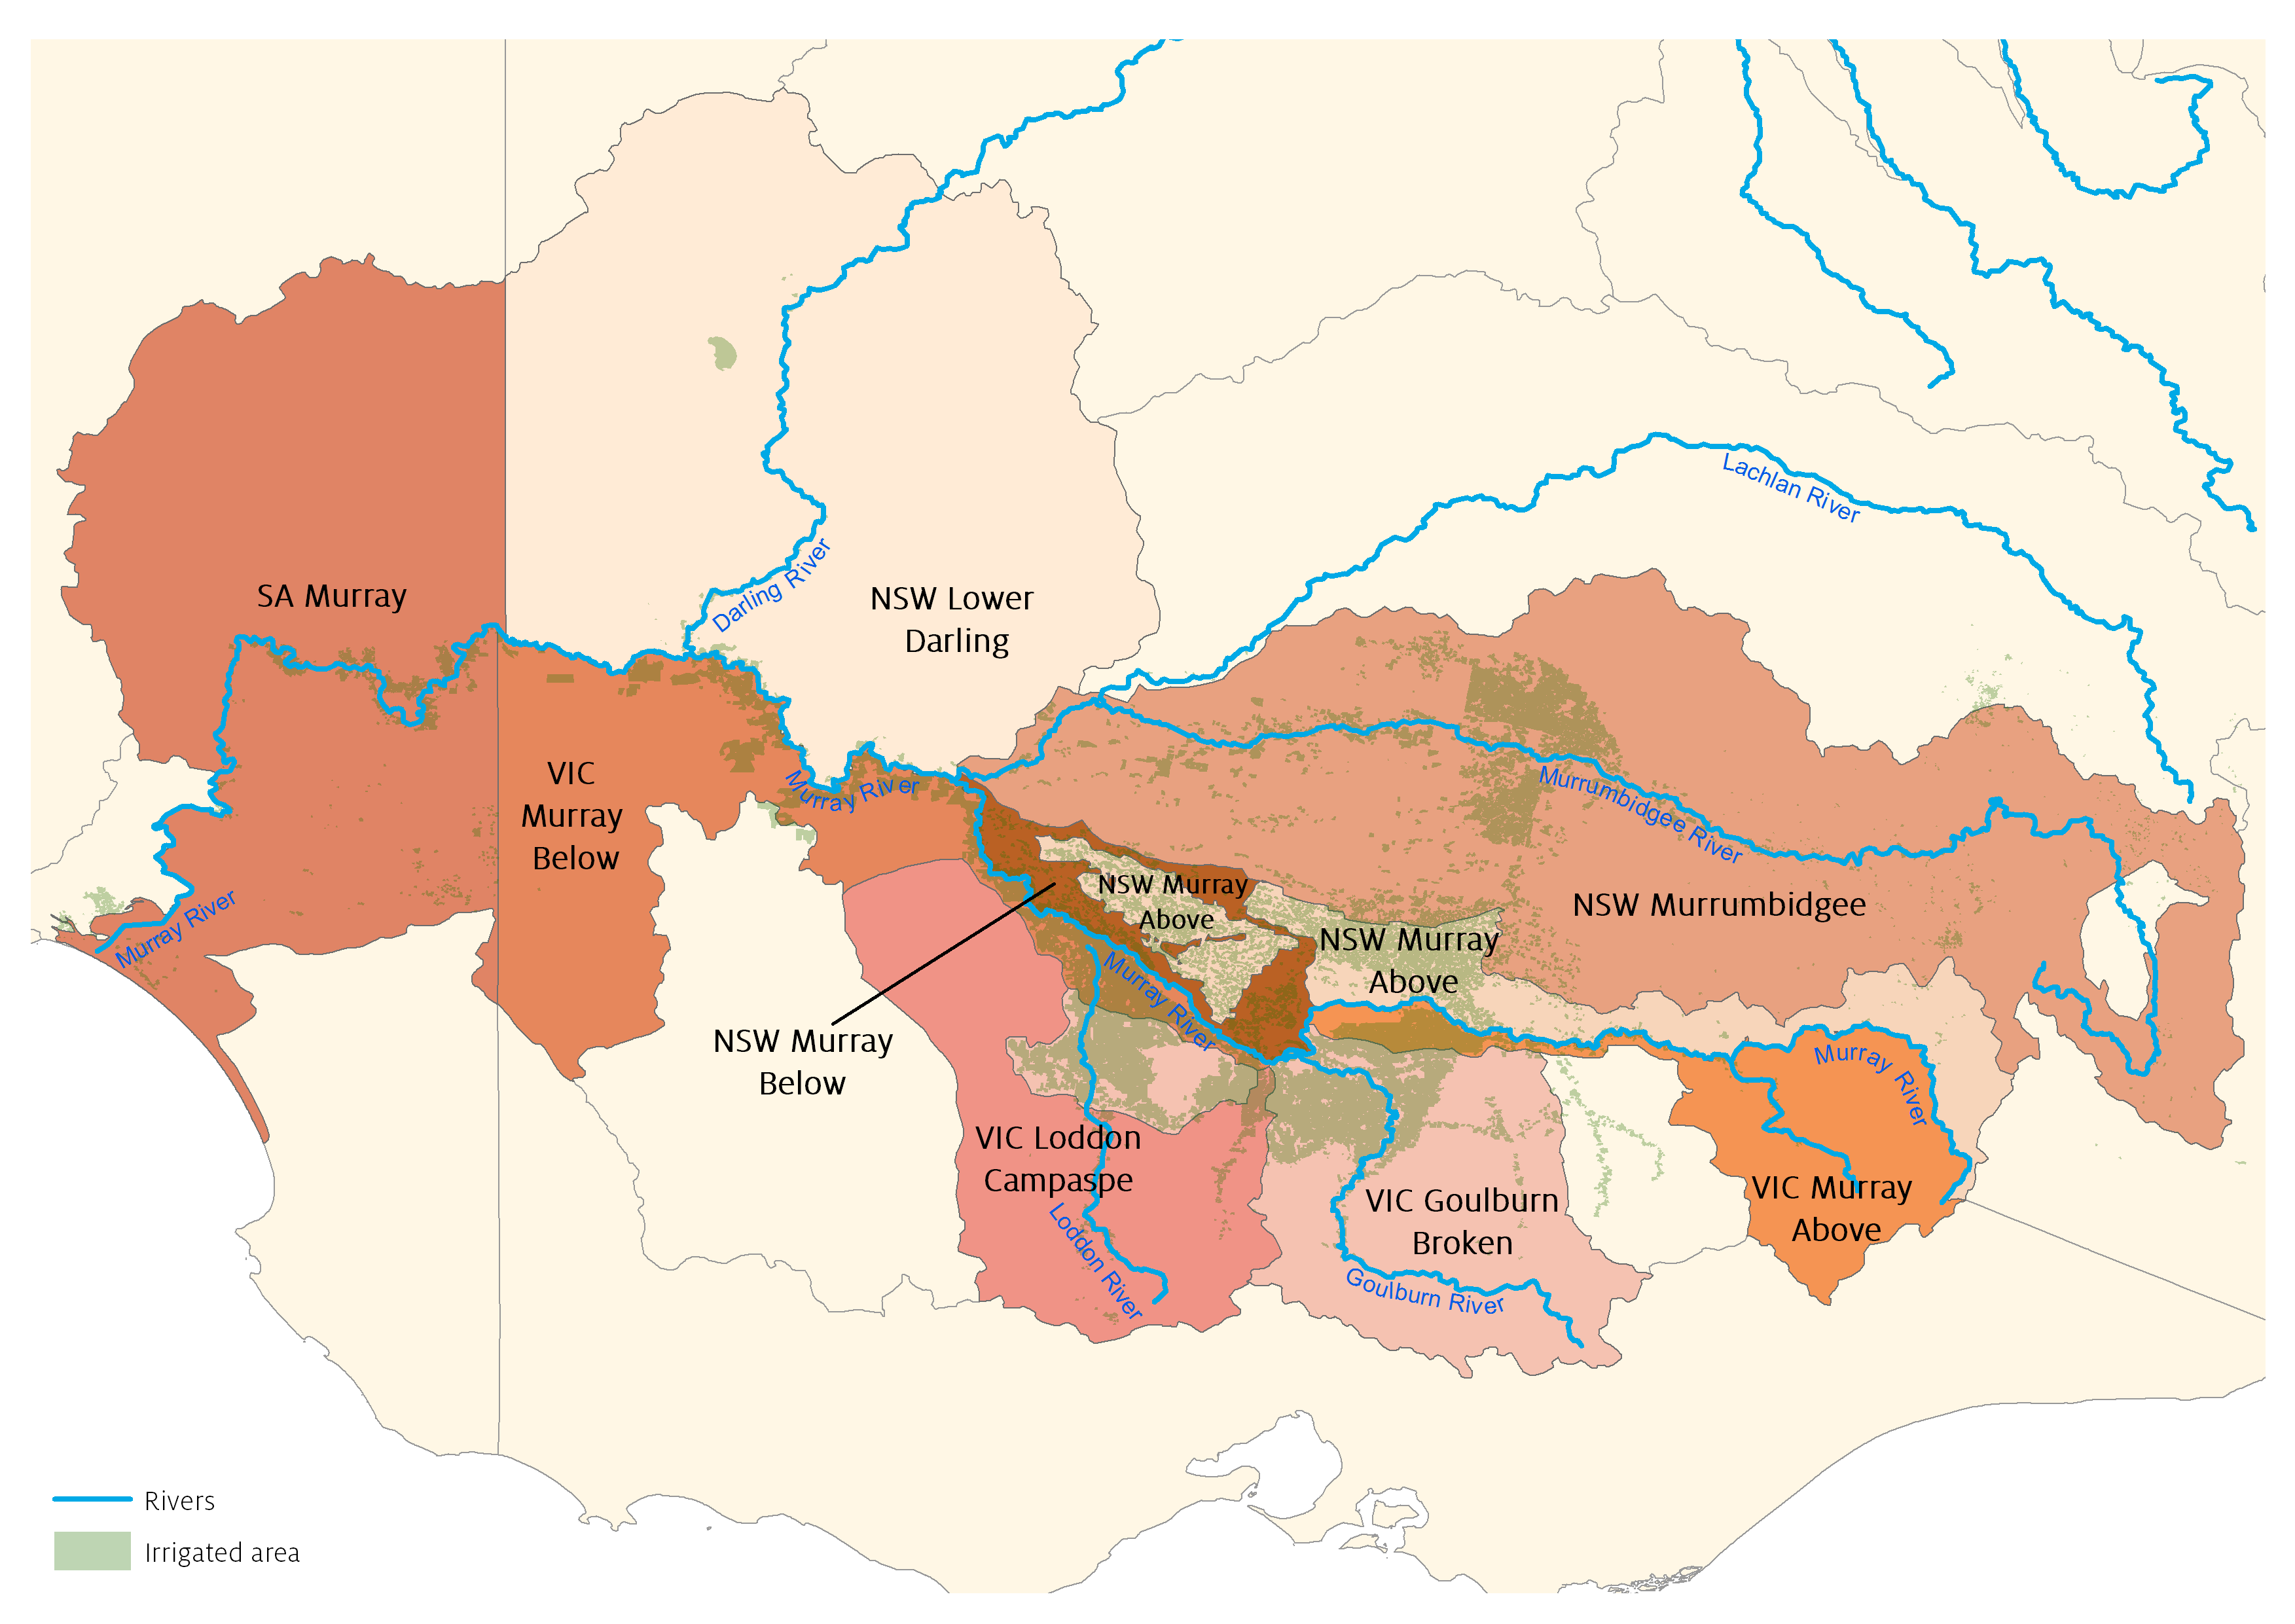
The ABARES water trade model (Gupta, Hughes & Wakerman Powell 2018) is an econometric partial equilibrium model of water trade and irrigation activity in the southern Murray–Darling Basin (sMDB). The model is constructed from a historical dataset detailing water availability (that is, entitlements, allocations and carryover), market outcomes (prices and trade flows), irrigation activity (area planted and water use), climate (rainfall) and commodity prices. The model divides the sMDB into 9 regions (Map 1) and 10 irrigation activities (Table 1) and operates on an annual time step for the 15-year period from 2002–03 to 2016–17.
The model simulates the supply of water in each region and the demand for water in each region and irrigation activity. Each region has an initial allocation of water (based on entitlement volumes and annual allocation percentages), and this water can be traded between activities and across regions subject to defined trading rules. Equilibrium prices are those that maximise the benefits of water use (and equalise the marginal value of water) subject to constraints on trading (Figure 1).
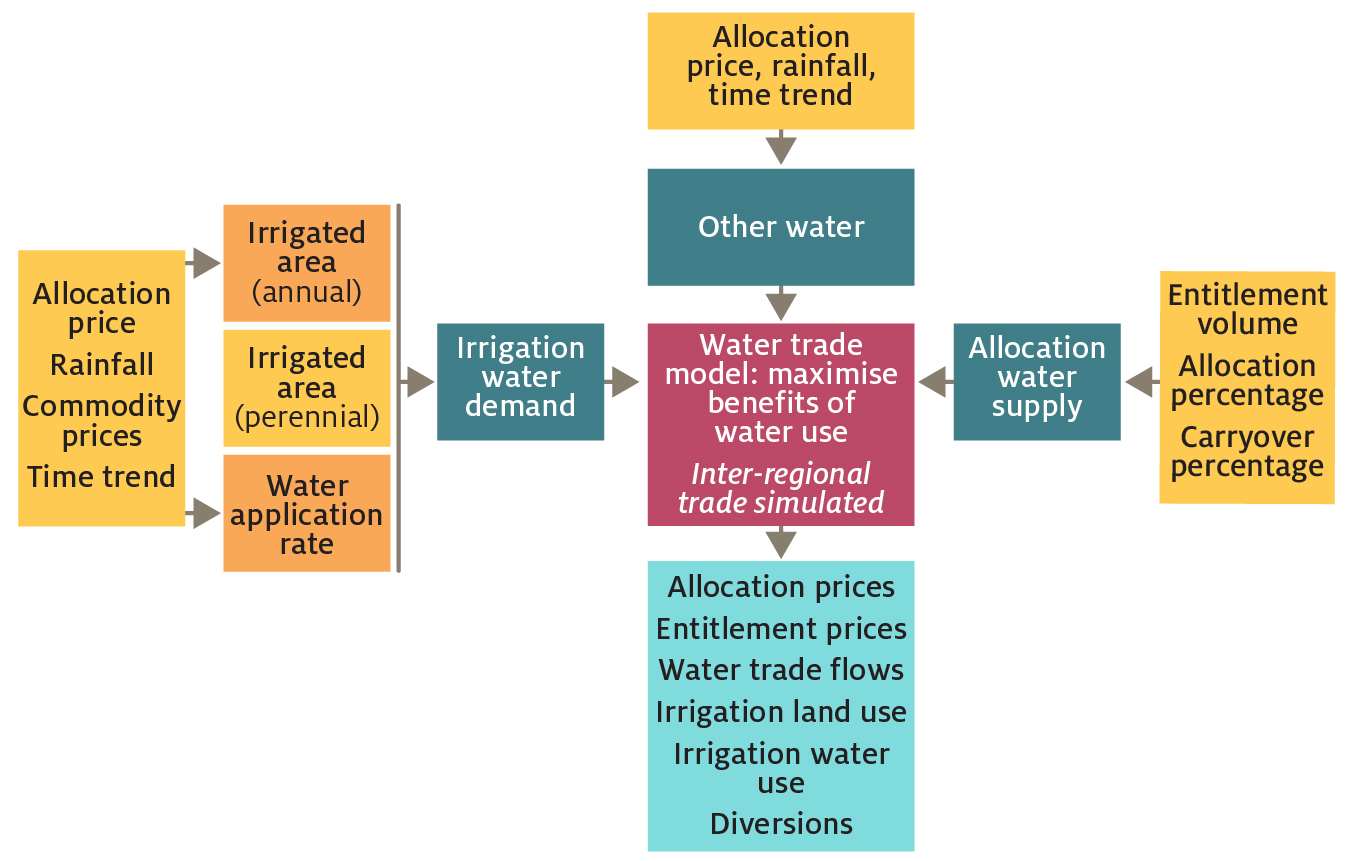
The model has a short-run focus, simulating the demand for water (by region and irrigation activity) in each year given prevailing water availability, rainfall and commodity prices. On the demand side, the model simulates the area planted of each irrigated crop in each region (excluding perennial crops—fruit and nuts and grapes). For perennial crops, land areas are assumed to be exogenous (based on historical data) given changes in these areas are based on long-term investment decisions and do not respond to short-run changes in water prices (unlike annual crops like rice and cotton). The model then simulates the water application rate for each crop in each region (water applied per unit of land).
The third variable in Figure 1, ‘other water’ is defined to take into account differences between irrigation water use (based on farm reported values) and allocation water supply (based on regulated surface water entitlements), which can arise for a variety of reasons—unaccounted sources of water supply (unregulated/groundwater licences), non-irrigation water use (that is, urban/domestic), forfeited water, or general measurement error (Gupta, Hughes & Wakerman Powell 2018).
Key model outputs (Figure 1) include allocation prices and trade flows (by year and region), water entitlement prices (by region), irrigation land area and water use (by year, region and activity). For more detail see Gupta, Hughes and Wakerman Powell (2018).
Water trade limits
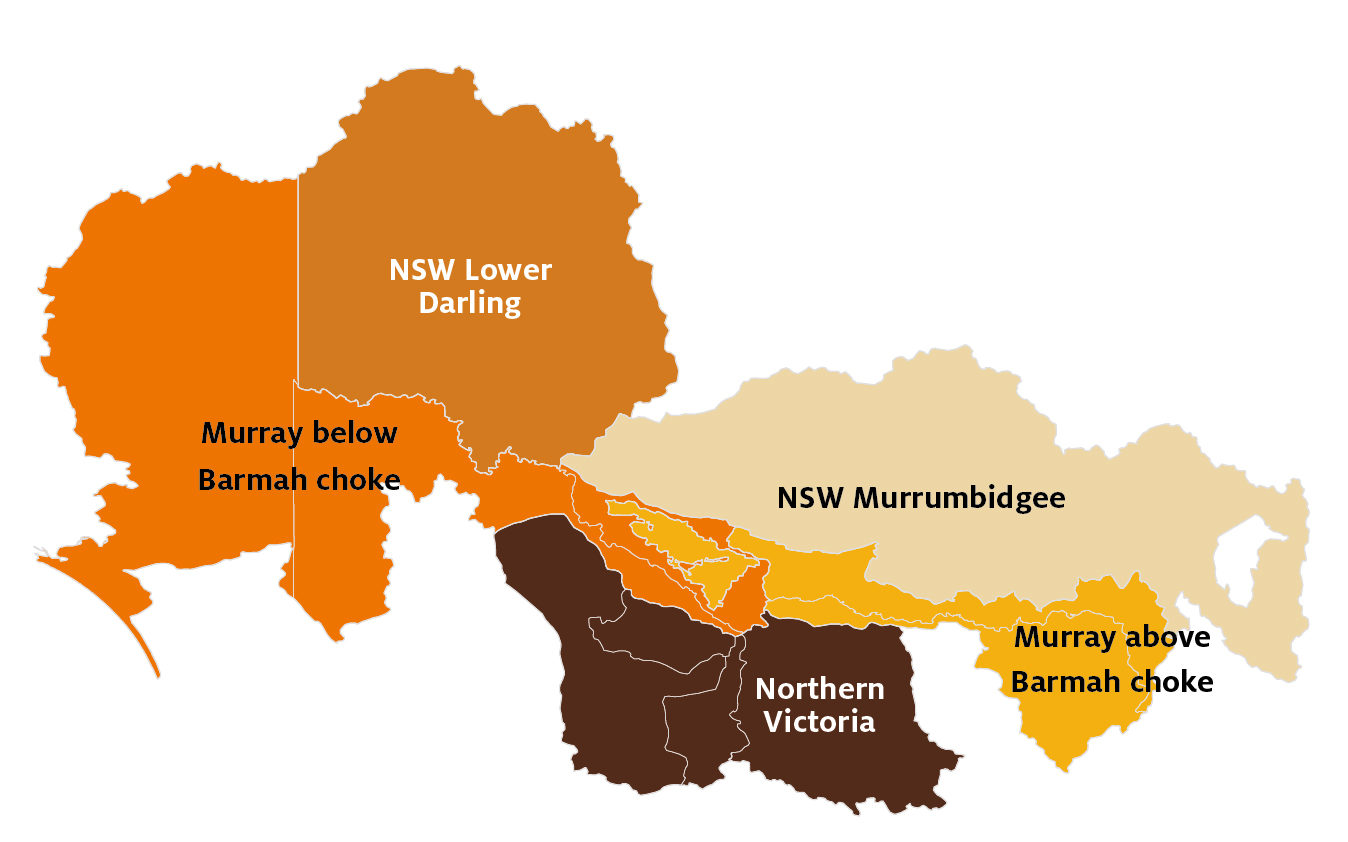
Five trading zones are defined in the model to represent key historical restrictions on inter-regional water trade (Map 2). These trading zones are aggregations of water catchment regions, where each region in a trading zone can freely trade with all other regions in the same trading zone. However, a restriction may apply on water being traded in or out of each trading zone. Zones that have a binding trade restriction will have a different price for water allocations to zones without binding trade restrictions. The trade limits in the model reflect key trade constraints in the sMDB including the:
- Murrumbidgee IVT (import/export limit)
- Goulburn IVT (import/export limit)
- Barmah choke (limit on export from above to below choke regions)
- Lower Darling drought trade limits.
The upper and lower trade limits for each zone reflect historical trading rules in the sMDB in each year (Appendix A).
Baseline scenario
For the baseline scenario, model inputs such as water availability (water allocations, entitlements and carryover), climate (rainfall) and commodity prices are all based on historical conditions. This baseline scenario includes the effects on water availability of Commonwealth water entitlement recovery.
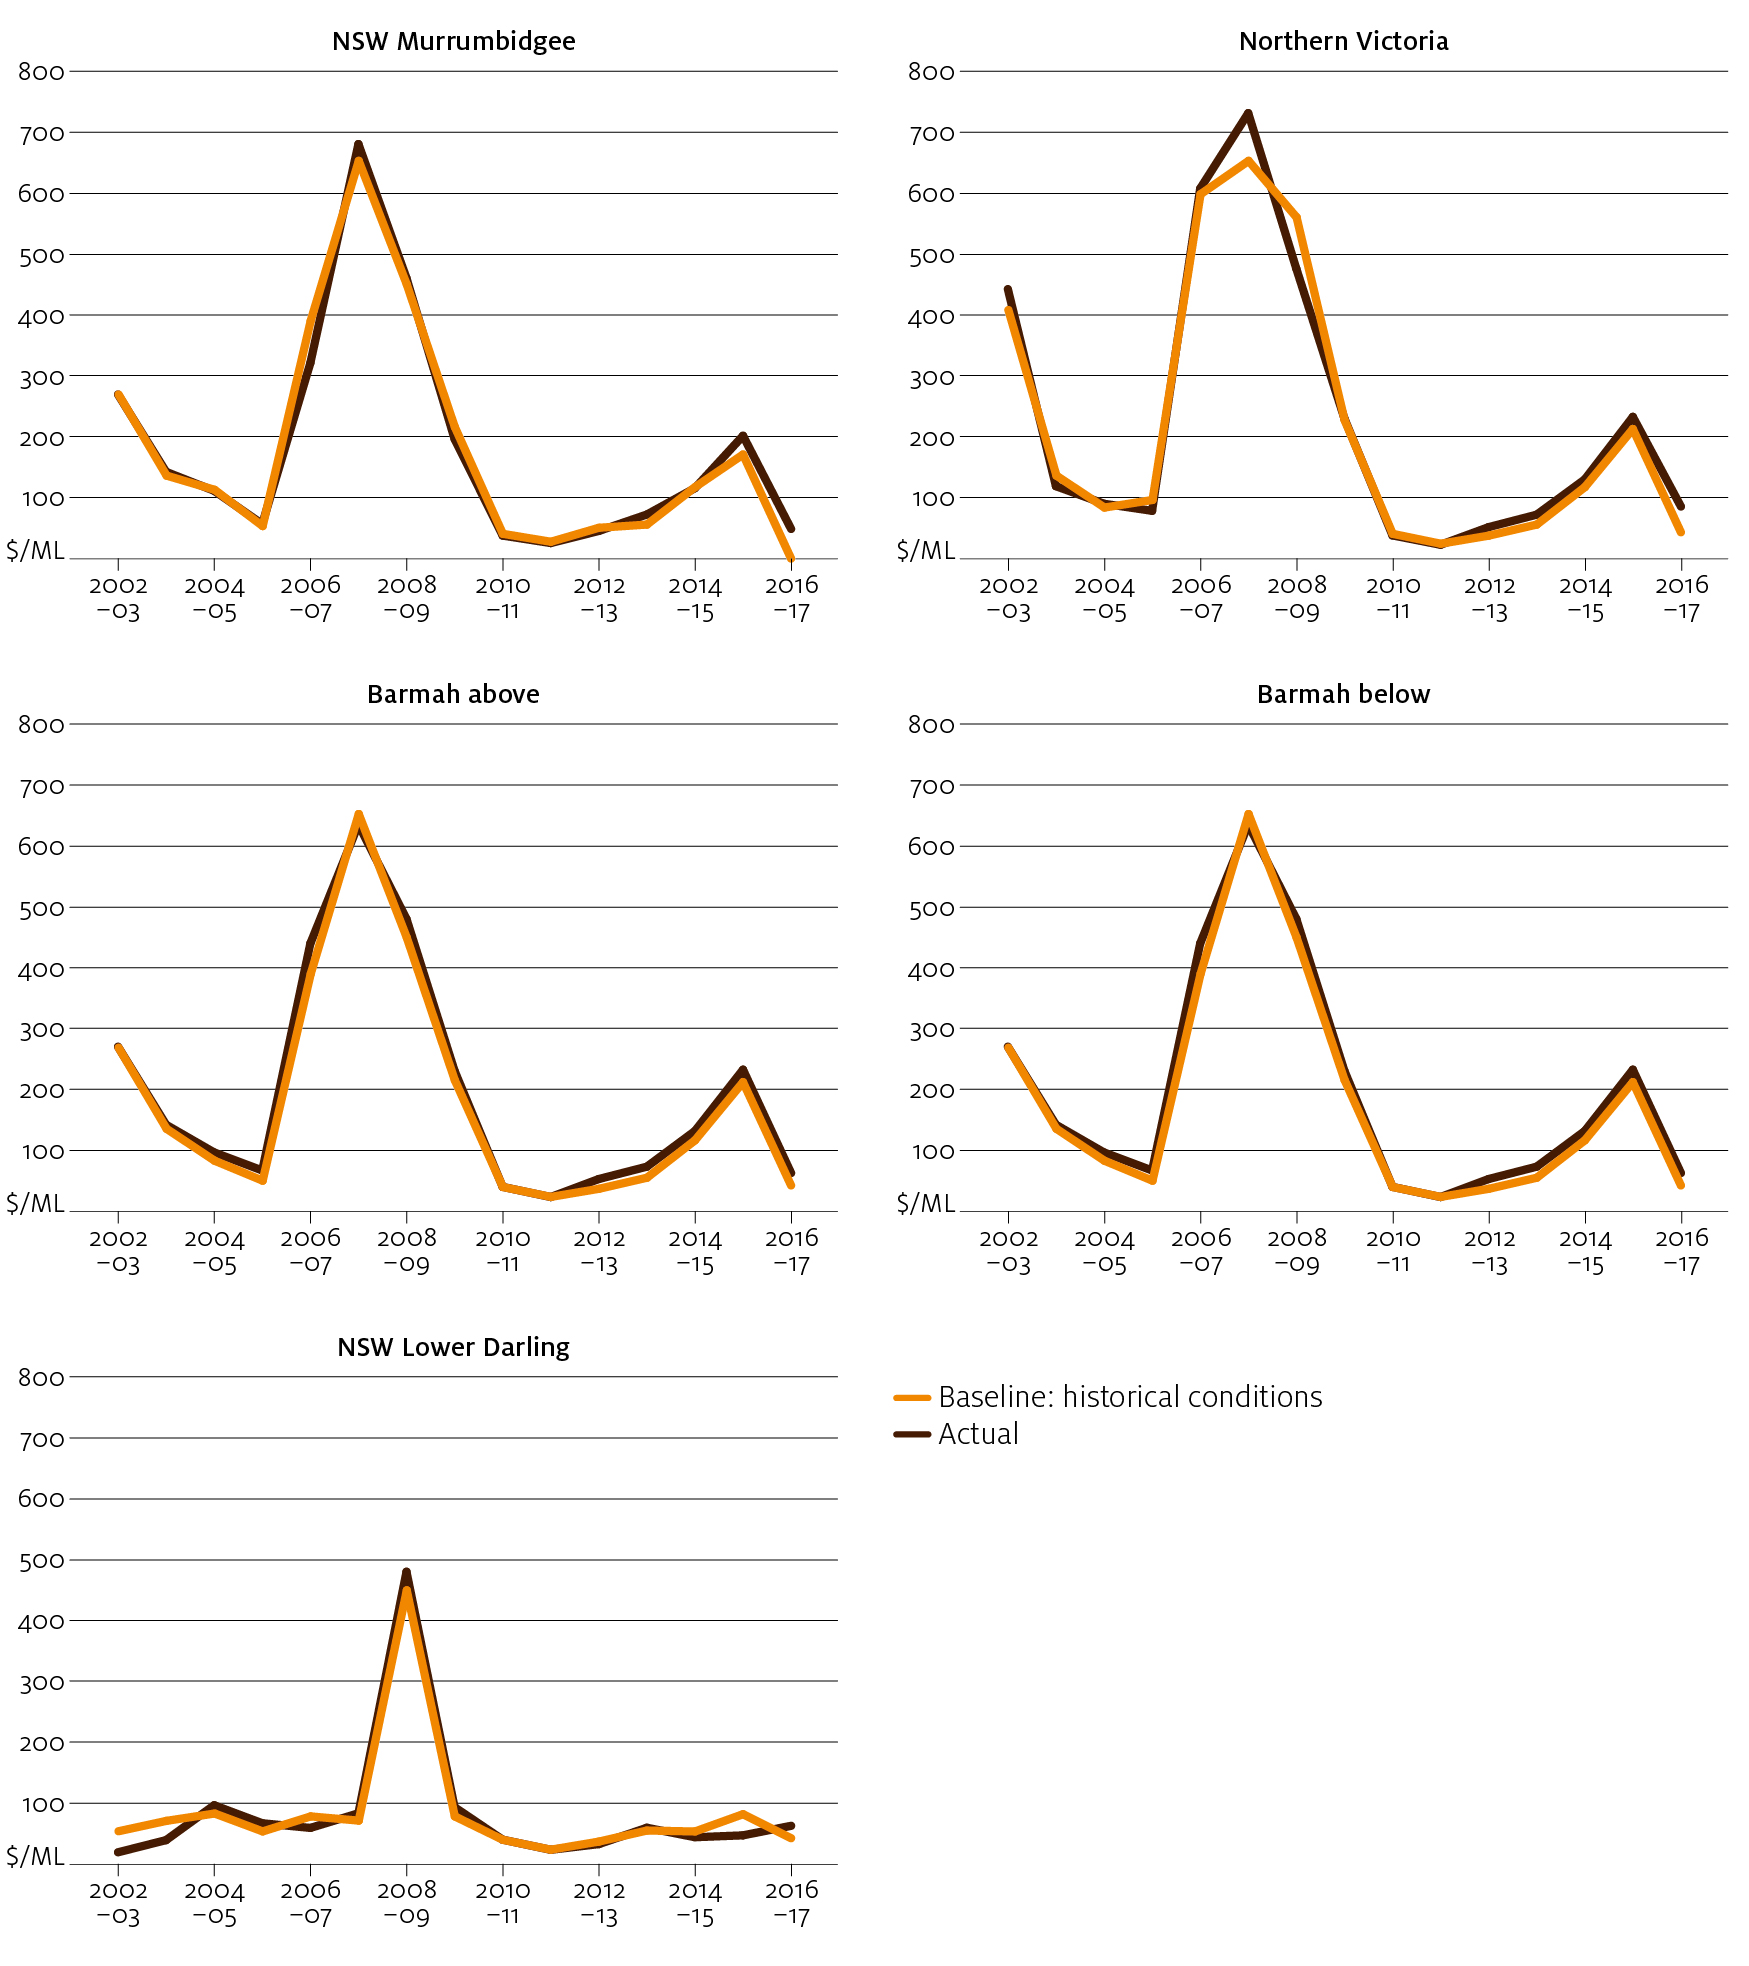
The baseline scenario is designed to act as a benchmark against which results for other scenarios can be compared. Actual and modelled baseline water allocation prices are in Figure 2. The model accurately recreates historical trends in water prices and trade flows over time and between regions both in and out-of-sample (for more detail see Gupta, Hughes & Wakerman Powell 2018). A full set of results can be explored using the Tableau dashboard accompanying this paper.
Changes in water demand
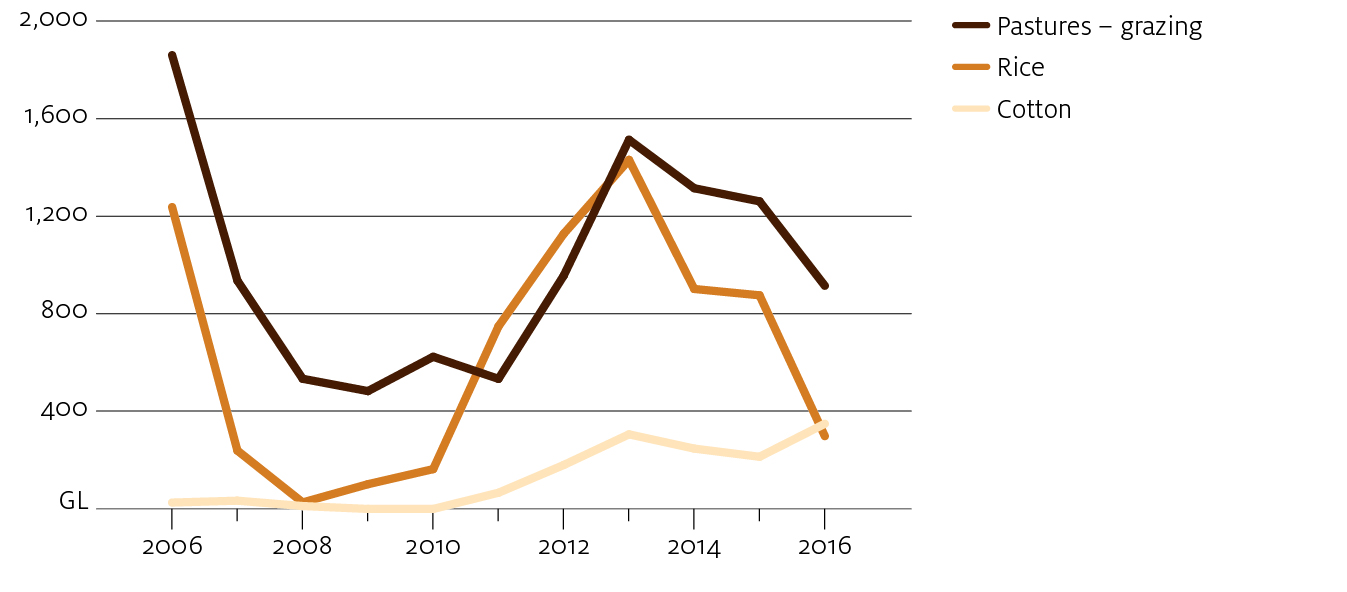
Measuring long-term changes in irrigation water demand is difficult, given annual fluctuations in seasonal conditions and water market prices. The area planted and water applied to annual crops and pastures can vary dramatically between wet and dry years, making it hard to establish long-term trends (Figure 3).
For this study, ABARES applied the water trade model to estimate changes in water demand between 2002–03 and 2016–17. The model was applied to each region and activity, holding rainfall fixed at average values and water allocation prices fixed at $100 per ML. The results primarily reflect the net changes over time in capital investment (including disinvestment) and commodity price effects. For example, the changes in demand reflect the effect of investments in on-farm or off-farm infrastructure or natural capital (such as trees and livestock) to support production of new activities (such as almonds and cotton). They also reflect any disinvestment in irrigation infrastructure (such as network rationalisation) that shifts farms into dryland production.
While these model results are for 2016–17, they are based on ABS agricultural data only up to 2015–16. As a result, they may exclude some more recent changes in water demand (for more detail on the assumptions see Appendix A). However, the model is still able to accurately replicate water market outcomes during 2017–18 (as shown in Appendix B). This suggests that, despite the data limitations, the model provides a reasonable approximation of present day water demand.
Changes in water demand by region and activity are summarised in this chapter. Preliminary results were presented in ABARES Agricultural commodities: March quarter 2018 publication, along with further discussion on cotton crops in the Murrumbidgee region and nut plantings in the Victorian Murray. The Tableau dashboard accompanying this paper contains more detailed results for each combination of region and irrigation activity.
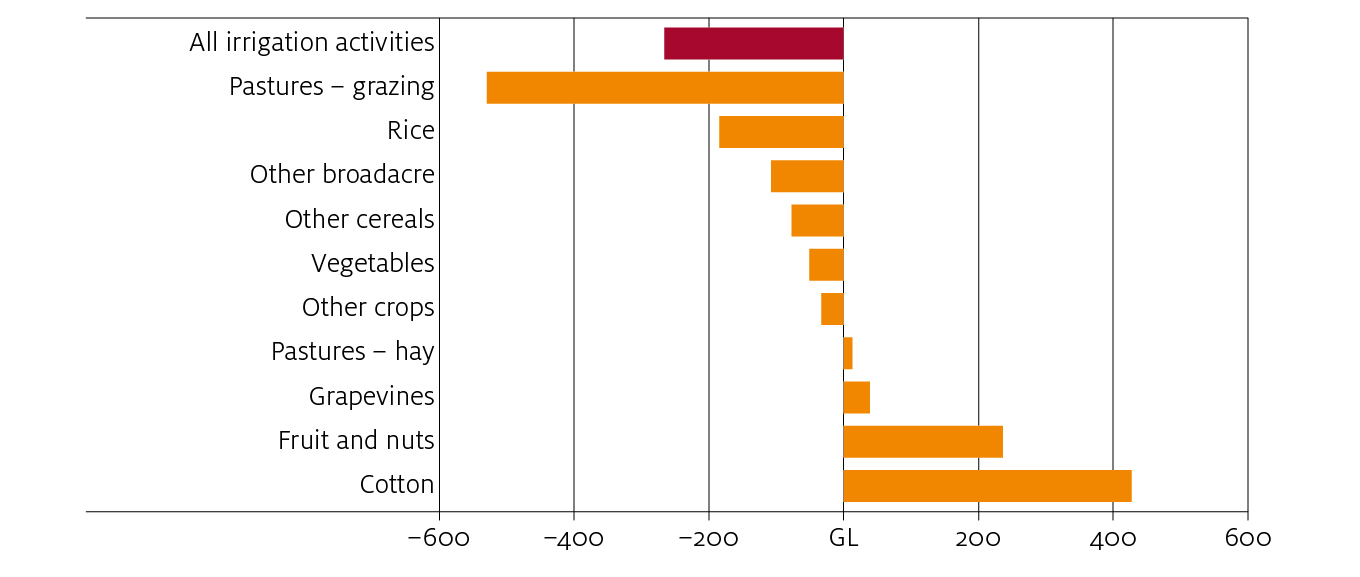
Figure 4 shows results by irrigation activity. At a water price of $100 per ML, total water used for irrigation in the sMDB is slightly lower in 2016–17 compared with 2002–03. Although water used to grow cotton and nuts has increased significantly, most other activities—particularly grazing pastures (dairy) and rice—have experienced reduced demand for water. Within the model this adjustment is primarily driven by changes in the area irrigated of each commodity, with minimal changes in water application rates.
The results also show clear regional trends (Figure 5), including a significant decrease in water demand in the Murrumbidgee and an increase in demand in the Victorian Murray (below Barmah). The increase in demand in the Victorian Murray region below the Barmah choke is primarily due to almond plantings (Gupta & Hughes 2018b). Data limitations prevent the model from separating fruit and nut water use, but preliminary data obtained by ABARES from the ABS suggests that almost all of the increase in fruit and nut water use within the sMDB can be attributed to farms growing nuts in the Victorian Murray region below the Barmah choke (Figure 6). These estimates exclude any new nut plantings in 2017 or 2018. Further, the water requirements of recently planted nut areas may increase in the future as trees mature.
In the Murrumbidgee, demand for water is estimated to have decreased overall despite a significant increase in water used for cotton production. This is a result of a larger decrease in water demand from irrigated pastures and rice crops (see Gupta & Hughes 2018a for more detail). Relatively accurate information is available on cotton plantings in the Murrumbidgee in 2017 and 2018, but this has not been incorporated in the model due to data constraints for other irrigation activities. Assessing the full effects of the shift towards cotton is also difficult given the limited time series data available (with virtually no cotton production before 2010–11). Future research could update the model dataset and further analyse the effect of cotton activity on water demand in this region.
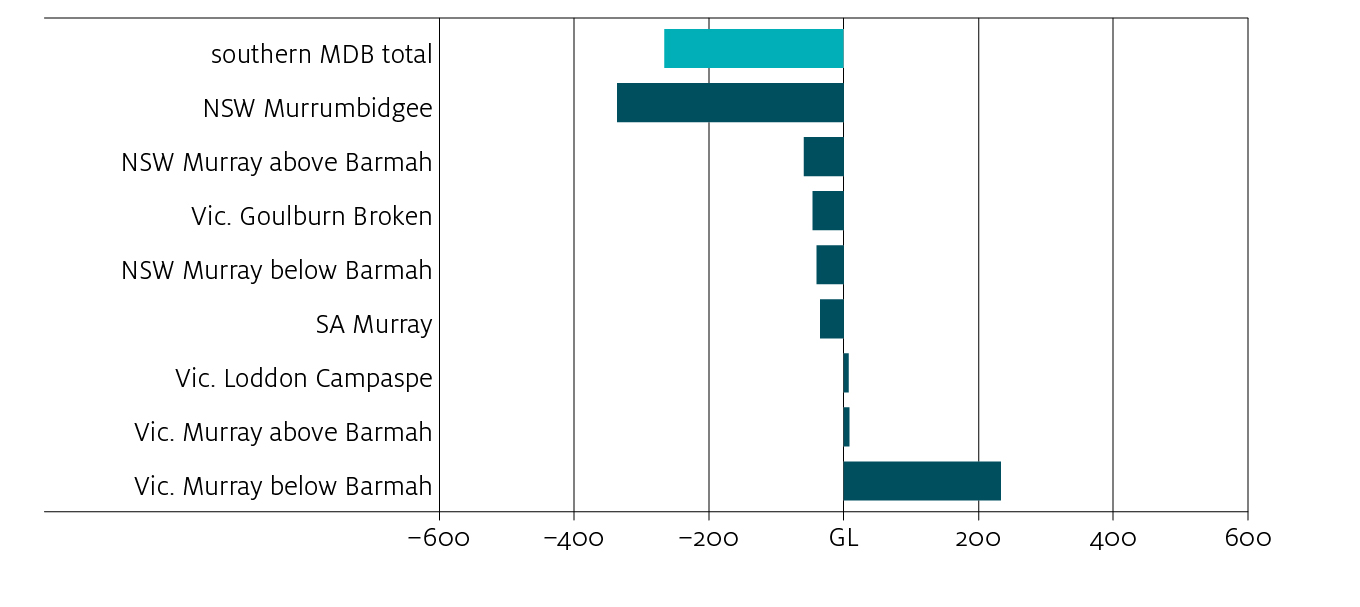
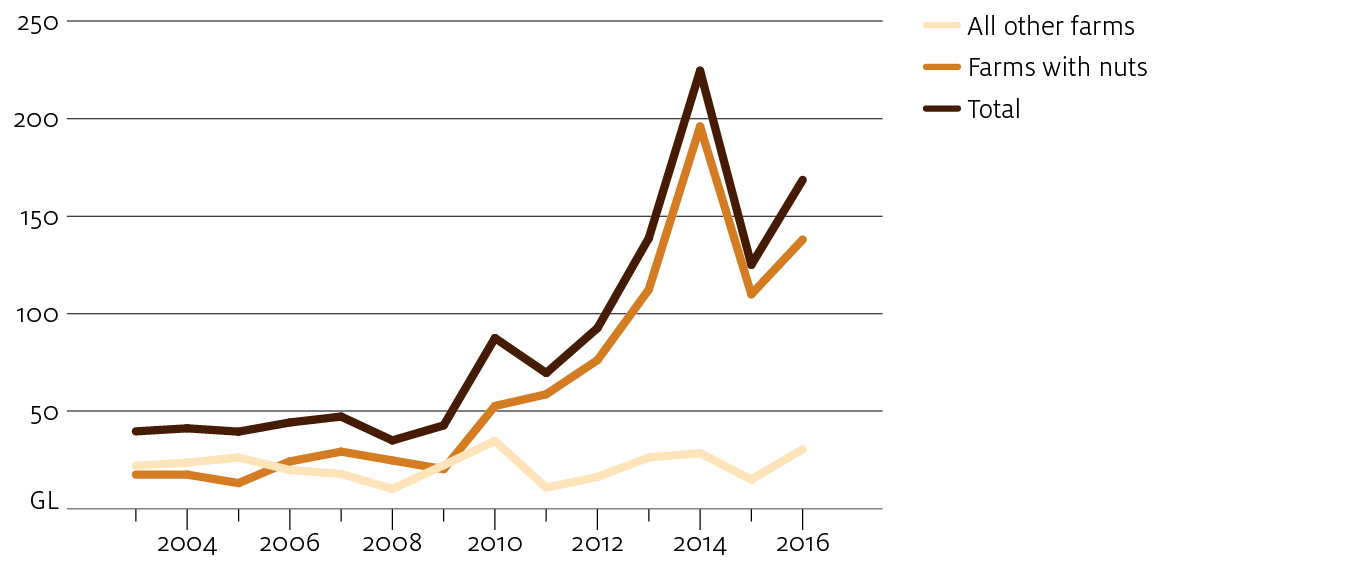
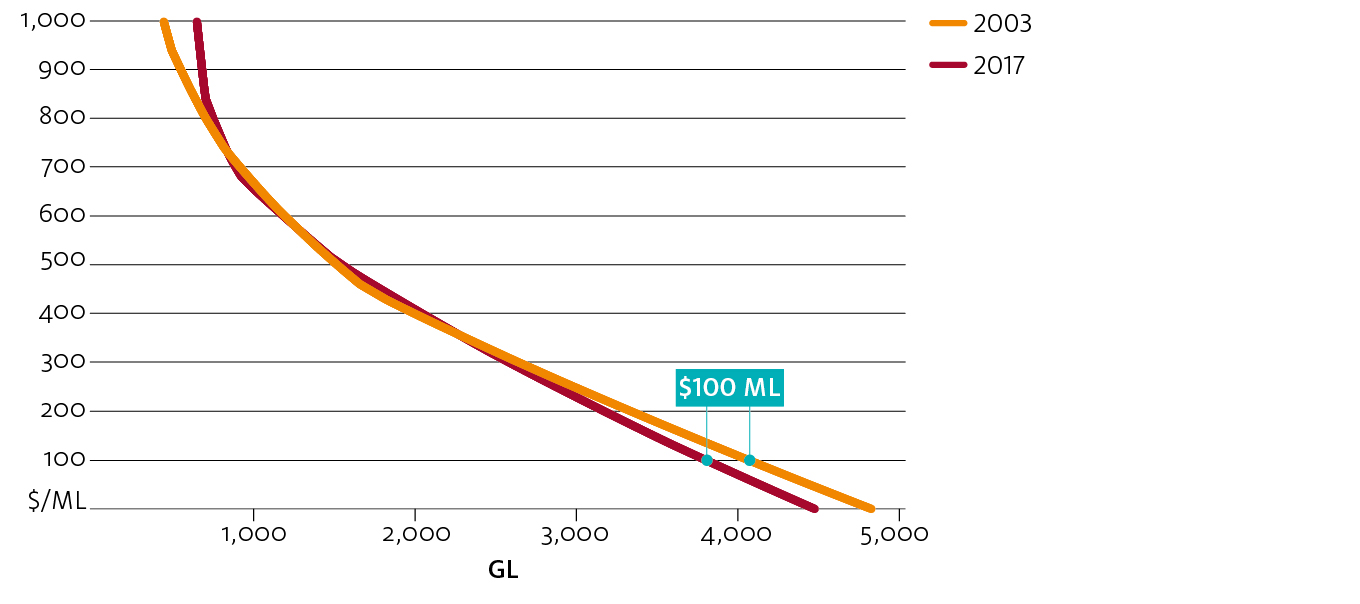
Figure 7 presents results for total sMDB irrigation water demand at a range of water price levels (from $0 to $1,000 per ML). The results show how the aggregate demand curve for irrigation water has pivoted over time, due to a shift away from more flexible activities such as pastures and rice to perennial activities such as nuts. As a result, water demand is now less at lower market prices (less than $300 per ML) but greater at higher prices (more than $800 per ML), due to the greater willingness to pay for water from new nut farms.
Scenario results
The model scenarios considered in this chapter each impose an aspect of current market conditions (as in the 2016–17 water year) over the entire modelling period of 15 years. In these scenarios, the past 15 years are used as a template for future seasonal conditions. The scenarios simulate what would happen to the water market under a repeat of historical weather conditions (rainfall and allocation percentages), with current market conditions—for example, water recovery to date, irrigation water demand, trade limits and carryover rules. The scenarios introduce the current market conditions progressively (Table 2), which are applied for all years:
- Scenario 1: Current trade limits—2016–17 limits on inter-regional water trade (Appendix A).
- Scenario 2: Current water demand—Irrigation water demand in 2016–17 as estimated by the model (summarised in Chapter 3).
- Scenario 3: Current water recovery—Water entitlements recovered for the environment as in 2016–17 (Appendix A).
- Scenario 4: Current carryover behaviour—Carryover behaviour based on the post 2007–08 period, following the introduction of carryover rights in Victoria (Appendix A).
- Scenario 5: Future increase in nut demand—A significant increase in horticultural water use in the Victorian Murray below Barmah region to reflect potential future growth in almond water demand (Appendix A).
Scenario results for the water allocation price (Table 3), net trade (Table 4) and irrigation water use (Table 5) are summarised as average values over the modelling period. The results for each scenario are discussed in detail in this chapter. A full set of results for all modelling outputs can be explored using the Tableau dashboard accompanying this paper.
Scenario 1: current trade limits
In Scenario 1, current trade limits (2016–17 water year) (see Appendix A) are imposed over the entire modelling period while holding all else fixed at baseline values (that is, historical water demand, environmental water recovery and carryover behaviour). The scenario illustrates the effect of applying key trade limits including the Murrumbidgee IVT, the Goulburn IVT and the Barmah choke during the Millennium drought—historically these limits either did not exist or were suspended during the drought.
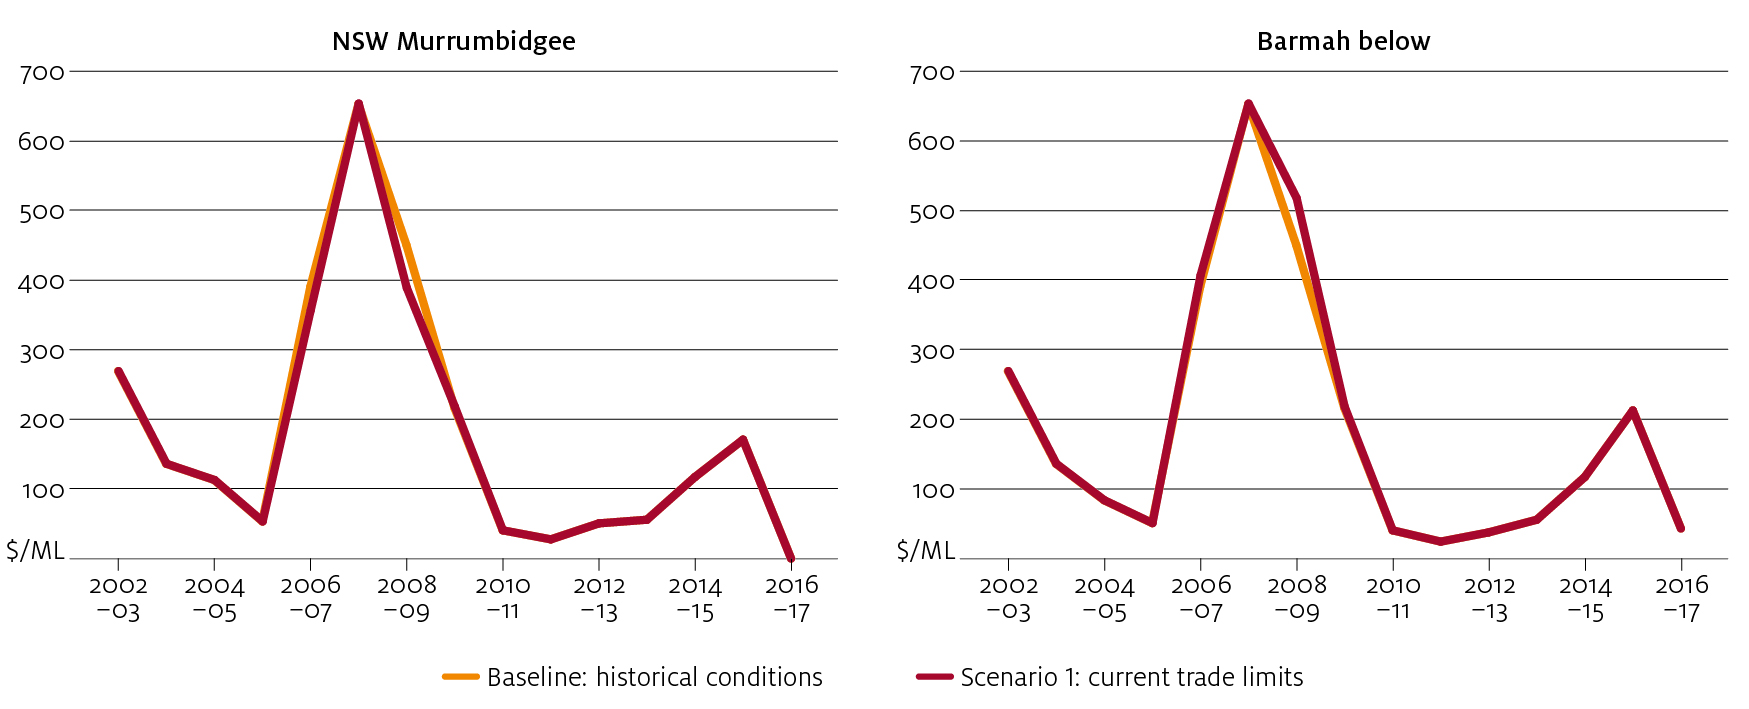
If current trade limits were imposed over the modelling period, the water allocation price would have been slightly lower in the Murrumbidgee region and slightly higher in the Murray region (below the Barmah choke) during the drought period from 2006–07 to 2009–10 (Figure 8). This result is primarily due to the Murrumbidgee IVT constraining exports of water allocations during drought years. The largest effect in Scenario 1 is observed in 2008–09, when Murrumbidgee prices are modelled to be $61 per ML lower (at $389 per ML) and Murray (below Barmah) prices are $68 per ML higher (at $518 per ML).
Scenario 2: current water demand
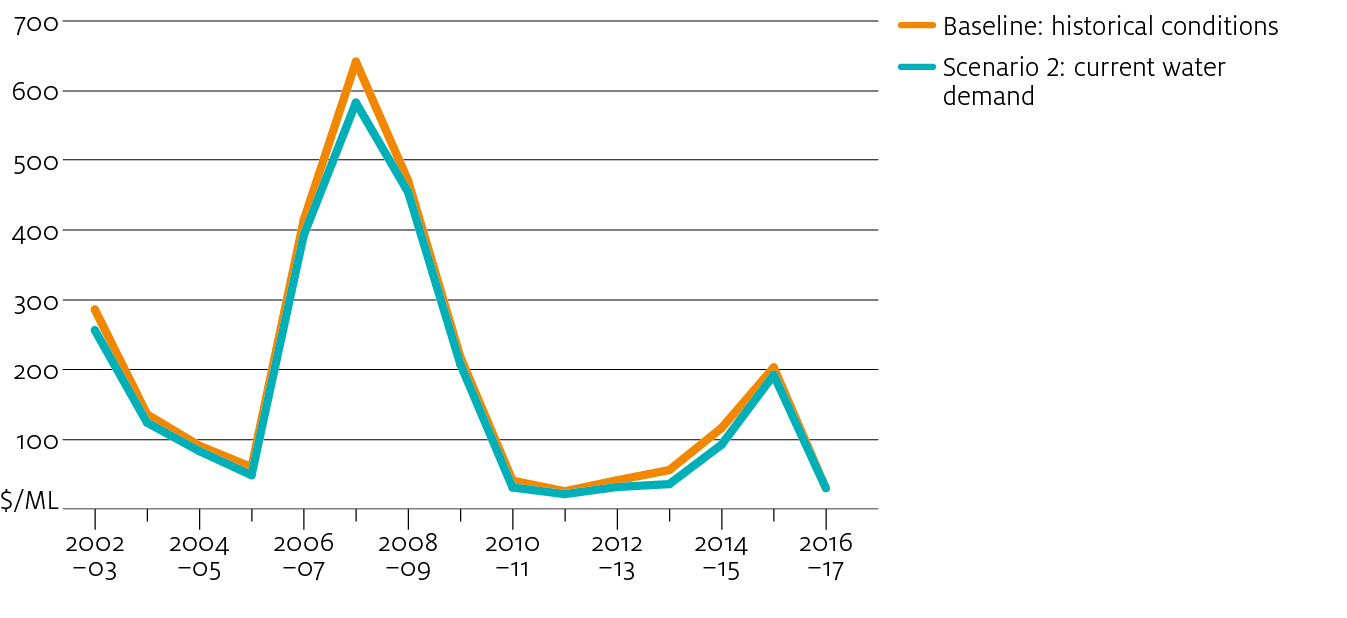
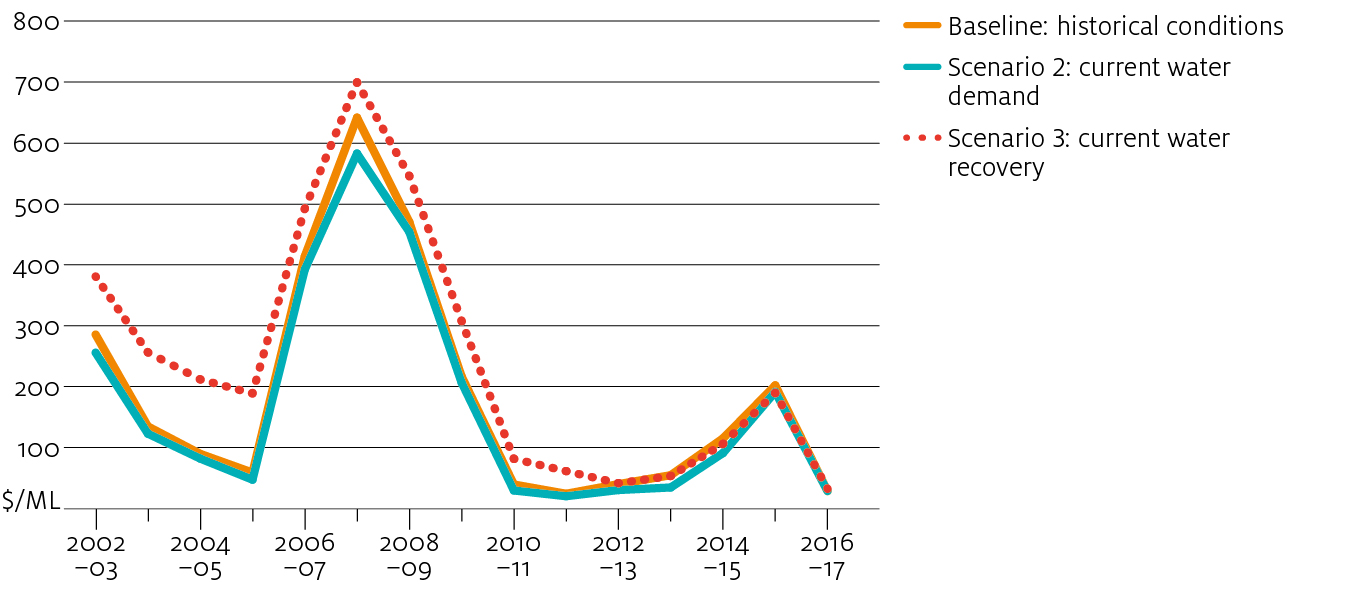
In addition to current trade limits, Scenario 2 assumes current demand for water applies over the entire modelling period, while still keeping environmental water recovery and carryover behaviour at historical levels. With the exception of the Lower Darling trading zone, prices are marginally lower in every other trading zone in Scenario 2 compared with the baseline. This is reflected in the weighted average price for water allocations across the sMDB (Figure 9). These results are consistent with the estimated changes in long-run demand for water (discussed in Chapter 3), which shows a decrease in water demand at most price levels.
The long-run changes in water demand also have a significant effect on the volume of water use across activities and regions, and therefore on trade patterns. For example, in this scenario, the area of irrigated grazing pastures in the Murrumbidgee is near zero in almost every year (see Tableau dashboard). The decrease in water use for opportunity crops such as grazing pastures and rice (Table 6) also means more water is available for high value crops through trade.
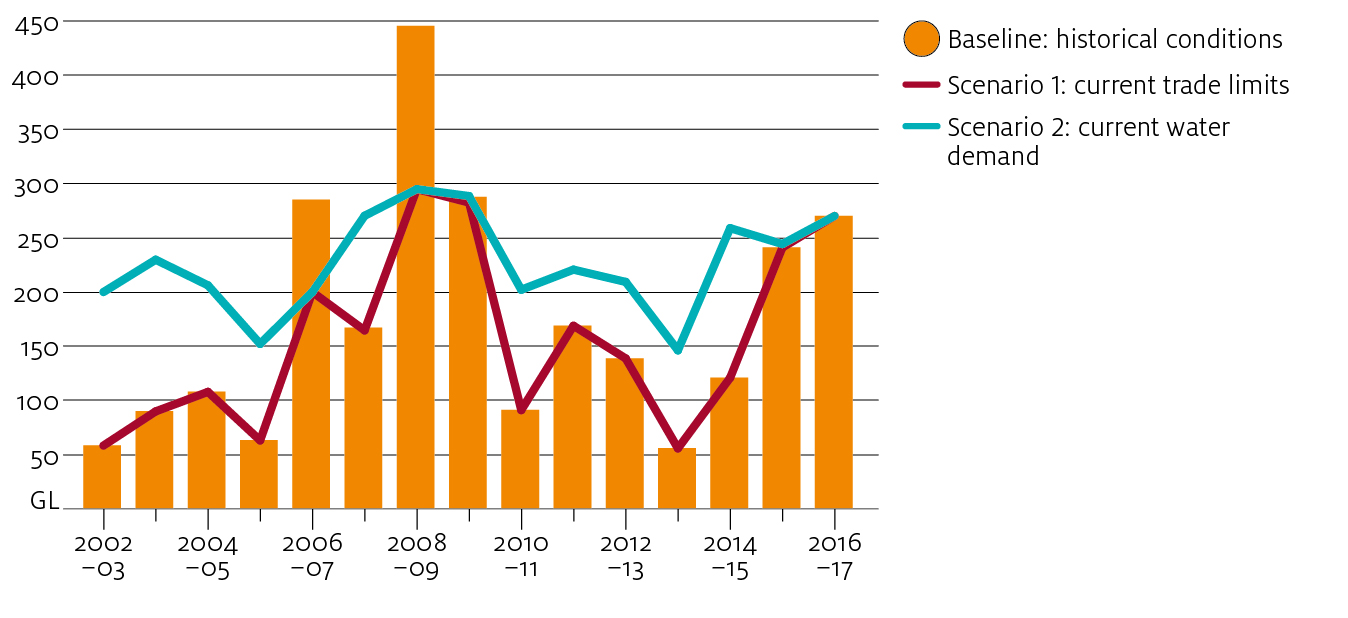
The greater demand for water used for perennial crops grown in the Victorian Murray regions leads to significantly higher inter-regional trade flows in many years in Scenario 2 compared with the baseline (Figure 10), because the allocation market distributes water to those most willing to pay for it. While trade flows (in Scenario 2) are lower during the Millennium drought due to trade limits, most other years have higher trade flows comprised mostly of greater imports of water into the Victorian Murray region and exports from the Murrumbidgee (Table 4). The scenario also shows a shift towards more consistent trade volumes each year—in contrast, the baseline had high trade activity during dry years but relatively low in wetter years.
Scenario 3: current water recovery
In Scenario 3, environmental water recovery to date is applied over the entire modelling period —including water entitlements recovered by the Commonwealth through buyback and infrastructure programs between 2007–08 and 2016–17 (Appendix A). Current demand and trade limits are also imposed, while keeping carryover behaviour at historical levels. This leads to a reduction in total water allocation supply relative the baseline scenario (Figure 11). Because the baseline scenario includes the effects of historical water recovery, the two scenarios converge towards the end of the modelling period.
This scenario cannot be used to measure the historical effects of Commonwealth water recovery programs or the Basin Plan more generally. This scenario is forward looking, simulating what might happen under a repeat of historical seasonal conditions, given current water demand (for example, current technology, capital investment and commodity prices) and current water recovery. An assessment of government water recovery programs would require specific with and without water recovery scenarios, which remains beyond the scope of this study.
In previous research, an early version of the model was used to assess the effects of water purchase programs on sMDB allocation prices (Hughes, Gupta & Rathakumar 2016). However, a complete assessment of all water recovery programs would require more information on the effects of on-farm and off-farm infrastructure programs, beyond the volumes of water entitlement recovered. For example, on-farm infrastructure programs affect farm productivity and water use efficiency, while off-farm programs can involve network rationalisation, all of which have implications for water demand (Hughes, Gupta & Rathakumar 2016). This study does not explicitly account for these infrastructure effects, although they are implicitly included within the model’s estimated water demand functions (discussed in Chapter 3). As a result, the combined effects of government recovery programs and changes in water demand can be estimated, but the effects of government programs cannot be separated.
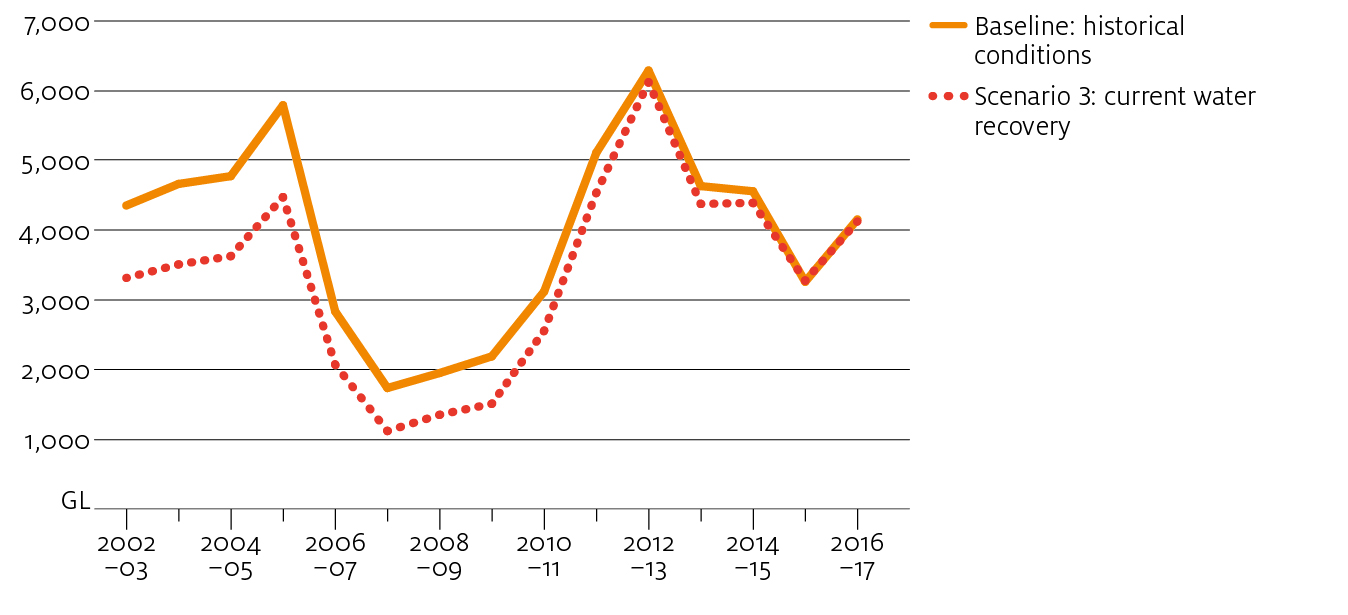
Figure 12 shows a weighted average price for water allocations across the sMDB in Scenario 3, compared with the baseline. Since the supply of water allocations are reduced in this scenario, market prices are higher in each trading zone and year (relative to Scenario 2).
The inclusion of water recovery also leads to greater inter-regional trade flows (Table 4). However, given the application of current trade limits over the modelling period, this also means that trade limits were binding more often in this scenario compared with the baseline (Table 5).
As would be expected, area irrigated is lower in this scenario for all regions except the Victorian Murray region below the Barmah choke, where water demand is higher due to a greater proportion of perennial plantings.
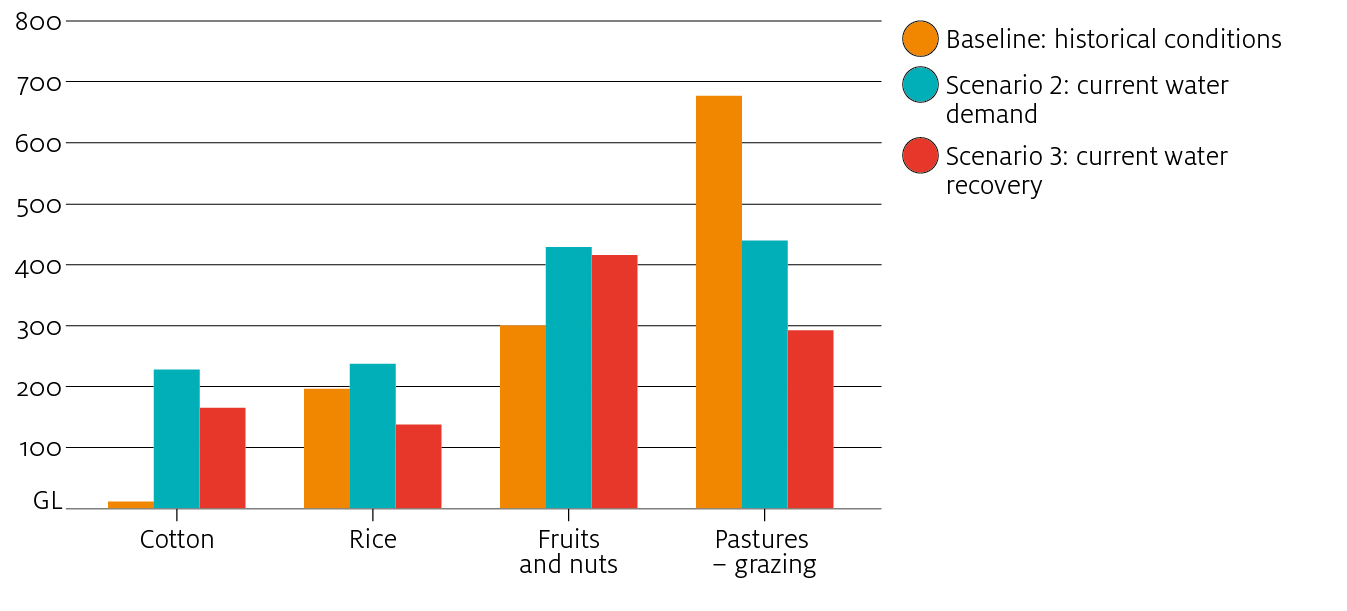
Average irrigation water use during the peak of the Millennium drought (2006–07 to 2008–09) by activity is shown in Figure 13. Including current water recovery (Scenario 3) has minimal effect on fruit and nut water use during the worst of the drought because of the relatively inelastic nature of water demand for this activity. In contrast, water applied to pastures and rice decreased significantly during this period.
Scenario 4: current carryover behaviour
In Scenario 4, current carryover behaviour (2007–08 onwards) is applied over the entire modelling period, while also imposing the current market conditions described in Scenario 3 (for detail on the methodology see Appendix A).
Since 2007–08 the proportion of total water allocation being held in storage between years via carryover rights has increased significantly (Hughes, Gupta & Rathakumar 2016). This increase is due largely to the introduction of carryover rights in Victoria (and South Australia) around this time. The shift toward greater carryover could also reflect a stronger preference for water supply reliability, due to the increased proportion of higher value irrigation activities (such as horticulture) and an observed increase in rainfall and stream flow variability in the region.
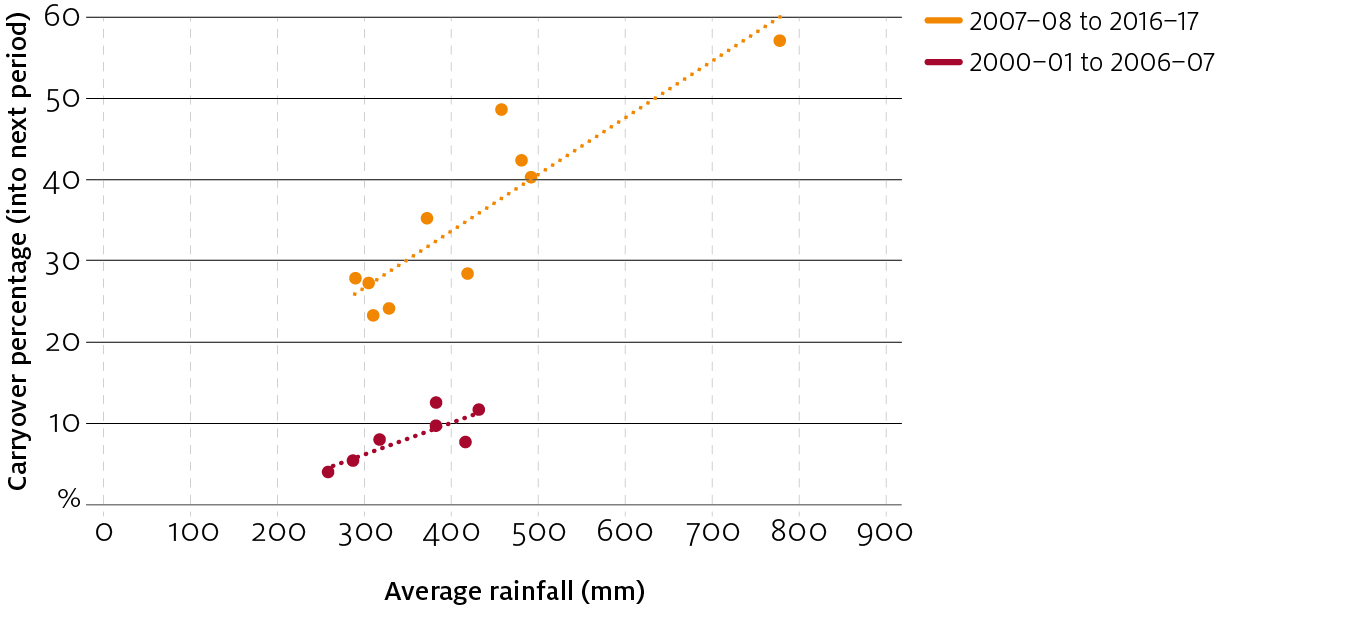
Figure 14 illustrates the significant change in carryover behaviour that has occurred in the sMDB since 2007–08—for years with comparable seasonal conditions (rainfall), a much higher proportion of water allocation was carried over into the next year.
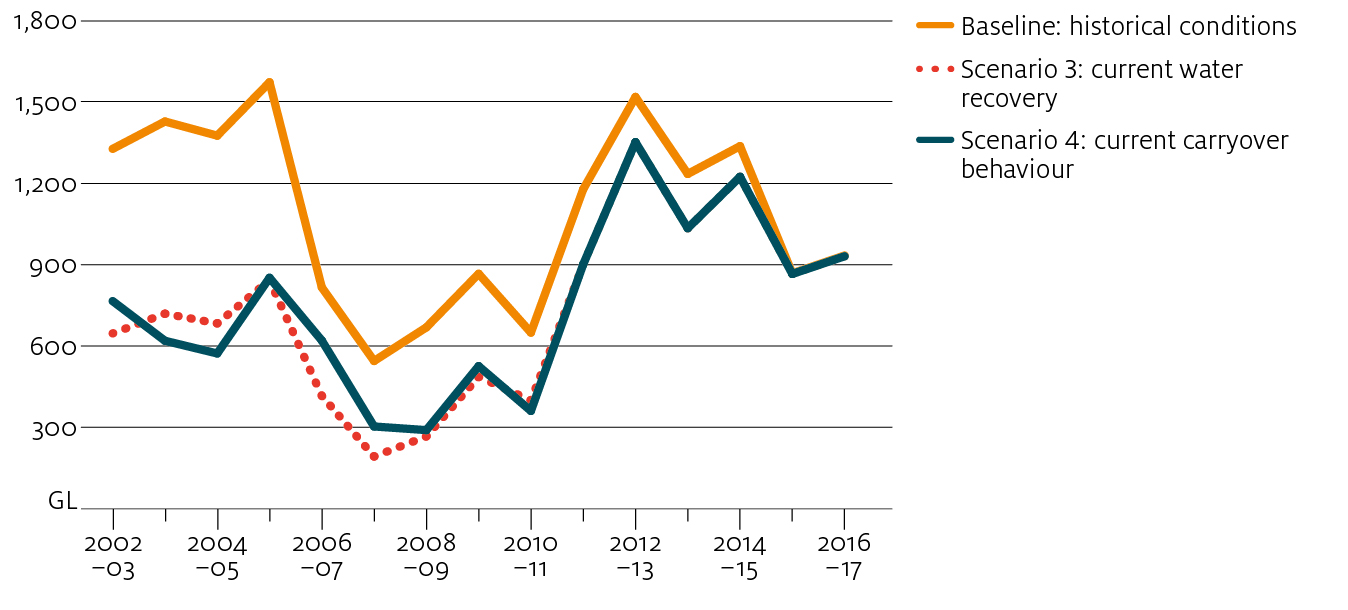
The effect on allocation water supply is shown in Figure 15. Applying current carryover behaviour leads to slightly lower allocations available for use in the years leading up to the Millennium drought and higher allocations during the drought. As would be expected, greater carryover allows water users to conserve water in wet and average years, in order to establish a storage reserve that can be drawn down during dry periods.
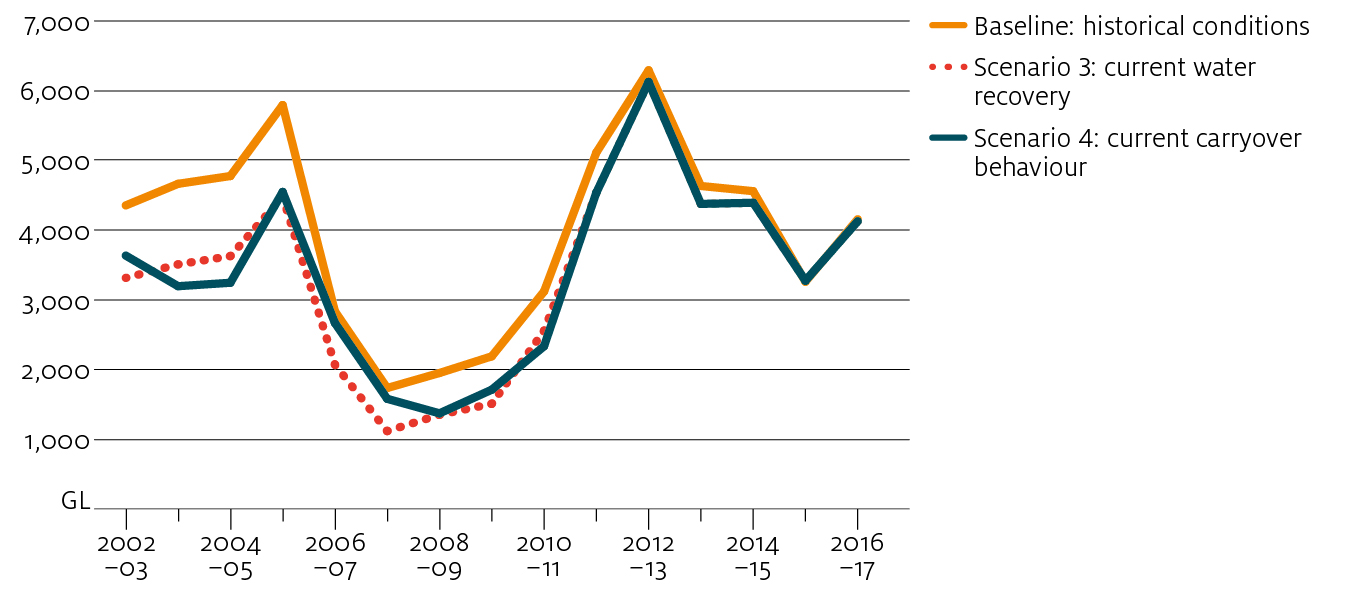
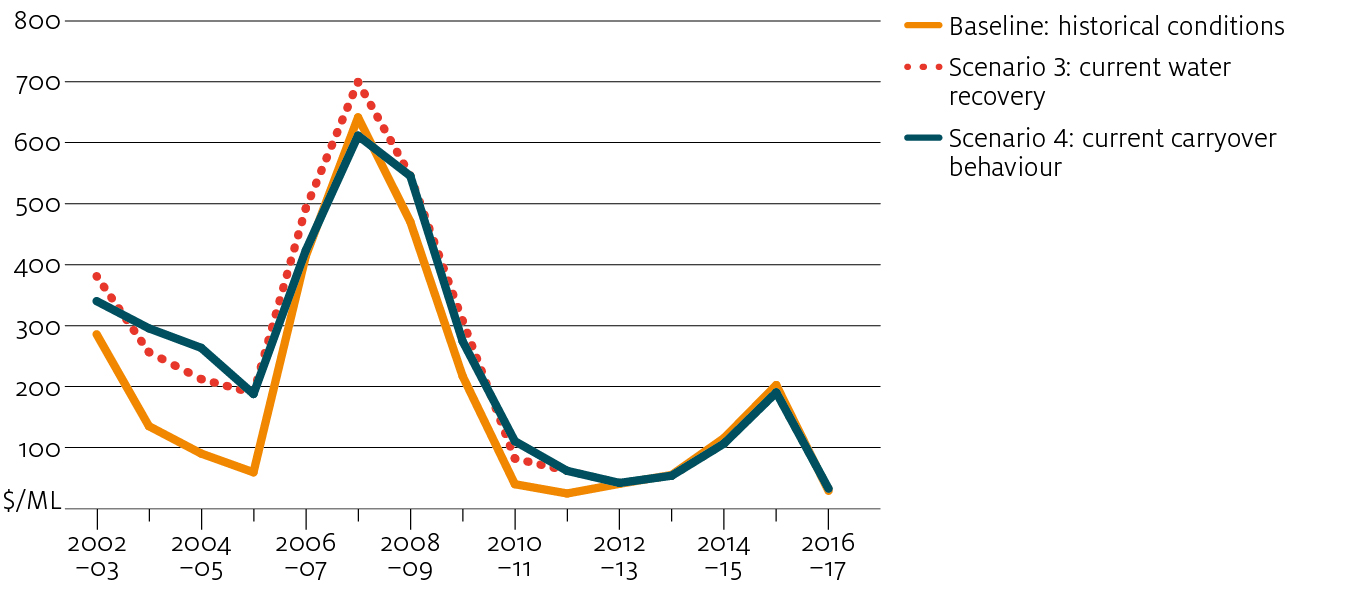
Figure 16 shows weighted average allocation prices in the southern Basin for the baseline, Scenario 3 and Scenario 4. Allocation prices are slightly higher in Scenario 4 in the lead up to the drought, while water users increase their carryover reserves. However, the increased carryover water helps to significantly lower prices during the peak of the drought, especially during 2006–07 and 2007–08 (comparing Scenario 4 with Scenario 3). The results demonstrate carryover working exactly as intended—helping to smooth water prices over time.
The results suggest that, with current market conditions, a repeat of the Millennium drought (particularly the years 2006–07 to 2008–09) would result in allocation prices around the same as those observed historically. That is, more flexible carryover rules and a slight reduction in total irrigation water demand would temper the effect of water recovered for environmental use.
Applying current carryover behaviour over the modelling period also affects inter-regional trade flows. In Scenario 4, inter-regional trade flows were greater in the years leading up to the Millennium drought, and lower during the drought, compared with Scenario 3. This reflects the ability of farmers to draw on carryover reserves during the drought, reducing their need to purchase water on the allocation market.
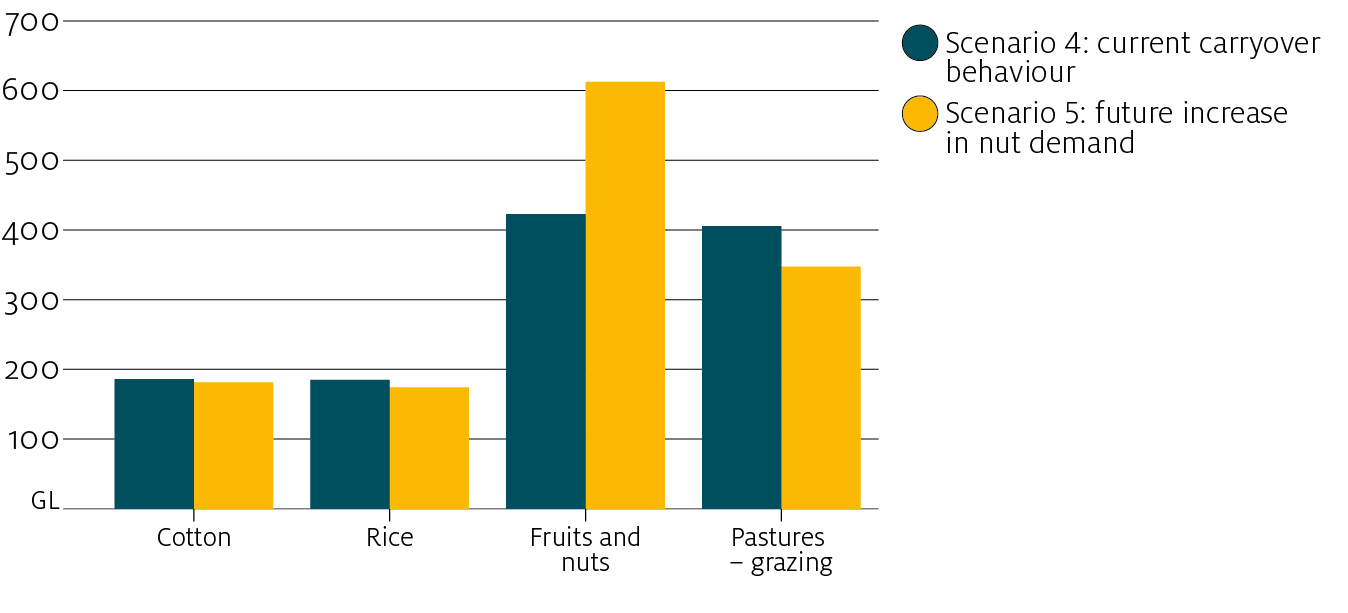
A greater supply of allocation water during the drought, facilitated by higher levels of carryover, also has an effect on irrigation activity (see Tableau dashboard), particularly grazing pastures. The volume of water used to irrigate grazing pastures is lower before the drought and higher during the drought compared with Scenario 3 (Figure 17). There is also a small increase in water used to irrigate rice and almost no change in water used for cotton and fruits and nuts. This suggests that, through the allocation market, the water required for these high-value production activities is met regardless of carryover behaviour. Increased carryover essentially provides more water for annual activities during the drought, especially grazing pastures.
Scenario 5: future increase in nut demand
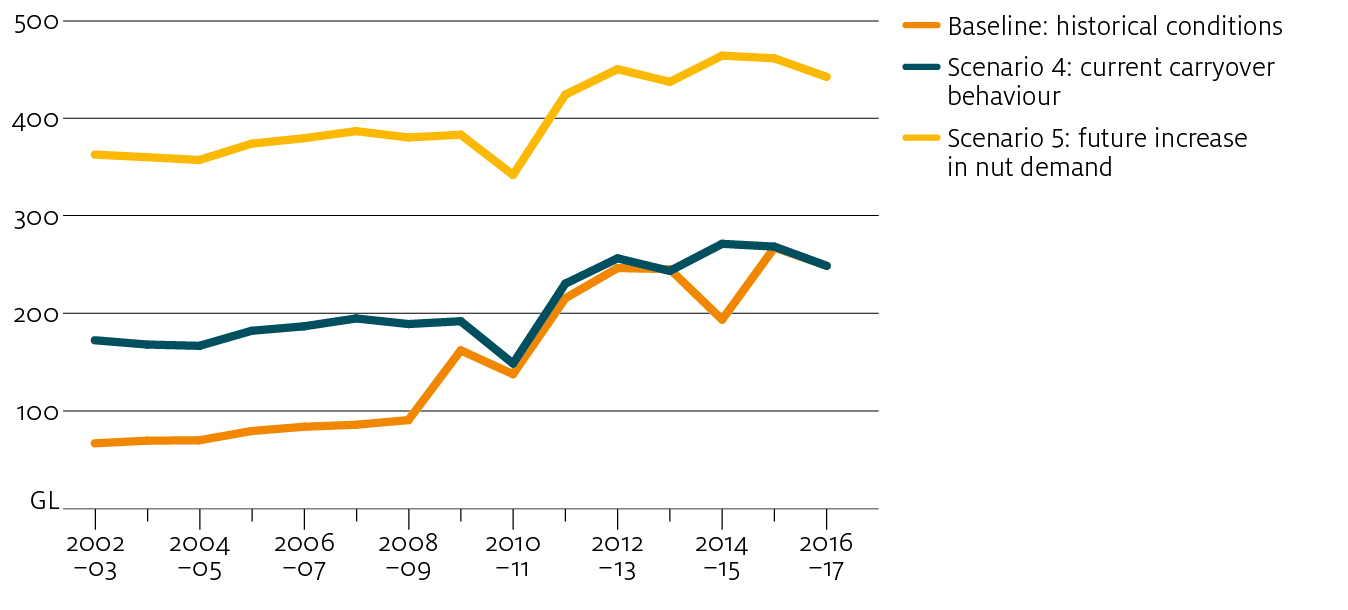
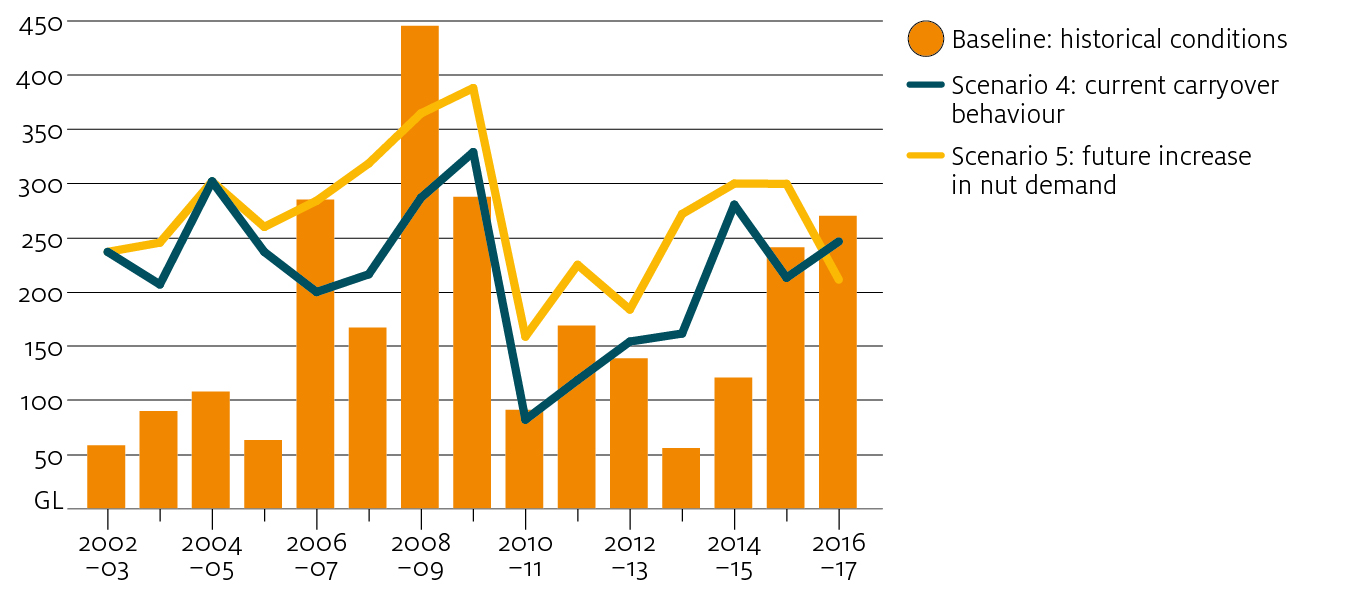
Scenario 5 examines the potential effect of a future increase in water used for nut production in the Victorian Murray on the allocation market and irrigation activity in the rest of the southern Basin. Water used for nut production in the Victorian Murray region below the Barmah choke was increased by around 190 GL each year on top of the current demand applied in Scenario 4 (Figure 18). All other market conditions were kept consistent with Scenario 4—current water demand for other activities in all other regions, current trade limits and water recovery, and current carryover behaviour. Average water allocation prices are marginally higher in Scenario 5 compared with Scenario 4 in most years (Figure 19).

Inter-regional trade flows are higher in most years in Scenario 5 compared with Scenario 4 (Figure 20), as farmers in the Victorian Murray enter the allocation market to acquire more water for horticulture production. Particularly during the drought, trade into the Murray below Barmah choke trading zone is higher compared with Scenario 4 (Figure 21). Most of the additional water use in the Victorian Murray was sourced from the Goulburn-Loddon zone (or the Northern Victoria trading zone), supplemented by exports from NSW catchments. Trade limits were reached 22 times in this scenario, more often than any other scenario (Table 5).
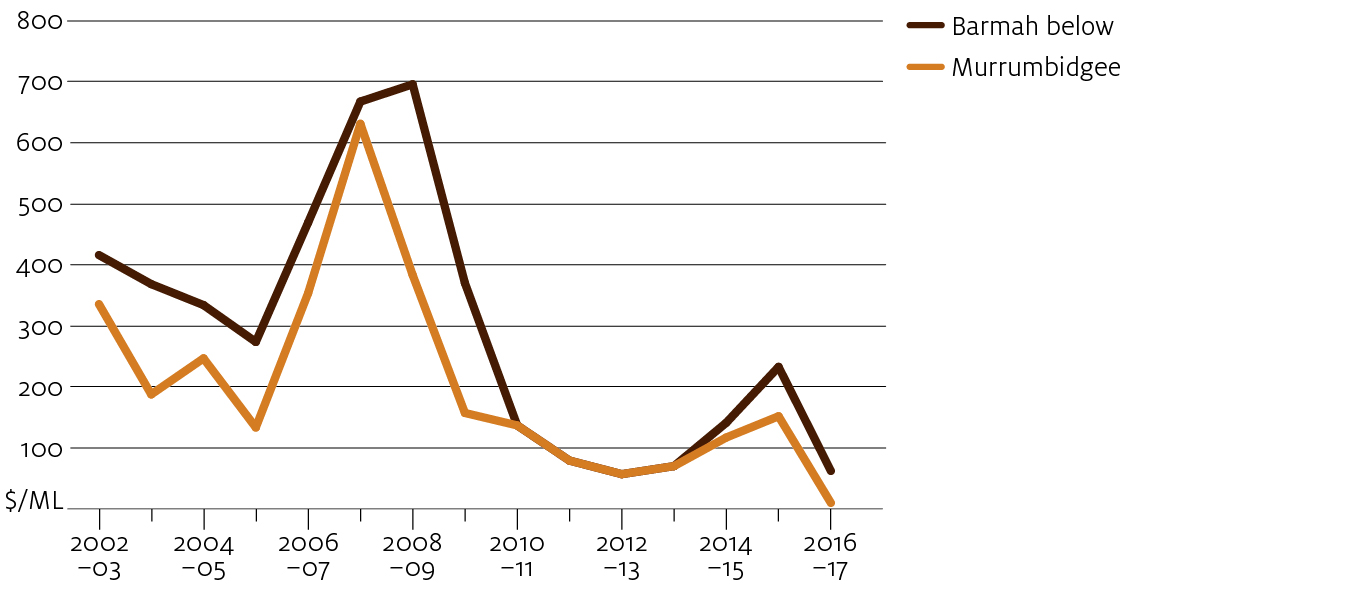
Binding trade limits lead to price gaps between trading zones. In particular, the Barmah choke and Murrumbidgee export limits are frequently binding in Scenario 5. As the demand for water in the Barmah below trading zone is greater, the price is higher in most years compared with the Murrumbidgee (Figure 22).
In general, these results are consistent with recent observation. For example, trade limits lead to lower prices in the Murrumbidgee relative to the Murray during both 2015–16 and 2016–17 (ABARES 2018). In 2017–18 this trend has reversed but with higher water allocations prices in the Murrumbidgee.
While this reversal may reflect some recent changes in water demand (for example, further expansion in cotton in the Murrumbidgee), it can be largely explained by the supply conditions prevailing in 2017–18 (relatively low allocations in the Murrumbidgee). In Appendix B the model is applied to simulate the market under 2017–18 water availability conditions, but with estimated 2016–17 water demand. The model replicates observed 2017–18 prices relatively accurately. While the Murrumbidgee import limit is not reached within the simulation, the volume of exports is relatively low (less than 50 GL) in comparison with 2015–16 and 2016–17.
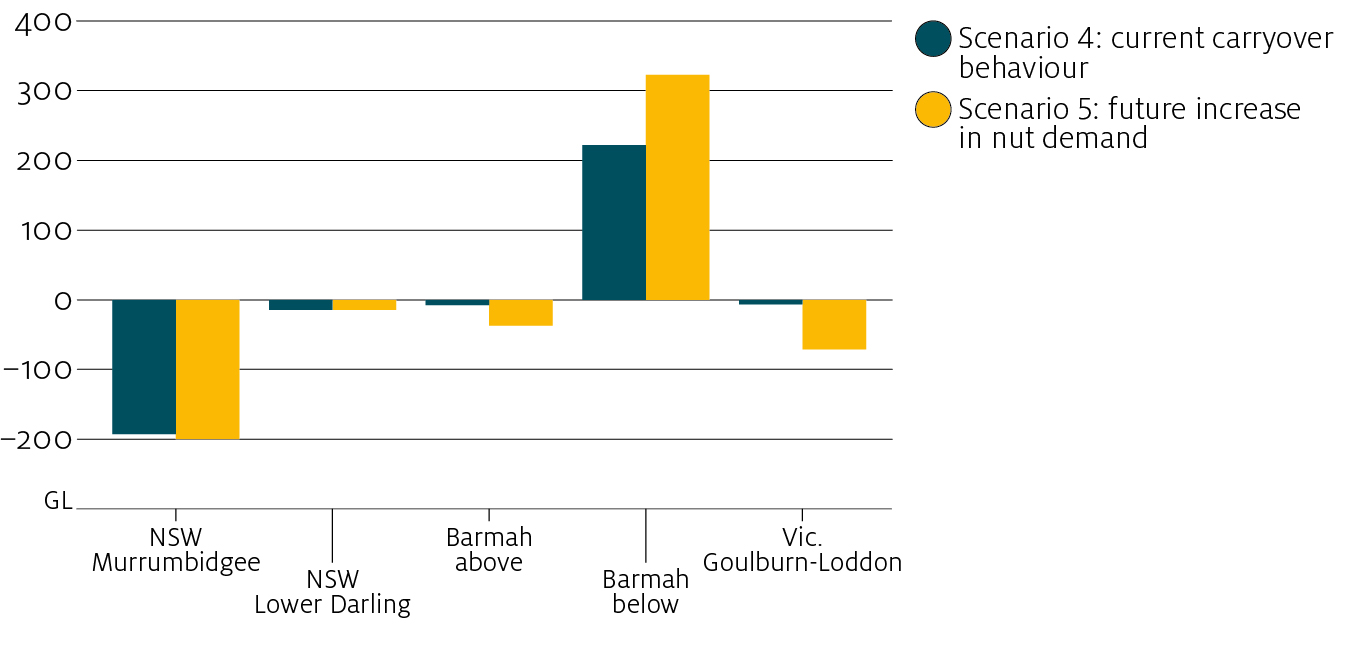
An increase in the volume of water used for nut production is achieved by small decreases in water used for other activities across the southern Basin (Figure 23).
Conclusions
Key findings
Since the peak of the Millennium drought (2006–07 to 2008–09) the sMDB has seen large increases in nut and cotton plantings, decreases in water supply due to environmental water recovery and tighter limits on water trade between regions. These changes have raised concerns about how the water market might cope under dry conditions. However, the results presented in this report suggest that the water market remains in a position to withstand future droughts. Modelling shows that, under a repeat of historical conditions, allocation water prices in the sMDB would rise no higher than the peaks observed during the previous drought.
Although demand for water for cotton in southern New South Wales and almonds in the lower Victorian Murray has increased, this has been offset by general decreases in demand for water from other sectors, including grazing (dairy), rice and other broadacre crops. Modelling results show an overall net decrease in demand for irrigation water at most price levels (comparing 2002–03 and 2016–17). Aggregate water demand is slightly lower, but the composition has changed considerably because of stronger demand in the lower Victorian Murray due to the expansion of almonds.
Changes in carryover rules since 2008 (the introduction of carryover in Victoria and South Australia) would also help to limit price rises under a repeat of the drought. Under the current rules, much larger volumes of water are being stored between years. These reserves leave the sMDB better placed to withstand future droughts. In general, carryover helps to smooth fluctuations in prices, resulting in slightly higher prices in wet to average years (when reserves are accumulated), in turn for significantly lower prices in dry years (when reserves are drawn down).
The scenario results do suggest that key limits on inter-regional water trade, including the Murrumbidgee export limit and the Barmah choke, are likely to have a binding effect on the market more often in the future, due largely to the expansion in horticultural water demand in the lower Victorian Murray. As a result, modelled allocation prices are frequently higher in the below Barmah trading zones compared with other regions in the sMDB. In the Goulburn-Loddon, import trade limits are expected to become less of an issue in future, as the region shifts towards net export of water allocations.
These results are consistent with recent experience in the market with binding Murrumbidgee export limits in 2015–16 and 2016–17 and a binding Goulburn export limit in 2017–18. Murrumbidgee trade flows reversed in 2017–18 (leading to binding import limit), but modelling results suggest this is likely to be a temporary situation reflecting the prevailing water supply conditions (low allocations in the Murrumbidgee).
Finally, water price peaks are simulated to be no higher under a repeat of extreme drought conditions, but they are higher on average due in part to environmental water recovery. The modelled scenarios also suggest a change in the distribution of prices, with fewer years of low prices (less than $100 per ML). This could have implications for flexible irrigation activities (such as rice), where full production is only achieved in low price years. However, the climate sequence used in these scenarios (2002–03 to 2016–17) is unlikely to represent the full range of future conditions.
Water market reform
This study demonstrates the importance of water trading and carryover in helping the irrigation sector adjust to short-term changes in water availability. During drought periods, water trading allows scarce water resources to be allocated to regions and industries in greatest need. Carryover helps water users prepare for future droughts by accumulating storage reserves and drawing down on these reserves during dry years.
Water trading and carryover also play a role in facilitating long-run adjustment. Water markets allow water allocations and entitlements to be traded into expanding industries and regions. Carryover rights give water users some control over the reliability of supply, allowing for adjustment in response to industry changes—such as increased reliability to support more horticultural activity. Such large investments in new activities like nuts and cotton are unlikely to have been possible in the absence of water markets and carryover.
Because of the complexity of river and irrigation networks, water markets require significant government effort to implement. In particular, governments need to regularly consider how the property rights and rules that support these markets can be refined.
One key issue is the setting of inter-regional trade limits. Modelling results show that, with current water demand and trading rules, inter-regional trade is likely to be constrained on a regular basis in future. In practice, some limits on water trading will always be necessary to ensure the market respects hydrological constraints. However, managing inter-regional water trade more efficiently may be possible, to allow more trade to occur while still adhering to physical limits (Hughes, Gupta & Rathakumar 2016). A more detailed investigation of the policy options in this area is a potential subject for future research.
Previous research (Hughes et al. 2013) has identified a range of options for fine tuning carryover rules in the Murray–Darling Basin. In particular, scope remains to adopt more frequent continuous water allocation accounting systems in the sMDB similar to those implemented in northern New South Wales and southern Queensland (Hughes et al. 2013). Improvements in carryover rules may also help to relax limits on inter-regional water trading, given that a number of current limits have been justified by a risk of third party effects from storage spill events (Hughes et al. 2013).
Finally, although water market rules need to be continually refined, unnecessary intervention in the market must be minimised. For example, the rise of almonds in the sMDB has raised concerns of over-investment. Although there are practical limits on how much land and capital can be devoted to perennial horticulture in the sMDB (given the variability of water supply), this alone does not justify government intervention.
Farm businesses are well placed to make these capital investment decisions, taking into account trends in commodity prices and technology along with expectations over future water availability (and water market prices). The preferred role for government is providing information on future water supply, including any relevant climate or policy changes (such as environmental water recovery or changes to trading or carryover rules). An informed water market can then provide price signals to guide private investment decisions.
Appendix A: Modelling assumptions
Changes in water demand
Long-run changes in water demand were estimated using functions for land use and water application rate as specified in Gupta, Hughes and Wakerman Powell (2018), holding rainfall fixed at average values and water market prices fixed at $100 per ML. Current demand for water is estimated by fixing the time trend variable in functions for land use and water application rate (see Gupta, Hughes & Wakerman Powell 2018 for more detail) to the last year of data in the model (2015–16 for irrigation activity data) and by applying irrigated area for perennial crops (and the relative proportion of rice and cotton crops) in 2015–16 over the full modelling period.
Trade limits
The annual trade limits assumed in the ABARES water trade model in the baseline scenario are described in Table A1. For each of the future scenarios discussed in this report, the annual trade limits in 2016–17 are applied over the entire modelling period for all regions, except Lower Darling where trade limits are kept at historical values.
TL Lower trade limit. TU Upper trade limit.
Environmental water recovery
Water recovered for environmental use in the baseline scenario is described in Table A2. These data are sourced from the Department of Agriculture and Water Resources—for more detail see Gupta, Hughes & Wakerman Powell 2018. It includes water recovered through both purchase and infrastructure programs, for all entitlement types included in the water trade model. These figures exclude any recovery against groundwater, unregulated/supplementary and conveyance entitlements types. For Scenarios 3, 4 and 5, water recovered to date is assumed to apply over the entire modelling period. This is calculated as the sum of water recovered of each entitlement type (see the last column in Table A2).
Carryover behaviour
Carryover behaviour is econometrically estimated as carryover percentage in each region. Given the evidence of a change in carryover behaviour in the southern Murray–Darling Basin, a dummy variable is used to separate carryover behaviour before and after 2008.
Carryover percentage in NSW regions (i∈{1,5,7} Table A3) is estimated as a function of rainfall, allocation water, and the 2008 dummy variable (equation 1), and in Victorian regions (i∈{2,3,4,8}) as a function of rainfall and the 2008 dummy variable (equation 2). Carryover is kept at historical levels in NSW Lower Darling and SA Murray.
coit=fco(Rit,D08it,Ait,βico) (1)
coit=fco(Rit,D08it,βico) (2)
Where Rit denotes average farm rainfall (mm) in region i in year t, Ait denotes total volume of water allocations available for trade in region i in year t, and the dummy variable (D08it) takes on a value of 1 for all years after 2008 and 0 for all years prior.
Estimation
Parameters for carryover functions described in equations 1 and 2 were estimated via linear Ordinary Least Squares. For equation 1, we fit the following model:
coit=β0ico+β1i.Rit+β2iAit,+β3iD08it (3)
Where (i∈{1,5,7}
As shown in Table A4, the R-squared values for fitted equations suggest a reasonable degree of accuracy for all NSW catchments. Parameters for allocations and the 2008 dummy variable are significant at the 5 per cent level for each catchment.
Note: * denotes significance at the 95% level
For equation 2, we fit the following model:
coit=β0ico+β1ico.Rit+β3icoD08it (4)
Where (i∈{2,3,4,8})
As shown in Table A5, the R-squared values for fitted equations suggest a high degree of accuracy for most Victorian catchments. Data constraints affect the accuracy of fitted parameters for the Loddon Campaspe region. Parameters for rainfall and the 2008 dummy variable are significant at the 5 per cent level for each catchment (with the exception of rainfall for Loddon Campaspe).
Note: * denotes significance at the 95% level.
Appendix B: Water allocation prices in 2017–18
The ABARES water trade model (WTM) was used to investigate recent trends in water trading activity and allocation prices in the NSW Murrumbidgee region. Traditionally, this region has been a net exporter of water. In contrast, in 2017–18 the import trade limit was reached in the Murrumbidgee, leading to higher prices compared with the Murray. In the past five years cotton activity in this region has expanded significantly (Gupta & Hughes 2018b), leading to conjecture that this reversal in trading activity may indicate an increase in demand for water in the region.
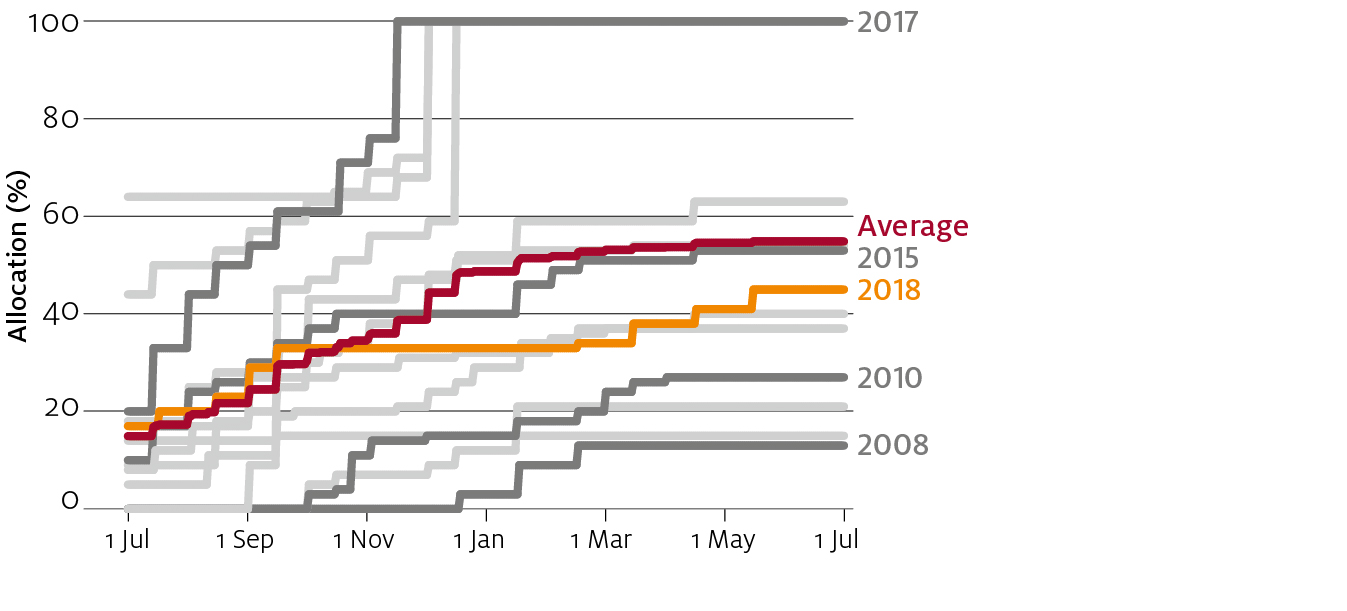
However, the supply side picture is also worth considering. In 2017–18 the allocation percentage for general entitlements remained at 32 per cent for most of the water year, increasing to 45 per cent towards the end of the water year (compared with a historical average of 55 per cent) (Figure B1). In contrast, allocations for northern Victoria high reliability entitlements reached 100 per cent early in the water year.
To model the effects of supply side conditions on recent trends in water trading in the Murrumbidgee, demand for irrigation water was fixed at 2015–16 levels, while allocation water supply (entitlement volumes, and allocation and carryover percentages) and rainfall were updated with data up to July 2018. In addition, the export trade limit for the Northern Victoria trading zone was increased to 125 GL in 2017–18 (from 100 GL in previous years) based on the observed net trade position for this region using data from the Victorian Water Register.
The modelled allocation price and observed average annual price for each catchment region in 2017–18 is shown in Table B1. While keeping demand for water fixed at 2015–16 levels, the model is able to replicate the water prices in 2017–18 for the Murrumbidgee and Murray catchments relatively accurately. If there had been a large increase in water demand in the Murrumbidgee since 2015–16, then a greater gap would have been expected between the observed and modelled price.
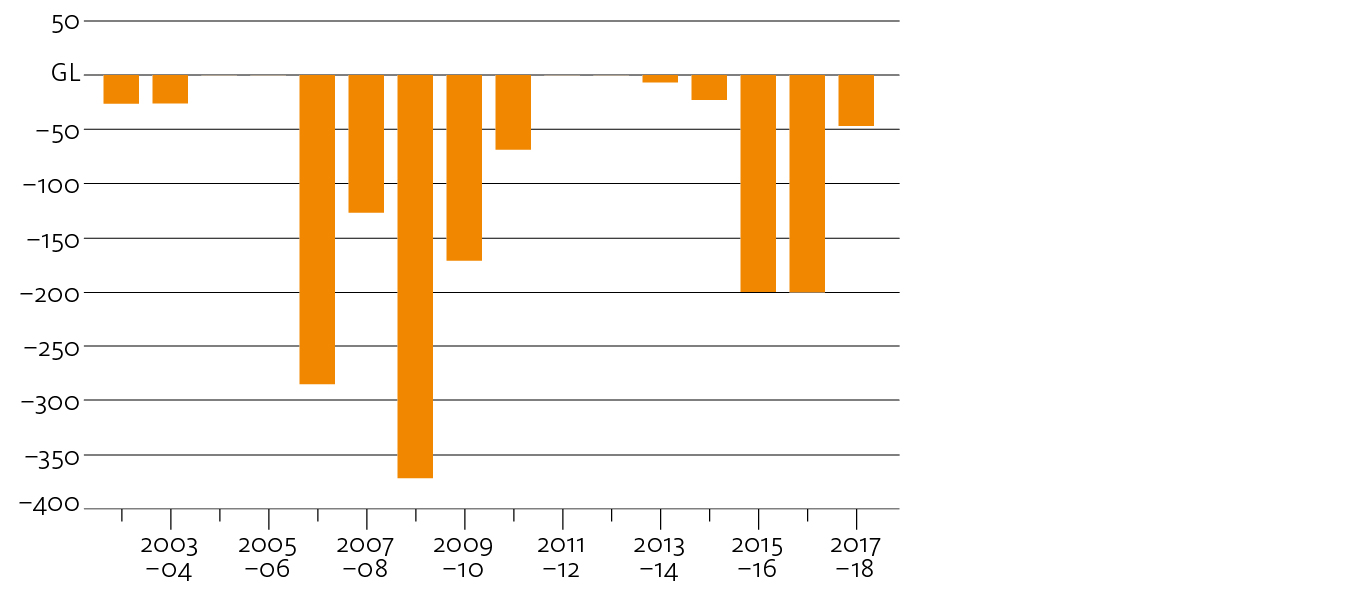
Based on updated supply side data alone, the Murrumbidgee remains a net exporter of water. However, the volume of water exported is substantially lower than observed in the previous two years and remains well below the region’s export limit (Figure B2). The model also correctly predicts that the Goulburn region export limit is reached, leading to lower prices in the Northern Victoria trading zone (although it overstates the size of this effect).
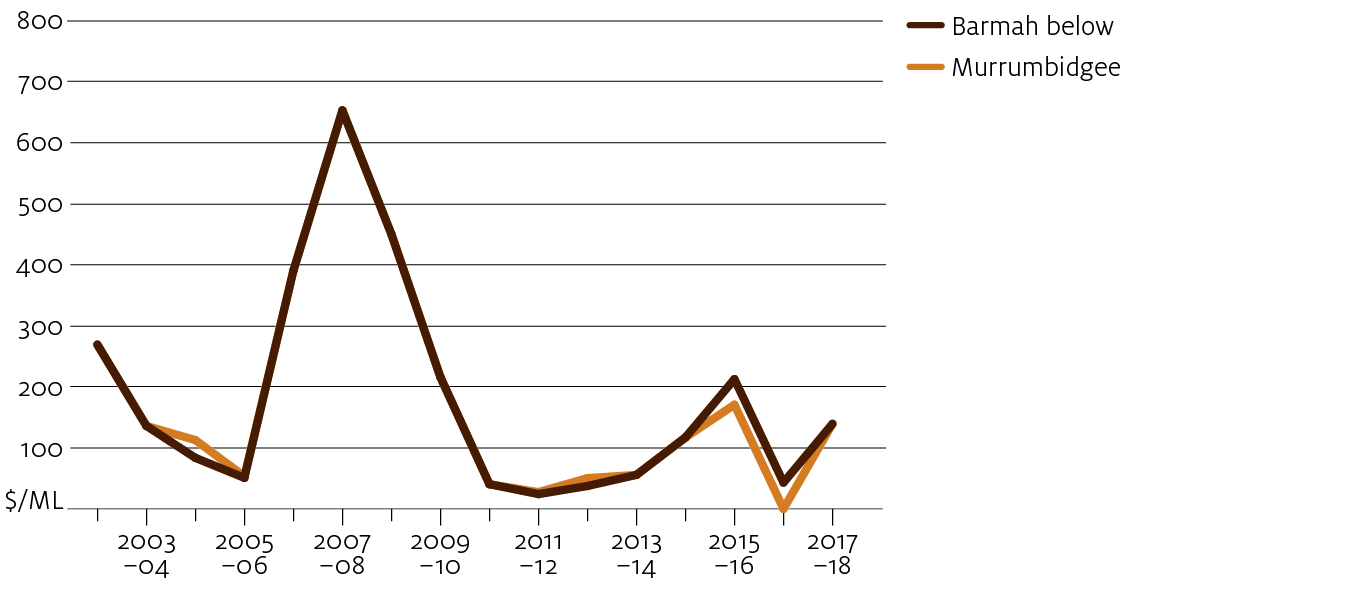
The results suggest that the reversal in the Murrumbidgee’s trade position to a net importer of water in 2017–18 can be at least partly explained by changes in allocation water supply. In the model baseline scenario, there are a number of years (2004–05, 2005–06, 2011–12 and 2013–14) where the Murrumbidgee import limit is reached and the price is higher in this region compared with the Murray (Figure B3) as observed in the market during 2017–18. From these results, the model may possibly be slightly underestimating current water demand in the Murrumbidgee (given it is based on data only up until 2015–16). However, more data would be required to confirm this.
References
ABARES 2018, Australian Water Markets Report 2016–17, Australian Bureau of Agricultural and Resource Economics and Sciences, Canberra.
CEWO 2018, Environmental water holdings, Commonwealth Environmental Water Office, Department of the Environment and Energy, Canberra.
Department of Agriculture and Water Resources 2017, Commonwealth water reform investments in the Murray–Darling Basin: Analysis of social and economic outcomes (pdf 1.58 mb), A Department of Agriculture and Water Resources report to inform the Murray–Darling Basin Authority’s 2017 interim evaluation of the Basin Plan, Canberra, November.
Gupta, M, Hughes, N & Wakerman Powell, K 2018, A model for water trade and irrigation activity in the southern Murray-Darling Basin, ABARES conference paper, Canberra, January.
Gupta, M & Hughes, N 2018a, ‘Trends in horticulture activity in the Victorian Murray region’, Agricultural commodities: March quarter 2018, ABARES, pp. 85–86, Canberra, March.
Gupta, M & Hughes, N 2018b, ‘Shift from rice to cotton production in NSW Murrumbidgee region’, Agricultural commodities: March quarter 2018, ABARES, pp. 74–76, Canberra, March.
Hughes, N, Gupta, M & Rathakumar, K 2016, Lessons from the water market: the southern Murray–Darling Basin water allocation market 2000–01 to 2015–16, ABARES research report 16.12, Canberra, December.
Hughes, N, Gibbs, C, Dahl, A, Tregeagle, D & Sanders, O 2013, Storage rights and water allocation arrangements in the Murray–Darling Basin, ABARES technical report, Canberra, December.
Download report
Department of Agriculture and Water Resources, 2018
Download the full version of the Future scenarios for the southern Murray–Darling Basin water market.
| Document | Pages | File size |
|---|---|---|
Future scenarios for the southern Murray–Darling Basin water market PDF  |
44 | 4 MB |
If you have difficulty accessing this file, visit web accessibility for assistance.