Authors: Rhys Downham, John Walsh, Mihir Gupta, David Galeano and Simon Hone
Publication date: 11 June 2024
A related research product is Community vulnerability and adaptive capacity in the Murray–Darling Basin report – a focus on irrigation in agriculture.
Summary
- ABARES has been asked by the Department of Climate Change, Energy, the Environment and Water (DCCEEW) to examine the impacts on irrigated agriculture of using buybacks to meet outstanding recovery under the 450 GL (gigalitre) target for enhanced environmental outcomes.
- DCCEEW provided three buyback scenarios in the southern Murray–Darling Basin (MDB) with recovery volumes of 125 GL, 225 GL, and 325 GL.
- The ABARES Water Trade Model was used to simulate these buyback scenarios, which were assessed against a baseline scenario involving no additional water recovery. The results show the impacts on water allocation prices, water use, and the value of irrigated production (Table 1). These results are summarised below and discussed in depth in the body of the report.
- Ideally, the impacts in both the northern and southern MDB would have been assessed. ABARES has a model capable of doing this for the southern MDB but unfortunately not for the northern MDB. This means only results for the southern MDB are presented in this report.
Water allocation prices will increase
- Buybacks reduce the supply of water available for irrigation, increasing water allocation prices. In the 225 GL buyback scenario, average water allocation prices across the southern MDB are estimated to increase by $45/ML (10%).
- Higher water allocation prices are not a reliable indicator of aggregate social and economic impacts but do have distributional consequences, generating additional revenue for irrigators who are sellers of water allocations and increasing costs for irrigators who are buyers.
Water use will decrease
- Higher water allocation prices reduce water use. In the 225 GL buyback scenario, average water use across the southern MDB is estimated to decrease by 133 GL/year (4%). The reduction in average water use is less than the 225 GL of recovery for several reasons, including future climate assumptions, substitution to other sources of water, and changes in carryover behaviour of irrigators.
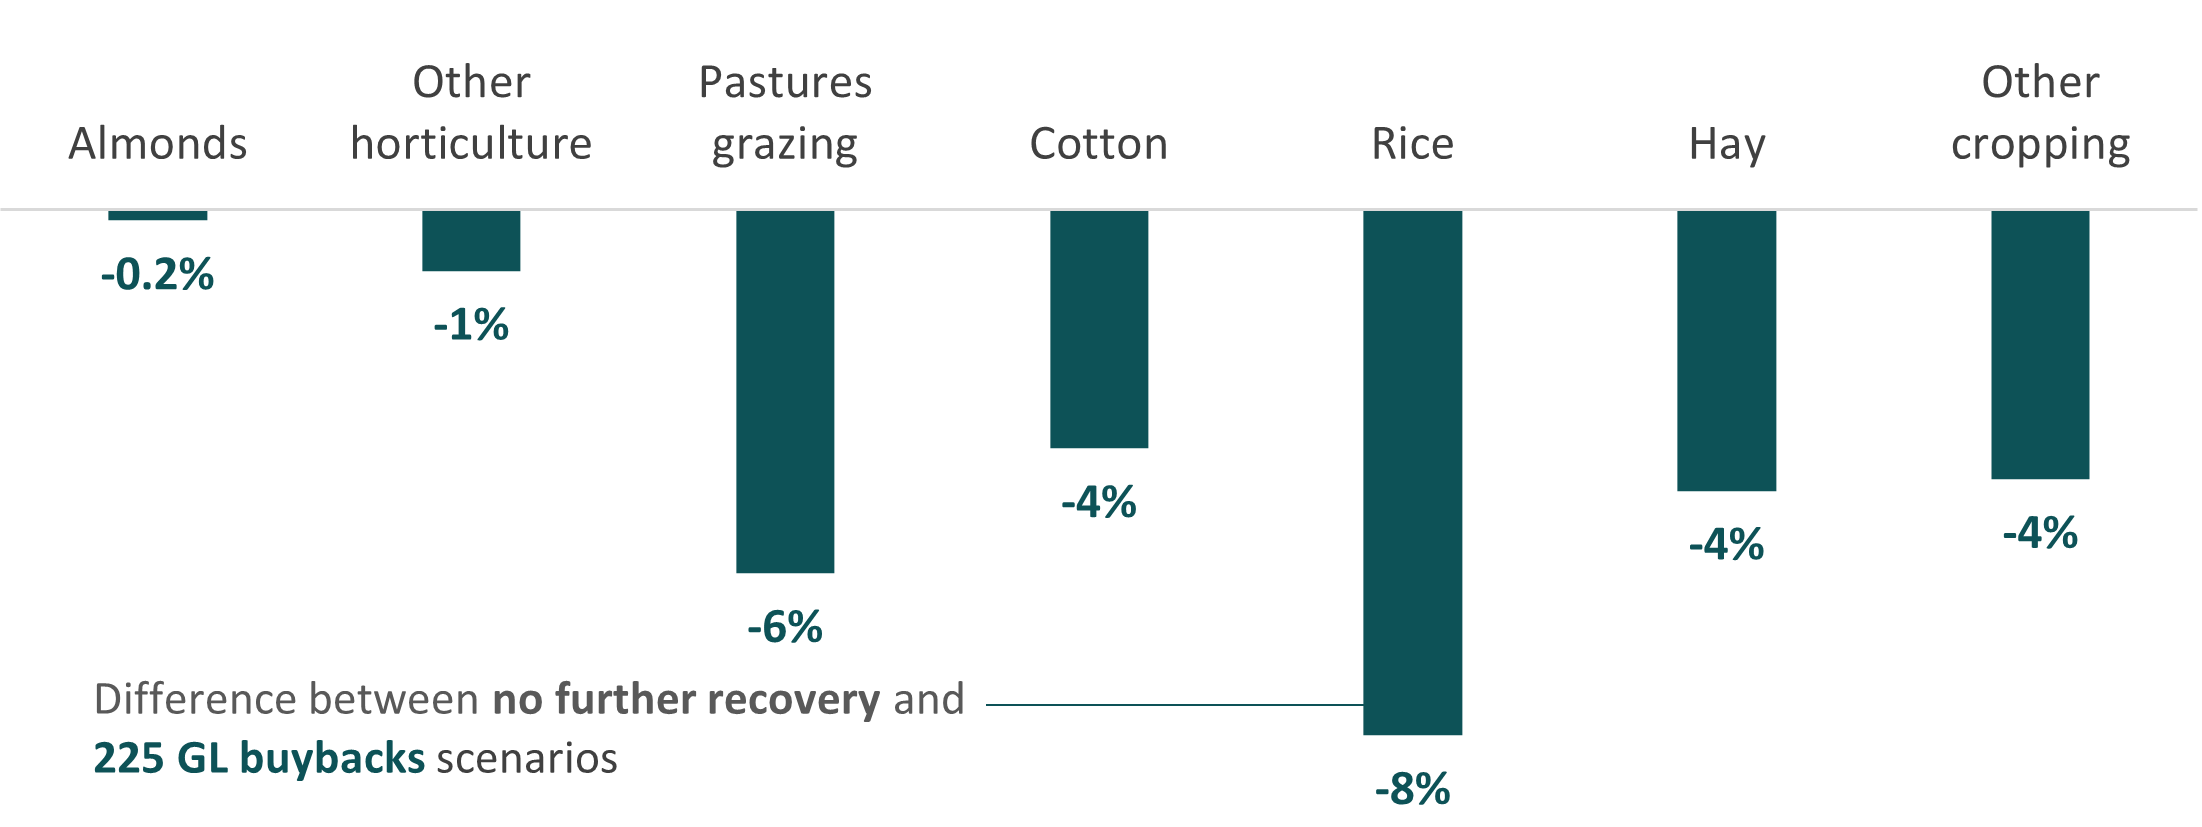
- In percentage terms, water use is estimated to decrease the most for rice (8%) and pastures (6%), and least for almonds (0.2%) and other horticulture (1%). From a regional perspective, the largest estimated reduction in average water use occurs in Northern Victoria (6%).
Production value will decrease to a lesser extent
- Lower average water use reduces the gross value of irrigated agricultural production. In the 225 GL buyback scenario, the average value of irrigated production is estimated to decrease across the southern MDB by $111 million/year (2%).
- The value of irrigated production is estimated to decrease the most for rice (9%), and least for almonds (0%) and other horticulture (1%). The largest estimated regional impacts are in the Murrumbidgee (2%) and Murray above the Barmah Choke (2%).
- The change in the value of irrigated production can provide an indication of the potential magnitude of flow on effects to regional communities but is not a reliable measure of the overall impact of buybacks on communities or the costs of water recovery.
| Variable | Baseline scenario (No further recovery) | 125 GL buybacks | 225 GL buybacks | 325 GL buybacks |
|---|---|---|---|---|
| Average water allocation prices ($/ML) | 474 | 498 | 519 | 545 |
| % change in average water allocation prices | 5.0 | 9.5 | 15.0 | |
| Average water use (GL/yr) | 3,748 | 3,675 | 3,616 | 3,571 |
| % change in average water use | -2.0 | -3.5 | -4.7 | |
| Average GVIAP ($b/yr) | 6.87 | 6.81 | 6.76 | 6.72 |
| % change in average GVIAP | -0.9 | -1.6 | -2.2 |
Note: Values reported in $2022–23 dollars. “No further recovery” includes all water recovery as of October 2023, but no additional recovery. Water recovery volumes expressed as long-term average annual yield. GVIAP denotes gross value of irrigated agricultural production.
The Basin Plan was passed in 2012 to improve the sustainability of water management in the Murray–Darling Basin (MDB). This included a target to recover 2,750 GL (long-term average annual yield) of surface water entitlements for the environment. In 2018, the target was changed to 2,075 GL following amendments that introduced a range of measures designed to achieve the same environmental outcomes with less water (DCCEEW 2023a). These measures include the Sustainable Diversion Limit adjustment mechanism (SDLAM) and the Northern Basin Toolkit (DCCEEW 2023b; DCCEEW 2023c). Significant progress has been made against the revised target with only 46 GL remaining (assuming the SDLAM projects are successful).
The focus of this report is an additional target under the Basin Plan to recover a further 450 GL for ‘enhanced environmental outcomes’. This additional recovery was originally intended to be achieved through efficiency measures that have neutral or positive socio-economic impacts, however, only 26 GL have been recovered to date (DCCEEW 2023d). The Water Amendment (Restoring Our Rivers) Bill 2023 provides a number of changes to facilitate recovery towards the 450 GL target, including the option to recover water through voluntary buybacks.
ABARES has been asked by the Department of Climate Change, Energy, the Environment and Water (DCCEEW) to examine the implications for irrigated agriculture of using buybacks to meet outstanding recovery under the 450 GL target.
Ideally, the analysis would provide results for the entire MDB, but this was not possible within the time available. This is because ABARES does not have a model of the northern MDB like the one it has for the southern MDB. Other options were explored to estimate the possible impacts in the north, but no reliable methods were identified within the time available. As a result, the analysis in this report is limited to the southern MDB, where existing models can reliably estimate the impacts of water recovery.
Simple methods have limitations
Estimating the impacts of future water recovery on irrigated agriculture is challenging. The simplest method is to estimate the impacts of past water recovery based on how the variables of interest (water allocation prices, water use and value of irrigated production) changed before and after water recovery rounds. For example, if water allocation prices increased from $300/ML before a water recovery round to $350/ML after a water recovery round, the estimated impact of the water recovery round using this method would be $50/ML. This impact could then be extrapolated to future water recovery, adjusting for the relative size of future and past water recovery. For example, if the future water recovery round was twice the magnitude of the past water recovery round, the estimated impact of the future water recovery round would be $100/ML.
One problem with this method is that the change in water allocation prices could have also been influenced by external factors that occurred at the same time. Perhaps the prices of agricultural commodities increased or water allocations decreased relative to previous irrigation seasons, both of which would increase water allocation prices independently of the water recovery round. In this case, only part of the $50/ML increase would be due to water recovery, resulting in the estimate being misleading.1
Some authors have attempted to address this by using more advanced statistical techniques. For example, Zuo et al. (2019) collected data on external factors and attempted to control for them using a time series regression. However, these external factors are often measured with error and there will inevitably be many other external factors missing from the analysis. These statistical limitations may explain why, counter to economic theory, the authors found no evidence that water recovery influenced water allocation prices. The methods discussed above are like trying to find a needle in a haystack. And just because we haven’t found the needle doesn’t mean it is not there.
1Another problem is that expectations of future water recovery may have been built into the price of water allocations before water recovery.
Our alternative method has been widely adopted
The most common alternative method uses economic theory to identify the impacts of water recovery. The key idea is that water recovery affects the variables of interest through the supply of water. So, instead of statistically estimating the impact of water recovery directly, we can quantify the impact of water recovery indirectly via water supply. This is a two-step process:
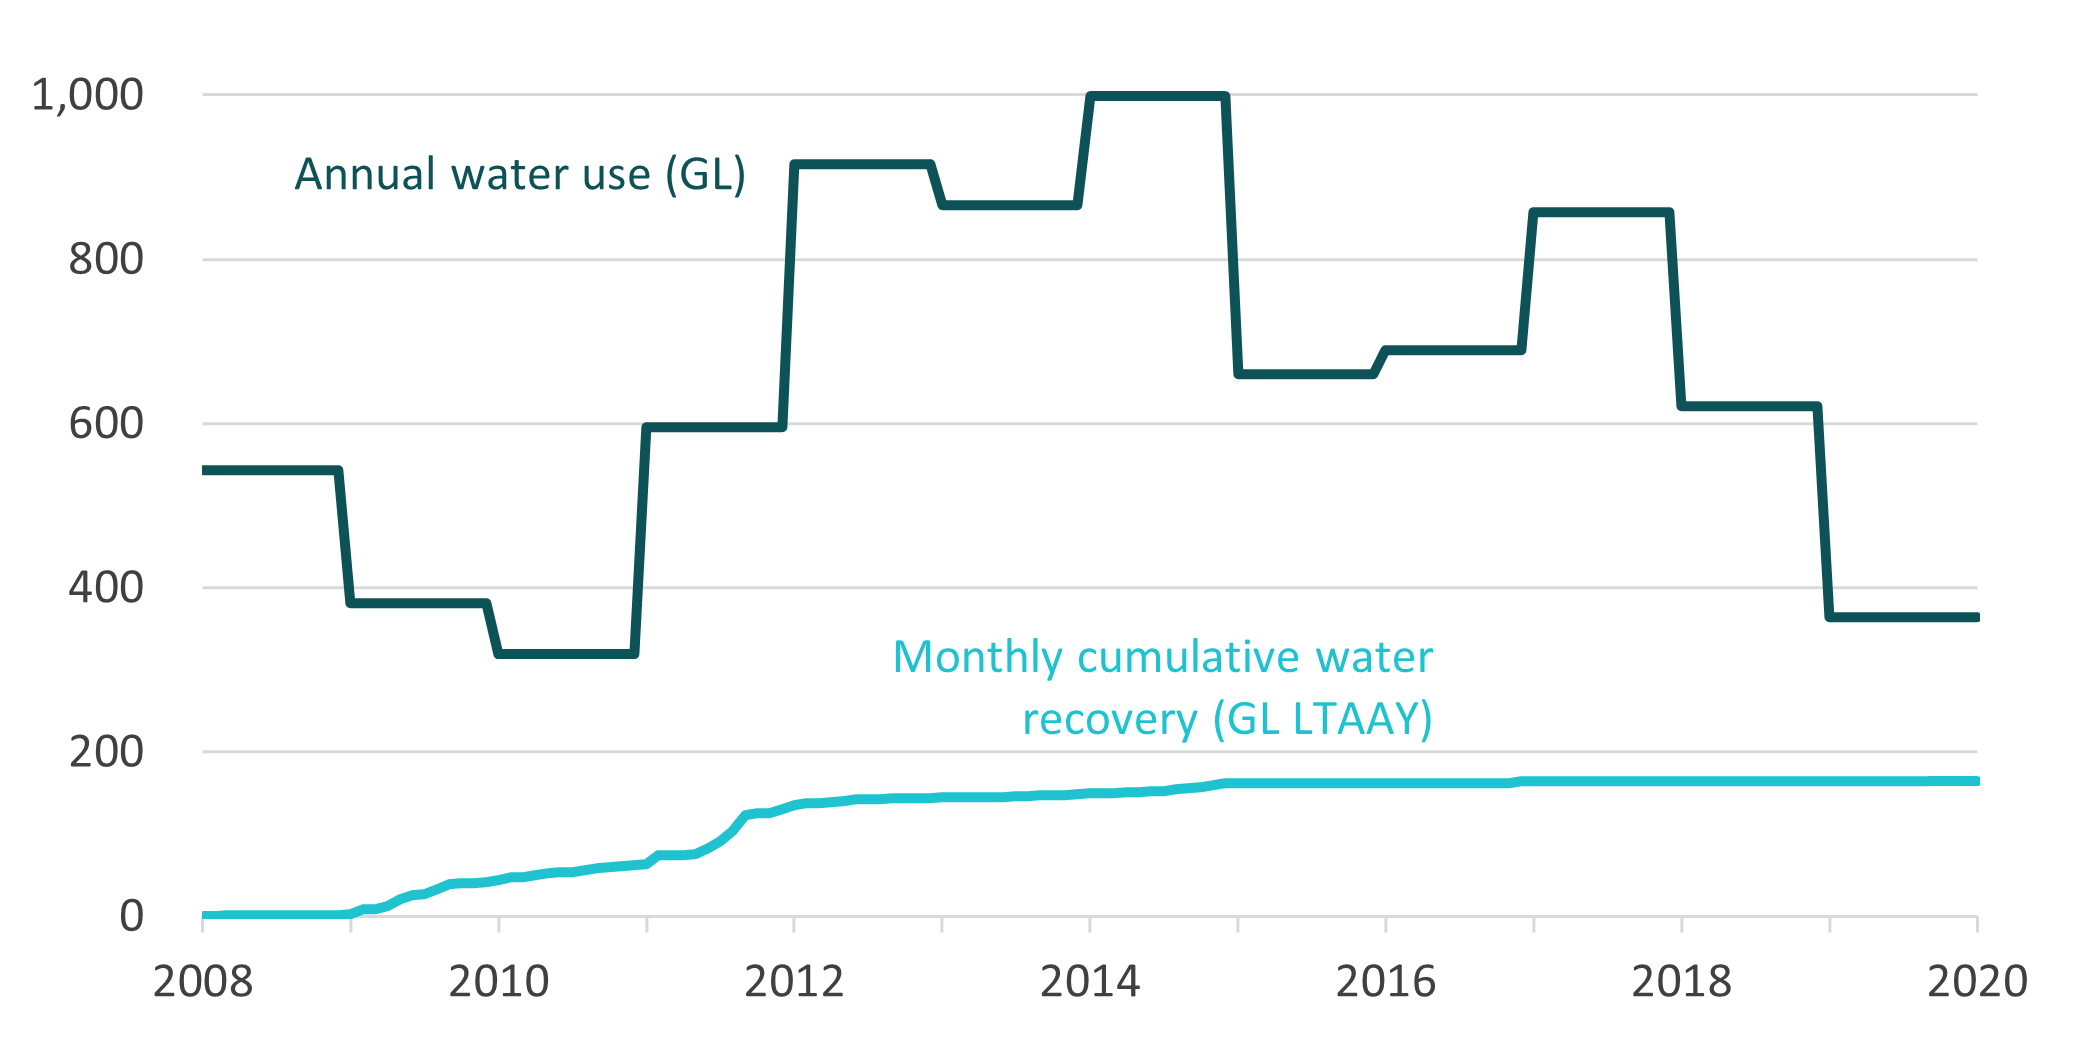
- Step one – Statistically estimate the relationships between water supply and the variables of interest. This relationship is easier to estimate because droughts and floods mean that there is greater variation in water supply (and use) over time than in water recovery (Figure 1). This variation helps to isolate the impact of changes in water supply from external factors such as changes in the prices of agricultural commodities.
- Step two – Simulate water supply scenarios with and without future water recovery. The scenarios have identical assumptions about all other variables (such as the prices of agricultural commodities and water allocations). This means that the differences in the variables of interest between the scenarios can be attributed to future water recovery.
Early examples of this method include Wittwer and Dixon (2011) and Connor et al. (2013). More recent examples that apply more sophisticated techniques include Aither (2020) and Whittle et al. (2020). The rest of this section describes how we have implemented this method, covering the specific model and scenarios applied.
Figure 1: Annual water use data has greater variation than monthly cumulative water recovery data, despite fewer observations.
Source: ABARES water market dataset
ABARES Water Trade Model of the southern MDB
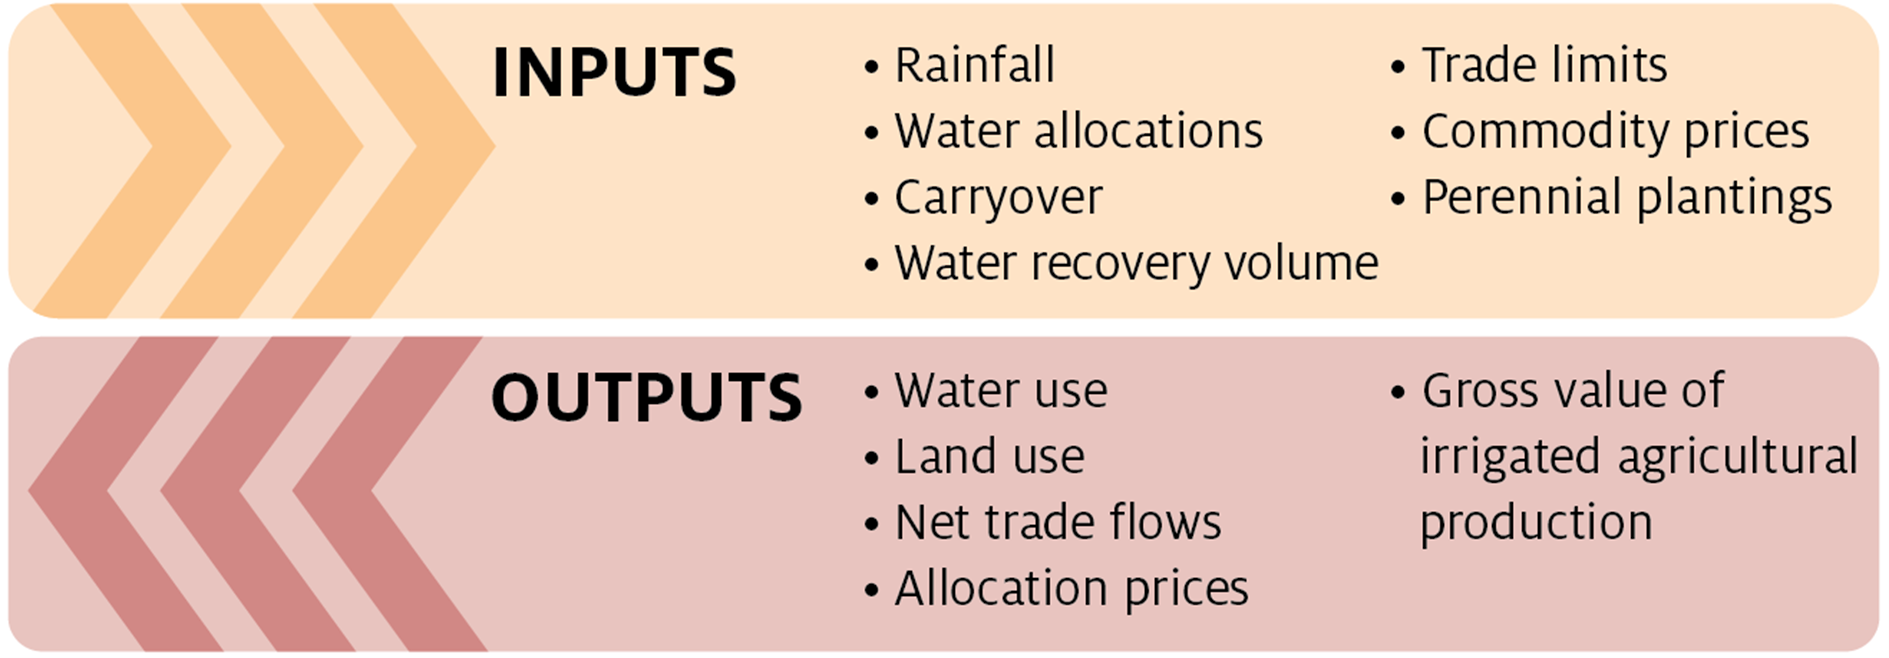
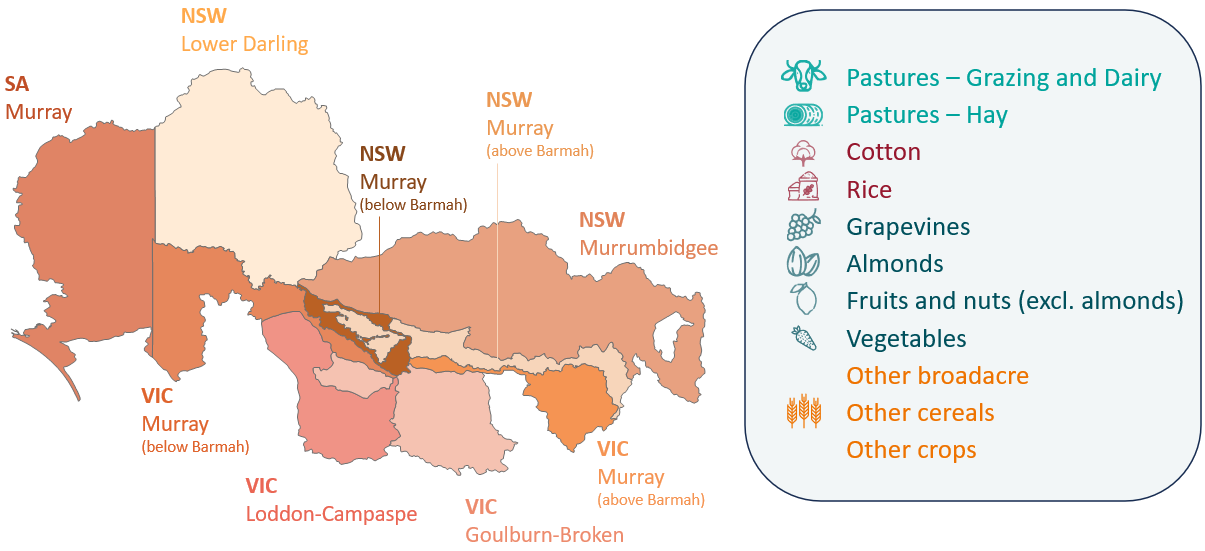
The ABARES Water Trade Model has been progressively developed over time. The current version was estimated using historical data over the period 2000–01 to 2020–21. It takes various inputs, including water recovery, and simulates outputs for irrigated agriculture (Figure 2). The key outputs for this report are water allocation prices, water use and the gross value of irrigated agricultural production. The current version covers 9 catchment regions and 11 irrigation activities (Figure 3).
Figure 2: ABARES Water Trade Model inputs and outputs
Figure 3: ABARES Water Trade Model regions and activities
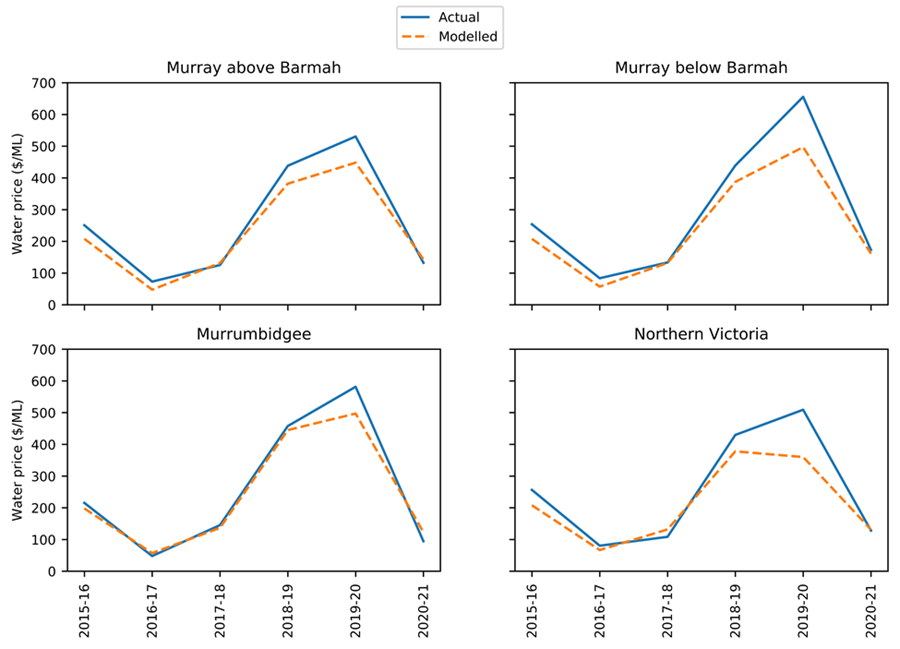
The Water Trade Model has been published in a peer reviewed journal (Hughes et al. 2023) and extensively tested to ensure that it generates reliable predictions. Figure 4 compares predicted water allocation prices from the Water Trade Model with actual water allocation prices, showing high predictive validity.
Full technical documentation of the Water Trade Model and the underlying dataset is available at Hughes et al. (2023).
Figure 4: Actual and modelled annual water allocation prices, 2015–16 to 2020–21
Source: Hughes et al. (2023)
Investigation of northern Basin impacts
ABARES does not have a sophisticated model for the northern MDB like the Water Trade Model for the southern MDB. This is because the water market data that was necessary to build the Water Trade Model for the south is largely unavailable for the north. Developing a model to estimate the impacts of water recovery in the north would be possible but would require different methods and data.
It would be possible to model the impact of water recovery in the northern MDB assuming a simple linear relationship between water use and the value of irrigated production. However, this relationship is unlikely to hold and the approach would tend to overestimate the impact of water recovery. In part, this is because the approach would not account for the relative profitability of irrigation activities. It is likely that irrigators generating lower returns would sell their water to the government before more profitable irrigators. This would lower the overall impact of water recovery on the value of irrigated production.
An alternative could be to take the modelling results for the southern MDB from this report and apply the relationships between changes in water use and the value of irrigated production to the north. However, this has the problem that there are significant differences between the north and the south in terms of the mix of irrigation activities and the ability to trade water between valleys. This could result in the relationships in the north between these variables being very different from the south.
Baseline and water recovery scenarios
This report examines the impact of using buybacks to meet varying proportions of the outstanding recovery in the southern MDB under the 450 GL target for enhanced environmental outcomes. DCCEEW provided three buyback scenarios with recovery volumes of 125 GL, 225 GL, and 325 GL. The recovery scenarios are compared to a baseline scenario with no further water recovery.
All scenarios reflect the current state of irrigated agriculture and the water market in terms of capital investment, technology, commodity prices, as well as water trading and carryover rules. The almond estate is assumed to be fully mature. They also capture all water recovery as of October 2023, including the 10 GL of recent strategic purchases in the NSW Murray and the 26 GL of contracted recovery through efficiency measures.
| Water recovery scenario | Recovery mechanism | Capital investment, technology, commodity prices, and water market rules | Almond estate |
|---|---|---|---|
| No further recovery (0 GL) | Current | 100% maturity | |
| 125 GL | Buybacks | Current | 100% maturity |
| 225 GL | Buybacks | Current | 100% maturity |
| 325 GL | Buybacks | Current | 100% maturity |
Note: “No further recovery” includes all water recovery as of October 2023, but no additional recovery. Water recovery volumes expressed as long-term average annual yield.
Key assumptions
As with all economic models, the ABARES Water Trade Model is an approximation of reality, and it is important to consider the underlying assumptions and limitations of the model when interpreting the results in this report. The model and scenarios make several key assumptions, including:
- The model estimates the short-run impacts of the water recovery scenarios. In particular, farm capital and technology are assumed to be fixed, and horticulture land use is assumed to be fixed at 2021 levels with a fully mature almond estate. In the long run, higher water allocation prices would lead to reduced investment in irrigated agriculture and shifts towards water saving technologies. These adaptations are not captured in the model. This means that the long-run increases in water allocation prices due to water recovery are likely to be smaller than the estimated short-run increases.
- The model simulates future water allocations based on data for the period 2000–01 to 2020–21 (see Hughes et al. (2023) for the technical details). This was a relatively dry period by historical standards. Even with climate change, the future may be wetter than suggested by the model. If so, the reductions in water use due to water recovery are likely to be larger than estimated.
- The model operates on an annual timescale and the estimated water allocation prices in this report are annual averages. In practice, water allocation prices can vary significantly within a year. As such, monthly or daily water prices could be significantly higher or lower than the annual averages estimated by the model.
- In the absence of further information on purchasing strategies, recovery is distributed across regions and entitlement types based on surface water recovery to date. The distribution of water recovery would not matter in a world without trade limits, as trade would equalise prices across regions. But in a system where trade limits are increasingly binding, this assumption has a large bearing on the results. To the extent that we underestimate (overestimate) the extent of water recovery in a region, we will also tend to underestimate (overestimate) all of the impacts of water recovery in that region.
To keep the results description simple, this section focuses on the 225 GL buyback scenario. The relationships between water recovery and the variables of interest are approximately linear for the scenarios modelled. This means, for example, that the impacts of the 125 GL buyback scenario will be roughly 55% of the 225 GL buyback scenario. The full results for the 125 GL and 325 GL buyback scenarios are presented in Appendix A.
Water allocation prices will increase
The Water Trade Model estimates water allocation prices based on water demand and supply, accounting for trade between regions. Under the baseline scenario, without further water recovery, average water allocation prices in the southern MDB are estimated to be $474/ML (Table 1). This is higher than long-term historical prices for three reasons. First, the model accounts for recent increases in water demand, including the expansion of the cotton and almond industries. Second, the model accounts for decreases in water supply due to previous water recovery. The third reason is discussed in the following technical footnote.2
Buybacks reduce the supply of water available for irrigation and in doing so increase water allocation prices. In the 225 GL buyback scenario, average annual water allocation prices are estimated to increase by $45/ML (Table 1). In percentage terms, we are estimating that a 4% reduction in the supply of surface water available for irrigation due to water recovery will increase average annual water allocation prices by 10%. Dividing the percentage increase in prices by the percentage decrease in supply (before rounding) gives an (inverse) elasticity of 2.4. This is a measure of the sensitivity of water allocation prices to water recovery. While there is uncertainty around the precise impacts, the elasticity estimated in the current study is consistent with the literature (Table 3).
| Study | Decrease in supply (water recovery scenario) | Increase in price (estimated) | Elasticity (calculated) |
|---|---|---|---|
| Connor et al. (2013) | 20% | 42% | 2.1 |
| Aither (2020) | 17% | 39% | 2.3 |
| Whittle et al. (2020) | 16% | 44% | 2.8 |
| This report | 4% | 10% | 2.4 |
2The model simulates future water allocations over a 1,000-year sequence. While this sequence is based on water allocations from 2000–01 to 2020–21, it does not simply draw allocations from these years. Instead, the model estimates the statistical properties (mean, variance, and so on) of water allocations from 2000–01 to 2020–21. This statistical distribution is then used to generate the 1,000-year sequence. Because this is a very long sequence, and longer sequences tend to have a wider range of values, the sequence includes some years that are significantly drier than any recent year. Water allocation prices can be extremely high in these years, driving up the average. The sequence also includes some years that are significantly wetter than any recent year, but this has less impact on the average because of the curvature of the demand functions.
Regional water prices
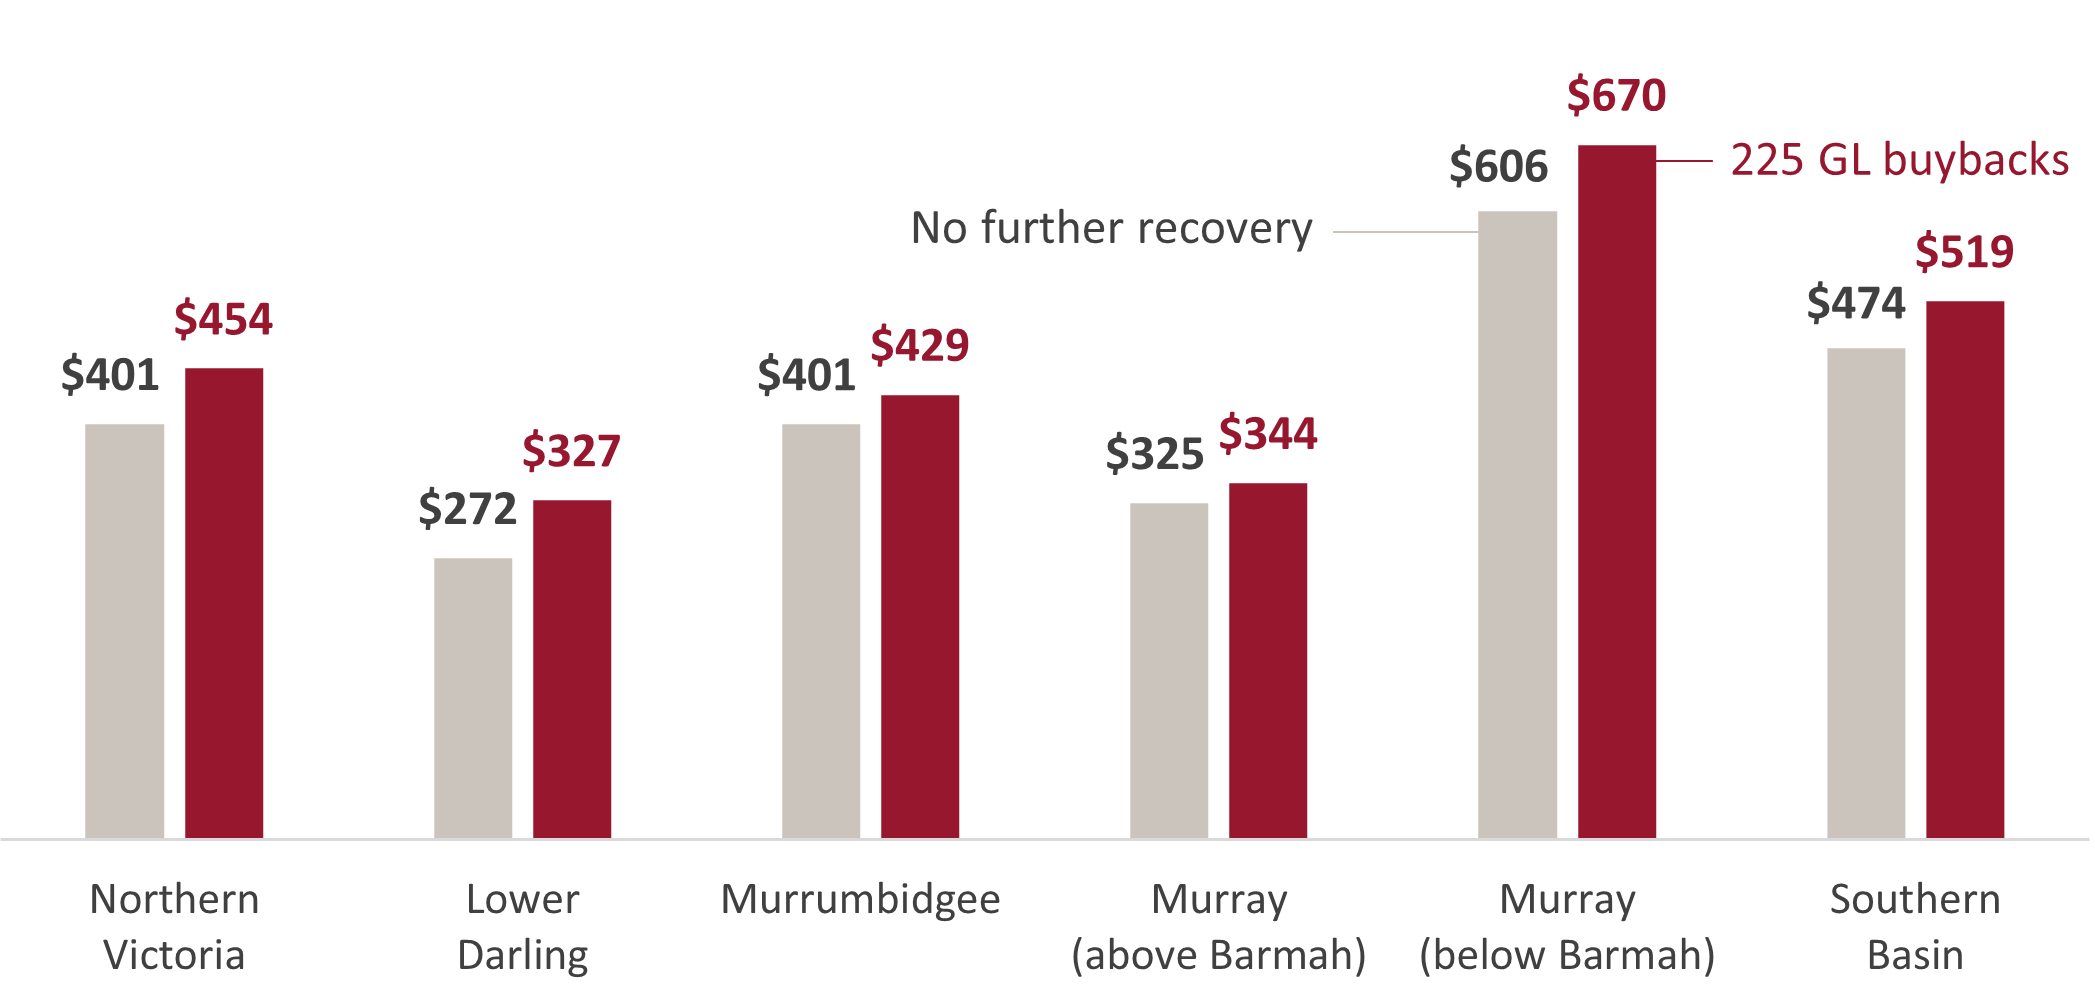
There are significant regional differences in the impacts of the 225 GL buyback scenario on average annual water allocation prices (Figure 5). There are three main reasons for this result:
- First, the regional impacts are partly influenced by the assumed distribution of water recovery across the southern MDB, which as mentioned above, was based on water recovery to date. The percentage of available water recovered in the Murrumbidgee is lower than in many other southern MDB regions. This is one reason why the estimated change in water allocation prices is smaller in the Murrumbidgee ($28/ML or 7%) than most other southern MDB regions (Figure 6). This may not hold if the pattern of future water recovery differs from the past.
- Second, the regional differences also depend on the composition of irrigated agriculture in each region and the relative sensitivity of these industries to changes in water allocation prices. Some industries, particularly annual irrigation activities like rice and pastures, are more sensitive to changes in water allocation prices. Regions with a higher concentration of these industries will tend to experience smaller price impacts from water recovery. Formally, this is because the larger demand response means that prices do not need to increase as much to bring demand back into equilibrium with supply. A clear example of this can be seen in the difference between the Murray regions above and below the Barmah Choke. In the Murray above the Barmah Choke, where there is a relatively high concentration of annual irrigation activities, the estimated change in average annual water allocation prices is $19/ML (or 6%). By contrast, in the Murray below the Barmah Choke, which is dominated by perennial irrigation activities, the estimated change in average annual water allocation prices is $64/ML (or 11%).
- Third, the regional differences are also driven by inter-regional trade limits (such as the Barmah Choke trade rule) (MDBA 2023). Without inter-regional trade limits, water allocations would be freely traded between regions and prices would equalise. Trade limits restrict the volume of water that can be traded between regions, leading to price differences (given the differences in supply and demand outlined above). Trade limits are binding more often in the water recovery scenarios.
In terms of the economic implications, higher water allocation prices are not necessarily good or bad for irrigators in aggregate (Boardman et al. 2018). They have distributional consequences, being good for irrigators who are sellers of water allocations and bad for irrigators who are buyers. This depends in part on the ownership of entitlements. For example, irrigators who rely on markets to purchase water allocations will likely be worse off.
Figure 5: Average annual water allocation prices, by region ($/ML)
Figure 6: Change in average annual water allocation prices, by region
Water use will decrease
As water allocation prices increase, the Water Trade Model reduces the area of land irrigated and the volume of water applied per hectare irrigated, both of which reduce water use. In the 225 GL buyback scenario, average annual water use across the southern MDB is estimated to decrease by 133 GL (or 4%) (Table 1). This and all other water use estimates in this subsection include both surface and groundwater.
The modelled decrease (133 GL) is less than 225 GL for several reasons:
- First, the volume recovered is based on standard long-term average annual yield calculations. That is, the average volume of allocations that would have been received from the entitlements recovered under historical conditions (1895 to 2009). As mentioned above, the model simulates future water allocations based on recent conditions (2000–01 to 2020–21). This was a relatively dry period by historical standards. This means that the volume of allocations that would have been received from the entitlements recovered will be lower under modelled conditions than under historical conditions. This explains just under half of the gap between the modelled decrease and 225 GL.
- Second, as water allocation prices increase the supply of water from other sources such as groundwater increases. We assume that the past relationship between water allocation prices and the supply of water from other sources holds in the future. The additional supply of water from other sources partially offsets the impact of the reduction in surface water allocations due to water recovery. This explains just under half of the gap between the modelled decrease and 225 GL.
- Third, as water allocation prices increase due to water recovery, the incentives for irrigators to carry over water change. The model estimates a reduction in the average volume of carryover by irrigators, which leads to a reduction in water losses from dam spills and evaporation. This explains the remainder of the gap between the modelled decrease and 225 GL.
Industry water use
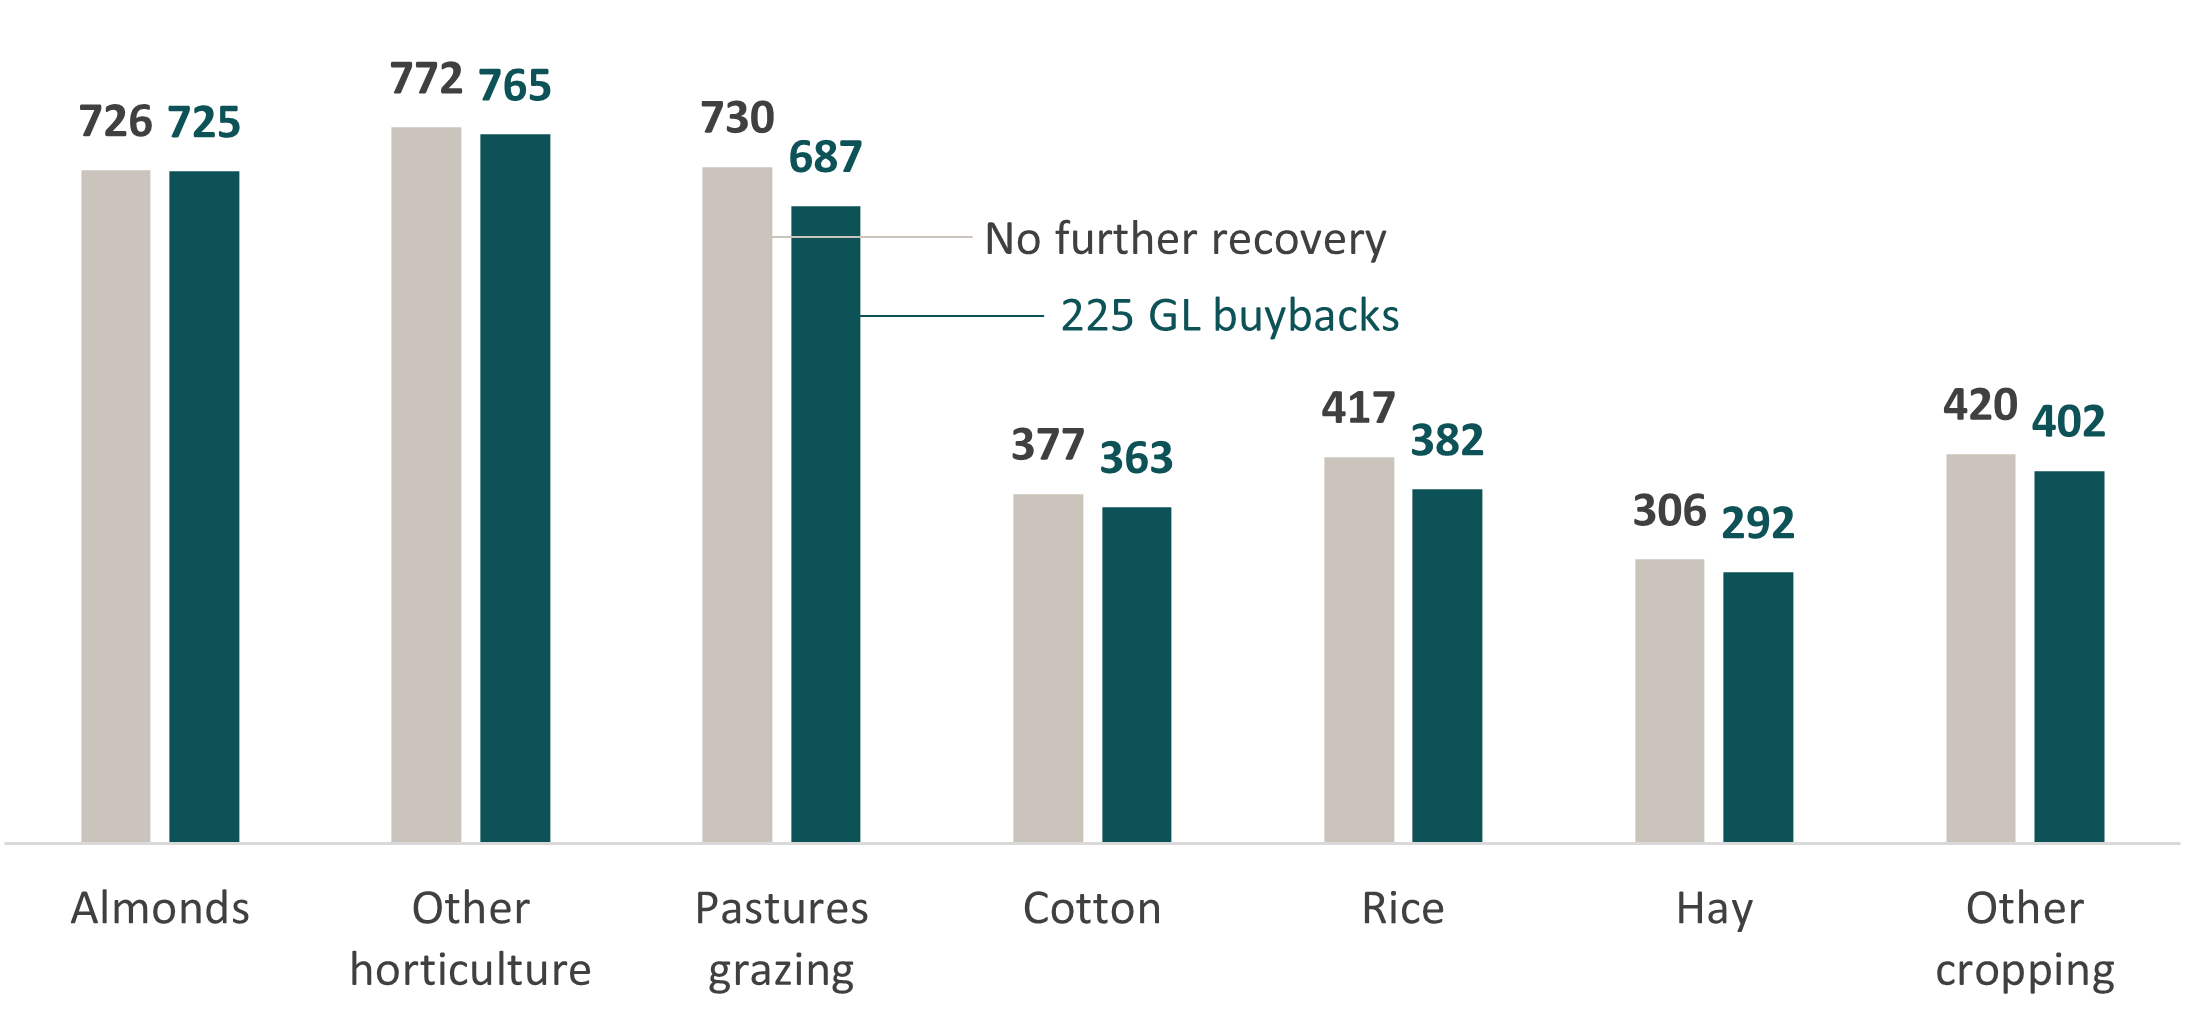
There are large industry differences in the impacts of the 225 GL buyback scenario on average annual water use (Figure 7). The reduction in water use depends in part on the increases in water allocation prices in the regions where each industry is located. It also depends on the sensitivities of each industry to changes in water allocation prices. As mentioned above, some industries are more sensitive to changes in water allocation prices. This explains why average annual water use is estimated to fall most for rice (35 GL/year or 8%) and pastures (42 GL/year or 6%) (Figure 8). By contrast, average annual water use is estimated to decrease the least for almonds (1 GL/year or 0.2%) and other horticulture (8 GL/year or 1%).
Our model assumes that land use for horticulture is fixed at 2021 levels. While this assumption is plausible in the short term, increased water allocation prices will reduce the profitability of maintaining existing plantings and establishing new plantings, leading to a possible reduction in horticulture area over the long term. Hence, the change in average annual water use for horticulture could be larger than estimated, especially in the long term.
Figure 7: Average annual water use, by industry (GL)
Figure 8: Change in average annual water use, by industry
Regional water use
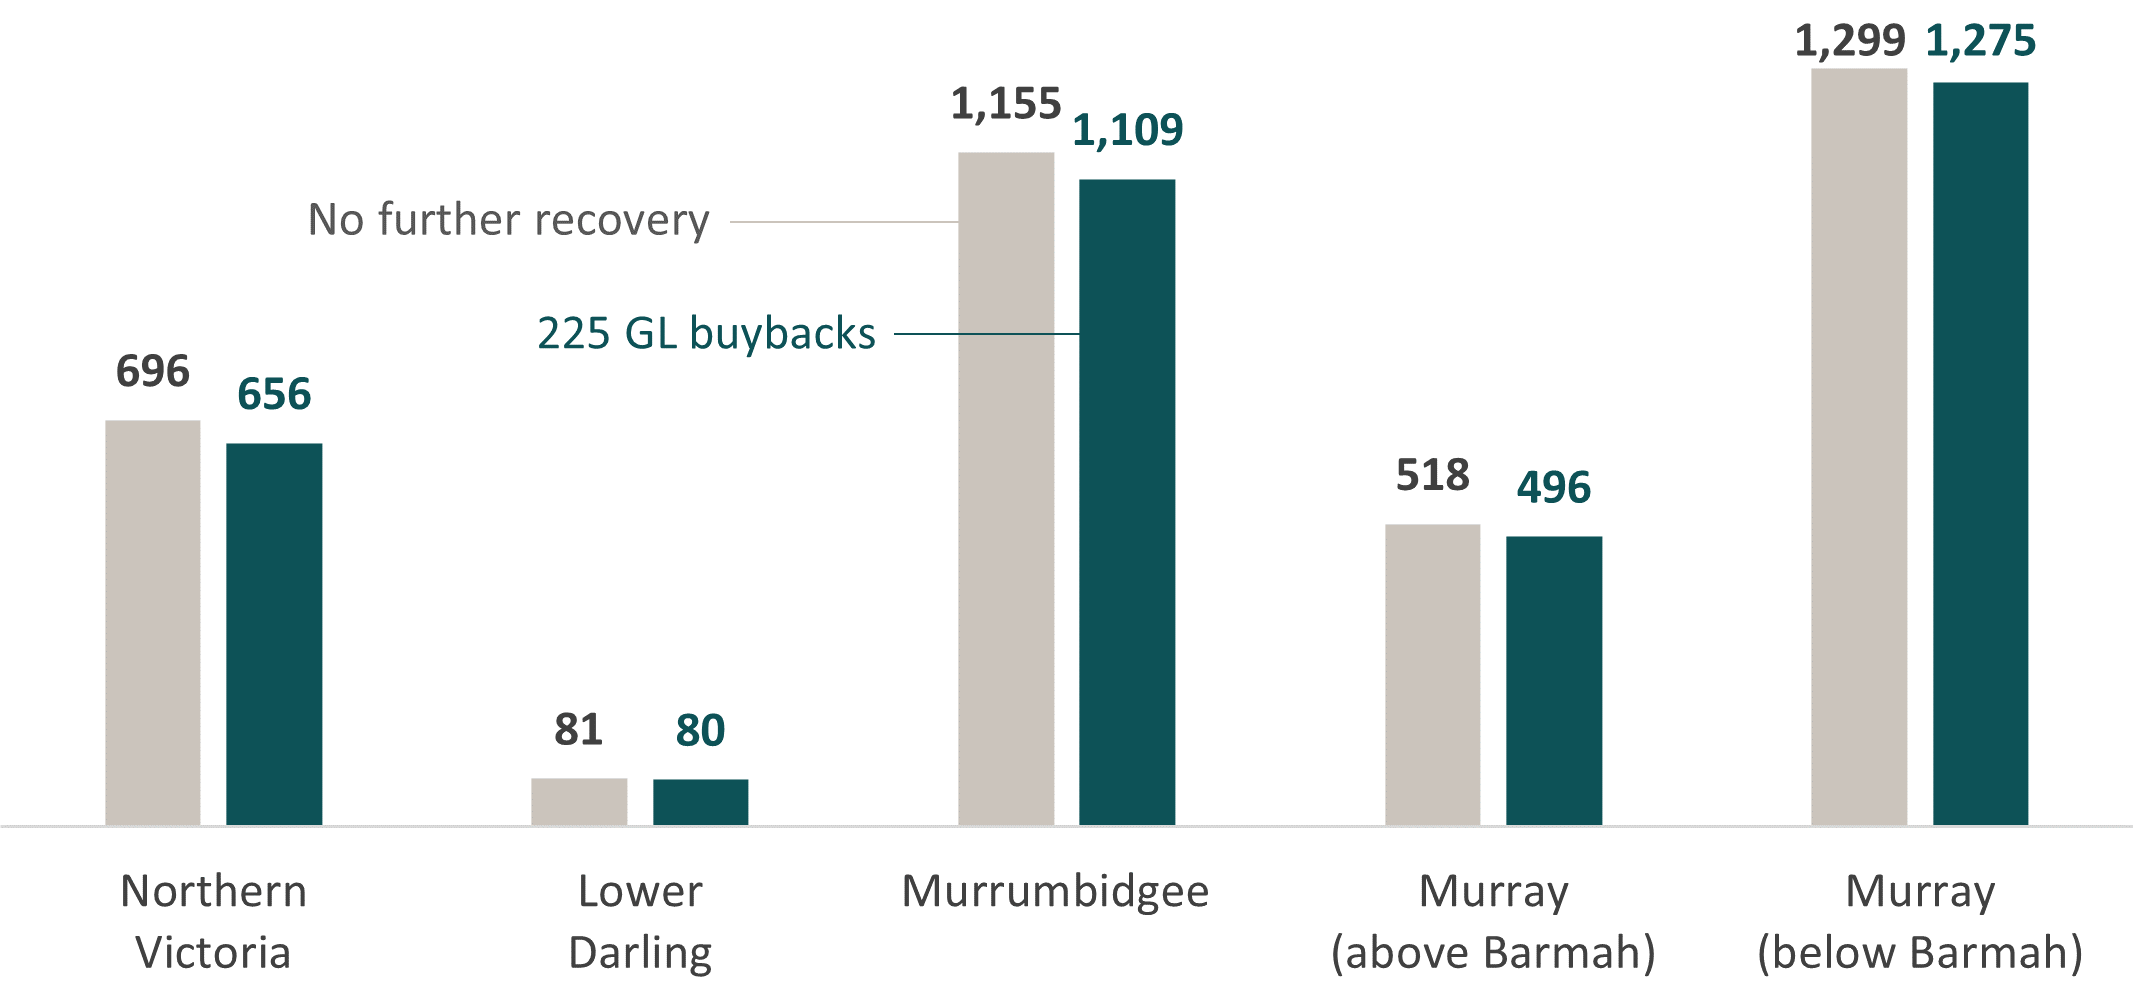
From a regional perspective, the largest estimated reduction in average annual water use occurs in Northern Victoria (39 GL/year or 6%) (Figure 9). This is because of the relatively large increase in water allocation prices in Northern Victoria combined with the high share of pastures. In percentage terms, the smallest estimated reduction occurs in the Murray below the Barmah Choke (24 GL/year or 2%) (Figure 10). This is due to the dominance of perennial irrigation activities.
Figure 9: Average annual water use, by region (GL)
Figure 10: Change in average annual water use, by region
Production value will decrease
The previous subsection discusses how the Water Trade Model responds to higher water allocation prices by reducing the area of land irrigated and the volume of water applied per hectare irrigated. Since land and water are key production inputs, these adjustments will also decrease the gross value of irrigated agricultural production. In the 225 GL buyback scenario, the average value of irrigated production is estimated to decrease across the southern MDB by $111 million/year (2%) (Table 1).
The estimated percentage reduction in the value of irrigated production across the southern MDB is smaller than the estimated percentage reduction in water use (4%) for two main reasons:
- First, output per hectare tends to increase with water applied per hectare, but at a decreasing rate. For example, the first ML of water applied per hectare might generate 3 t/ha of yield. The second ML might increase yield by 2 t/ha and the third ML might increase yield by 1 to/ha. This relationship means that output per hectare tends to fall less than water applied per hectare, in percentage terms. In the example, decreasing the water applied per hectare by one third (from 3 ML to 2 ML) would only reduce output per hectare by one sixth (from 6 t/ha to 5 t/ha).
- Second, the reduction in water use will generally come from irrigators who generate the least profit from their water. These irrigators are more likely to sell water through buybacks (or subsequently trade water to successful buyback participants). While this is complicated by costs, the irrigators who generate the least profit from their water also tend to generate less revenue from their water than average. It follows that, across irrigators, the estimated percentage reduction in the value of irrigated production will typically be smaller than the estimated percentage reduction in water use.
Reductions in the value of irrigated production in the buyback scenarios are likely to be at least partially offset by an increase in dryland production as farmers shift from irrigated agriculture to dryland agriculture. This is not included in the modelled results presented in this report.
Industry production value
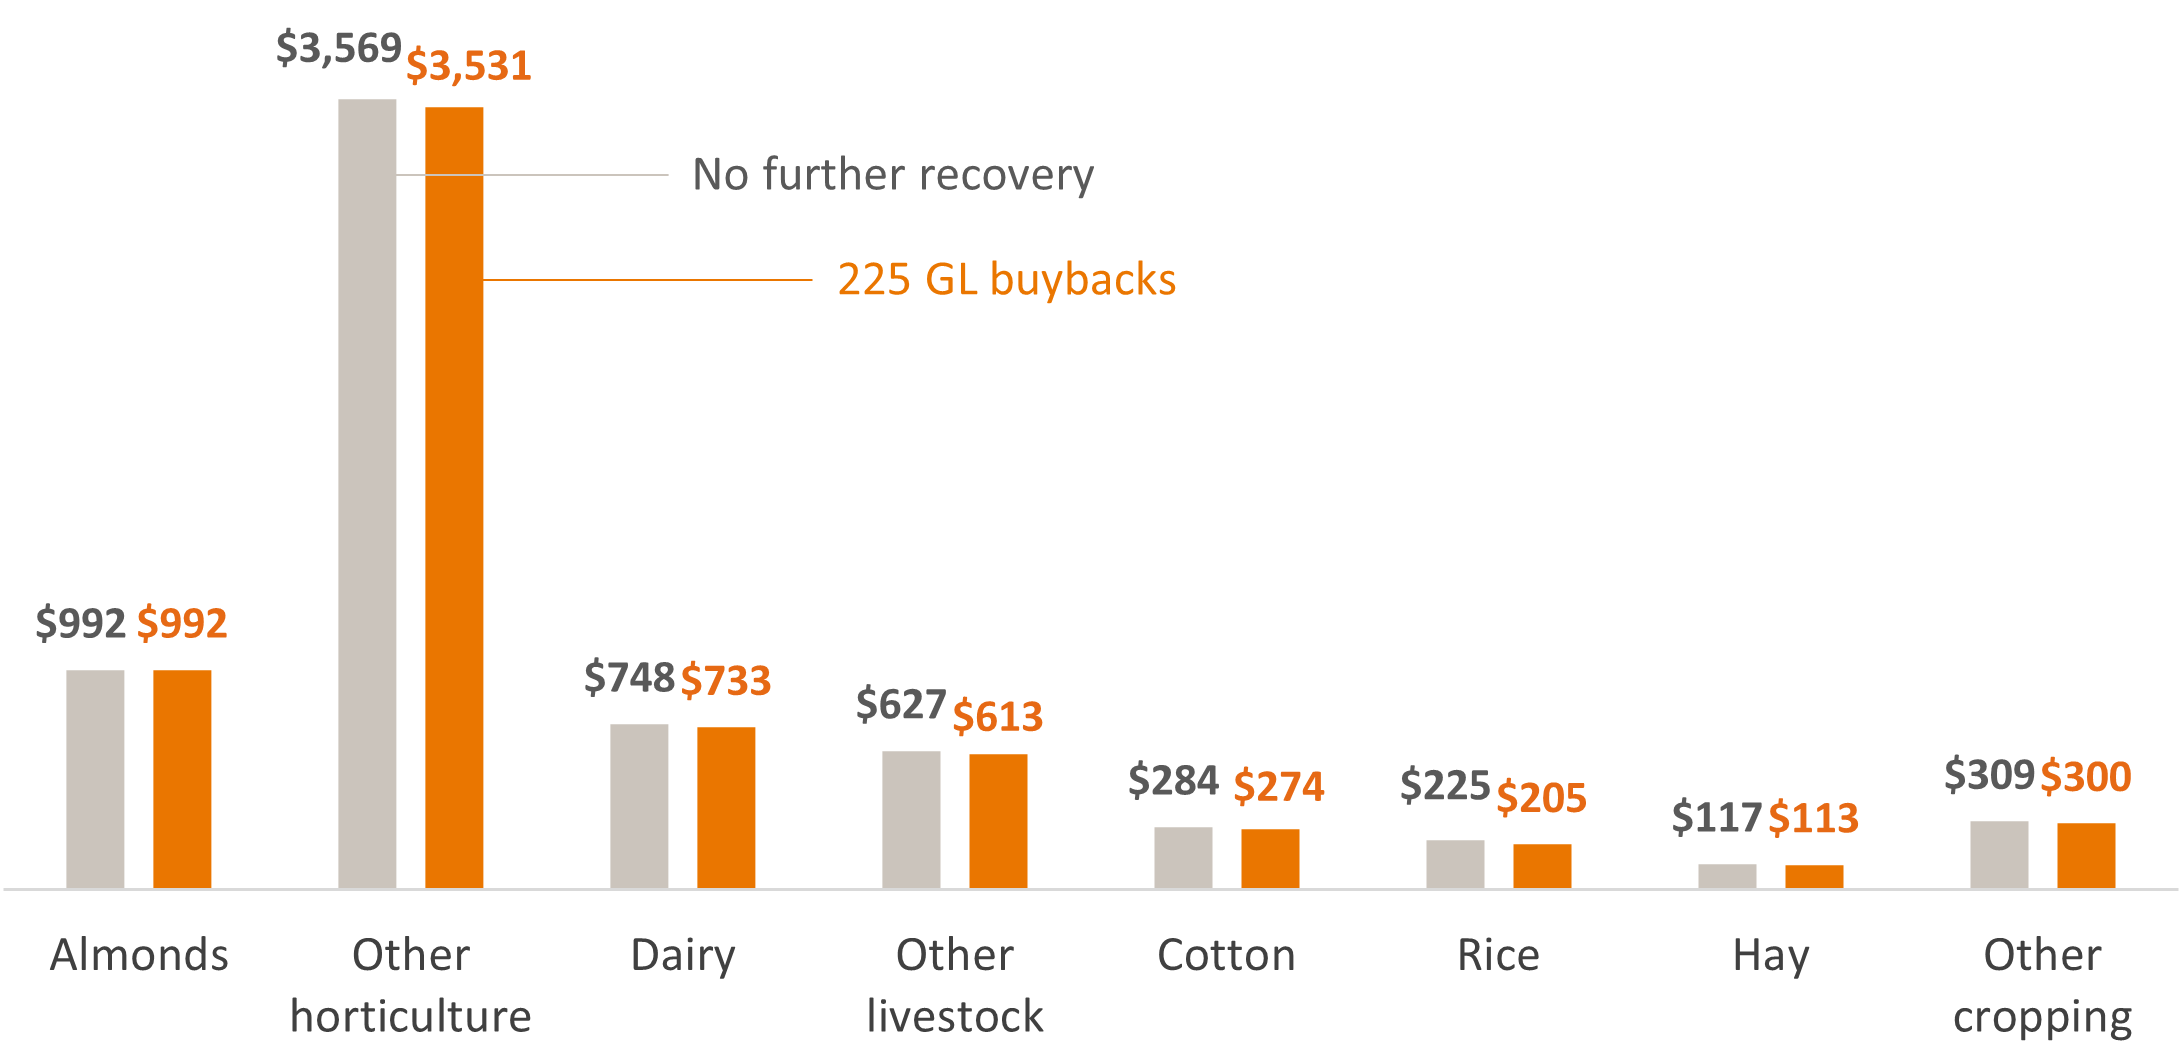
In percentage terms, the estimated reductions in the average value of irrigated production across industries under the 225 GL buyback scenario are generally consistent with the estimated reductions in water use (Figure 11). Annual irrigation activities tend to be most affected. In particular, the average value of irrigated rice production is estimated to fall by 9% ($20 million/year) (Figure 12). By contrast, the average value of irrigated production is estimated to decrease least for almonds (0%) and other horticulture (1% or $38 million/year). Other horticulture experiences the largest impacts in dollar terms because the industry is so large that even small percentage changes translate into large dollar changes.
As with water use, the change in the average value of irrigated production for horticulture could be larger than estimated, especially in the long run. As mentioned above, the model assumes that land use for horticulture is fixed at 2021 levels. In addition, the model was not able to detect robust changes in almond output per hectare irrigated in response to changes in water allocation prices. This explains why the average value of irrigated almond production does not change between the baseline and the 225 GL buyback scenario, even though the volume of water applied per hectare irrigated decreases slightly. In practice, we would expect the 225 GL buyback scenario to decrease the output per hectare irrigated for almonds slightly.
Figure 11: Average annual gross value of irrigated agricultural production, by industry ($m)
Figure 12: Change in average gross value of irrigated agricultural production, by industry
In the initial model results, the estimated change in the value of irrigated dairy production decreased by less than 1%. The initial results for dairy were based on two estimated relationships using historical data. First, the impact of water allocation prices on output per cow and second, the impact of water allocation prices on dairy herd size. These two factors combined led to an estimate of the change in dairy production.
The model detects a relationship between water allocation prices and output per cow. That is, as water allocation prices rise output per cow reduces, presumably because the associated lower water use by irrigators reduces pasture growth and therefore yield per cow. Unfortunately, the model was not able to detect robust changes in dairy herd size in response to changes in water allocation prices. While in the short term irrigators are likely to be able to mitigate the impact of higher water allocation prices on dairy herd size by increasing purchased feed, our expectation is that in reality many irrigators would respond to higher water allocation prices by reducing their dairy herd size. It is likely the impact of external factors has made it difficult to isolate this relationship in the historic data.
Because of this we are concerned the initial model results underestimate the impact of higher water allocation prices on dairy production. Therefore, we have used the regional percentage change in production value from the most similar alternative industry, other livestock, as representative of the impact on irrigated dairy. This means that the value of irrigated dairy production is assumed to decrease by 2% across the southern MDB. Given differences between dairy and other livestock, there is additional uncertainty around our estimates for dairy (and dairy regions).
Regional production value
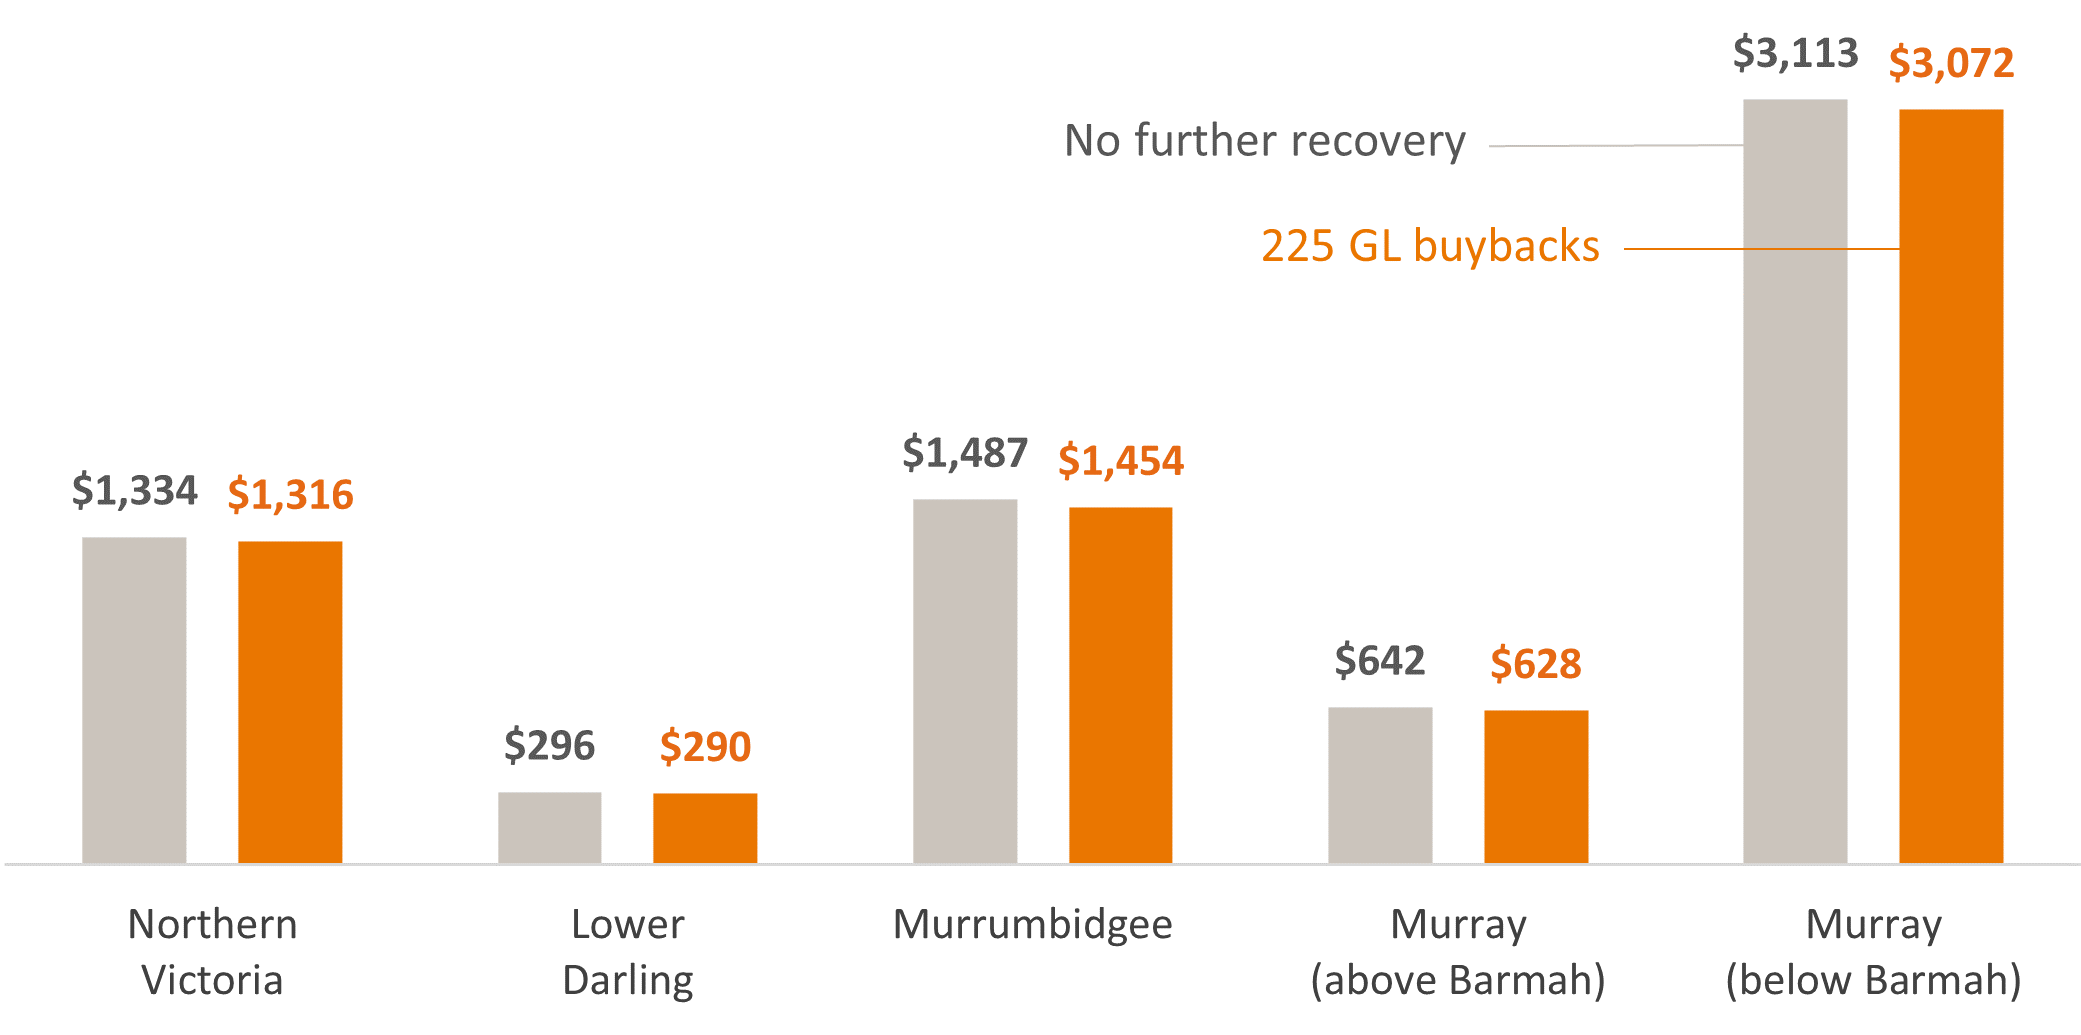
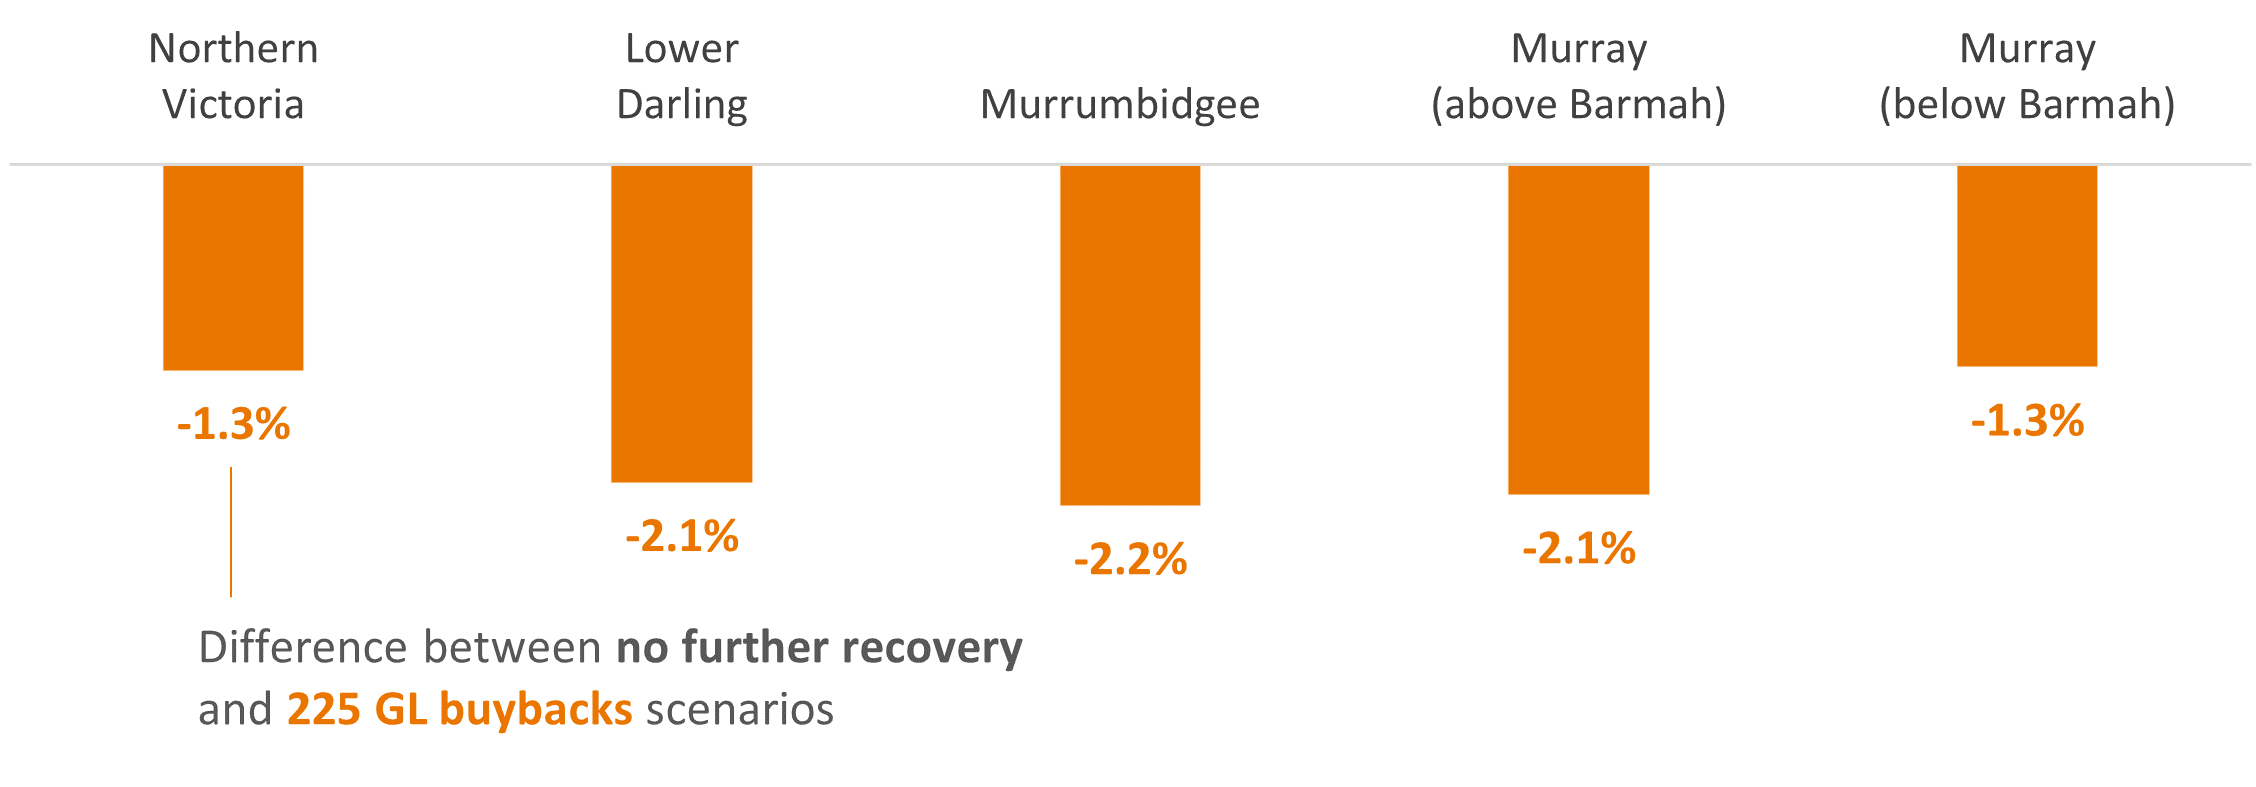
The regional impacts on the value of irrigated production are heavily influenced by the composition of industries within the region (Figure 13). In percentage terms, the largest estimated impacts3 are in the Murrumbidgee (2% or $33 million/year) and Murray above the Barmah Choke (2% or $14 million/year) (Figure 14). These regions have a relatively high share of annual irrigation activities, including rice. The smallest estimated impacts are in the Murray below the Barmah Choke (1% or $41 million/year) and Northern Victoria (1% or $18 million/year). These regions have a relatively high share of perennial irrigation activities, and in the case of Northern Victoria, dairy and other livestock.
In terms of the economic implications, the value of irrigated agricultural production can provide an indication of the potential magnitude of flow on effects to regional communities. However, like changes in water allocation prices, these flow on effects are nuanced. For example, the closure of a local processing facility due to reduced agricultural production might be bad for the affected community. But over time most of the resources (labour, capital and so on) that would have been needed to support the local processing facility would move towards other industries within the same community or other communities. This would potentially offset some of the impacts on the affected community and might be good for other communities. These possible flow on impacts have not been assessed in this report.
In addition, the decrease in the value of irrigated agriculture production is not a good measure of the cost of water recovery since it only considers how irrigated agriculture revenue changes, ignoring how irrigated agricultural cost changes. The market value of entitlements purchased is a more reliable measure.
Figure 13: Average annual gross value of irrigated agricultural production, by region ($m)
Figure 14: Change in average gross value of irrigated agricultural production, by region
3Excluding the Lower Darling. Estimates for the Lower Darling are less reliable but have been included in the figures and tables for completeness.
This report includes an appendix:
- Appendix A: Additional tables – pages 17 to 20 in the downloadable version of the report.
Aither 2020, Southern Murray–Darling Basin water market: Trends, drivers and implications for Victoria, Aither report prepared for Victorian Government Department of Environment, Land, Water and Planning, Melbourne, accessed 30 September 2023.
Boardman, AE, Greenberg, DH, Aidan, RV, Fraser, S & Weimer, DL 2018, Cost-benefit analysis: concepts and practice, 5th ed, Cambridge University Press, Cambridge.
Connor, JD, Franklin, B, Loch, A, Kirby, M & Wheeler, SA 2013, Trading water to improve environmental flow outcomes, Water Resources Research, vol. 49, no. 7, pp. 4265-4276. DOI: 10.1002/wrcr.20323, accessed 1 October 2023.
DCCEEW 2023a, Progress on the Murray–Darling Basin water recovery, Department of Climate Change, Energy, the Environment and Water, Canberra, accessed 4 October 2023.
DCCEEW 2023b, Sustainable Diversion Limit adjustment mechanism and its implementation, Department of Climate Change, Energy, the Environment and Water, Canberra, accessed 4 October 2023.
DCCEEW 2023c, Northern Basin Toolkit, Department of Climate Change, Energy, the Environment and Water, Canberra, accessed 4 October 2023.
DCCEEW 2023d, Efficiency measures, Department of Climate Change, Energy, the Environment and Water, Canberra, accessed 7 October 2023.
Hughes, N, Gupta, M, Whittle, L & Westwood, T 2023, An economic model of spatial and temporal water trade in the Australian southern Murray–Darling Basin, Water Resources Research, vol. 59, no 4, DOI: 10.1029/2022WR032559, accessed 29 September 2023.
MDBA 2023, Barmah Choke trade rule, Murray–Darling Basin Authority, Canberra, accessed 17 October 2023.
Whittle, L, Galeano, D, Hughes, N, Gupta, M, Legg, P, Westwood T, Jackson T & Hatfield-Dodds S 2020, Economic effects of water recovery in the Murray–Darling Basin, Australian Bureau of Agricultural and Resource Economics and Sciences, Canberra, accessed 10 September 2023.
Wittwer, G & Dixon, P 2011, Water trading, buybacks and drought in the Murray–Darling basin: lessons from economic modelling, Centre of Policy Studies, accessed 21 September 2023.
Zuo, A, Qiu, F & Wheeler, SA 2019, Examining volatility dynamics, spillovers and government water recovery in Murray-Darling Basin water markets, Resource and Energy Economics, vol. 58, p. 101113.
Download the report
The impacts of further water recovery in the southern Murray–Darling Basin (PDF 868 KB)
The impacts of further water recovery in the southern Murray–Darling Basin (DOCX 2.03 MB)
The impacts of further water recovery in the southern Murray–Darling Basin - Annex Nov 2024 (PDF 227 KB)
The impacts of further water recovery in the southern Murray–Darling Basin - Annex Nov 2024 (DOCX 725 KB)
If you have difficulty accessing these files, visit web accessibility for assistance.

