
Authors: John Walsh, Tim Westwood and Mihir Gupta
Data download
Demand tables – Murray-Darling Basin Water Market Catchment Dataset 2021 – XLSX [577 KB]
Supply tables – Murray-Darling Basin Water Market Catchment Dataset 2021 – XLSX [128 KB]
The MDB water market catchment dataset is a comprehensive dataset detailing both supply and demand factors across the Murray Darling Basin (MDB). The dataset is used by ABARES for research and modelling objectives, and underpins the ABARES Water Trade Model. The dataset has been made available as part of best practice research methodology, and to provide transparency into ABARES modelling. The dataset will also support additional research by other users.
The dataset has been designed with a research objective in mind with assumptions and adjustments made to support that goal, which may not align with a reporting objective. The dataset provides consistent timeseries for key variables across the MDB with certain assumptions made to preserve the timeseries characteristic of the data.
ABARES has worked with colleagues in the Australian Bureau of Statistics (ABS), Bureau of Meteorology (BOM), Murray-Darling Basin Authority (MDBA) and each of the state water agencies to compile a unique and comprehensive dataset detailing water availability, market outcomes, irrigation activity, climatic conditions and commodity prices for a consistent set of catchment regions in the MDB.
The MDB water market catchment dataset includes a water supply file and an irrigation activity file. To supplement the datasets, metadata that describes each variable, sources and other salient information is also provided. This report provides a summary of the scope and coverage, and the methods used to construct the data.
ABARES is continually improving the quality and scope of the MDB water market catchment dataset. While extensive care has been exercised in preparing this dataset, it remains subject to further refinement in the future, particularly where data has been estimated or imputed.
Data visualisation
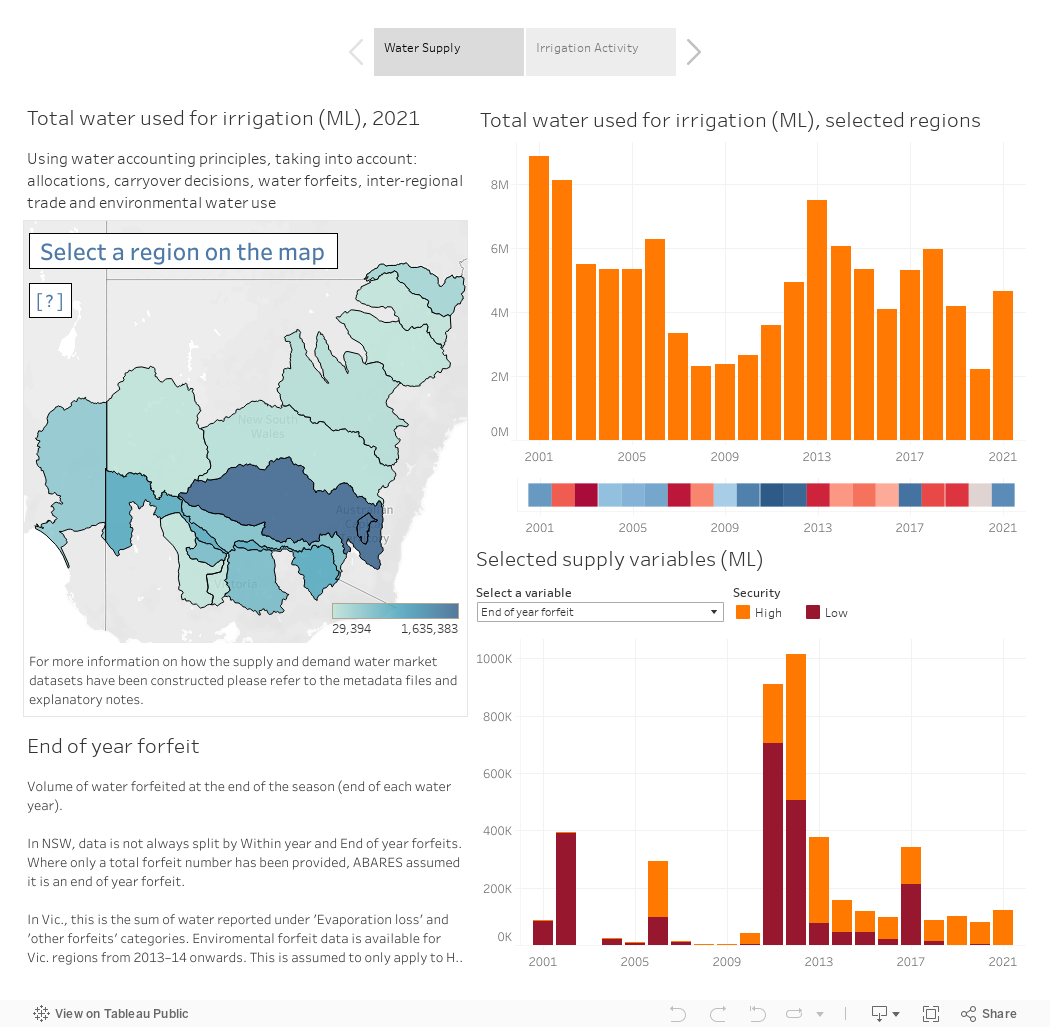
Source: ABARES
The Tableau dashboard may not meet accessibility requirements. For information about the contents of these dashboards contact ABARES.
The MDB water market catchment dataset covers the period of July 2000 to June 2021 and includes catchment regions in the MDB. The MDB is split into northern (nMDB) and southern (sMDB). The nMDB covers QLD and northern NSW, while the sMDB covers southern NSW, ACT, Vic. and SA.
In preparing the data, ABARES focussed on providing consistent time series data for key catchments and irrigation activities in the basin. Supply data has been collected for all MDB regions in NSW, Vic. and SA, but was not collected for QLD regions. Irrigation activity data has been compiled for all catchments within the basin.
The list of regions in the Basin is outlined in Table 1, as well as if they are included in the demand and supply dataset.
| Region | MDB | Dataset |
|---|---|---|
| NSW Barwon Darling | nMDB | Irrigation activity |
| NSW Border Rivers | nMDB | Irrigation activity, Supply |
| NSW Gwydir | nMDB | Irrigation activity, Supply |
| NSW Lachlan | nMDB | Irrigation activity, Supply |
| NSW Macquarie-Castlereagh | nMDB | Irrigation activity, Supply |
| NSW Namoi | nMDB | Irrigation activity, Supply |
| QLD Border Rivers | nMDB | Irrigation activity |
| QLD Condamine-Balonne | nMDB | Irrigation activity |
| QLD Moonie | nMDB | Irrigation activity |
| QLD Warrego-Paroo | nMDB | Irrigation activity |
| ACT | sMDB | Irrigation activity |
| NSW Lower Darling | sMDB | Irrigation activity, Supply |
| Eastern Mt Lofty | sMDB | Irrigation activity |
| NSW Murray Above (Above Barmah Choke) | sMDB | Irrigation activity, Supply |
| NSW Murray Below (Below Barmah Choke) | sMDB | Irrigation activity, Supply |
| NSW Murrumbidgee | sMDB | Irrigation activity, Supply |
| SA Adelaide and Mt Lofty | sMDB | Irrigation activity |
| SA Murray | sMDB | Irrigation activity, Supply |
| VIC Goulburn-Broken | sMDB | Irrigation activity, Supply |
| VIC Loddon-Campaspe | sMDB | Irrigation activity, Supply |
| VIC Murray Above (Above Barmah Choke) | sMDB | Irrigation activity, Supply |
| VIC Murray Below (Below Barmah Choke) | sMDB | Irrigation activity, Supply |
| VIC Ovens | sMDB | Irrigation activity |
| VIC Werribee | sMDB | Irrigation activity |
Source: ABARES
The MDB water market catchment dataset offers several improvements over previous datasets released by ABARES. For example, the supply file includes additional variables, such as forfeited water (split by during year, and end of year), which allows for more accurate estimations of total water supply. The irrigation activity file provides a time series of catchment level data, which is the result of close collaboration with the ABS.
The construction of the MDB water market catchment dataset involved considerable effort, given the large number of data sources and various inconsistencies between them. A number of data imputations, assumptions and regression estimations were required, in addition to filling gaps through external data sources in order to generate time series data for a consistent set of regional and industry definitions.
The MDB water market catchment dataset draws from various sources, which are further detailed in the metadata spreadsheets accompanying this product. The construction of rainfall, commodity prices, allocations and carryover volume variables use the same methods as detailed in Gupta et al. 2018. All deflation adjustments use the Consumer Price Index as reported by the ABS (ABS 2021a).
Irrigation activity
The irrigation activity dataset has been split into an ‘area and water use’ dataset and a ‘production and value’ dataset due to differences in the scope of the underlying data. Each of the variables included in the irrigation activity datasets is listed in Table 2 and Table 3.
The area and water use dataset has been built from unit-record data collected through various agricultural censuses and surveys and provides irrigation activity data for catchment regions between 2010–11 and 2017–18. For the period 2005–06 to 2010–11 and from 2018–19 onwards, ABARES apportioned Natural Resource Management (NRM) level data to catchment regions, using methods previously described in Gupta et al. 2018. The apportioning method was further calibrated using data sourced from the ABS for 2010–11 to 2012–13.
| Variable | Description | Units |
|---|---|---|
| Area watered | Area of irrigation by region and industry | Ha |
| L_meta | Metadata for Area_watered | Value |
| Volume applied | Volume of irrigated water applied | ML |
| W_meta | Metadata for Volume_applied | Value |
| Tree_br | Number of bearing almond trees | No. |
| Tree_nbr | Number of non-bearing almond trees | No. |
| K_Almonds | The total number of bearing trees as a proportion of total almond trees | % |
| K_meta | Metadata for K_Almonds | Value |
The production and value dataset has also been built from unit-record data for catchment regions between 2005–06 and 2017–18 for selected commodities. For Almonds, Cotton, Grapevines and Rice, a custom dataset was created from ABS unit-record data for 2010-11 to 2017-18. For all other commodities, and from 2018–19 onwards, ABARES apportioned NRM level data to catchment regions.
| Variable | Description | Units |
|---|---|---|
| Production | Volume of irrigated production. For commodities Almonds, Cotton, Grapevines, Other broadacre, Other cereals, Pastures – Hay and Rice, production is reported in tonnes. For Dairy, production is reported in Litres. For all other commodities, production is reported as an index value. | Various |
| Units_Q | Indicates the unit of measurement for production | Text |
| Q_meta | Metadata for Production | Value |
| Commodity price | Commodity prices ($2019–20). For commodities Almonds, Cotton, Grapevines, Other broadacre, Other cereals, Pastures – Hay and Rice, prices are reported in $/t. For Other broadacre and Other cereals, canola and wheat indicator prices are used respectively. For Dairy, prices are reported in c/L. For all other commodities, prices are reported as an index value. | Various |
| Units_Y | Indicates the unit of measurement for commodity prices ($/t, c/L, Index) | Text |
| GVIAP | Dollar value of irrigated agricultural production ($2019–20) | $ |
| G_meta | Metadata for GVIAP | Value |
Source: ABARES
Table 4 and Table 5 list the irrigation activities considered, which are based on ABS industry classifications. A significant feature of the MDB water market catchment dataset is that it separately reports data for the almonds industry, which is elsewhere part of the combined fruit and nut category reported by the ABS.
Table 4 shows the irrigation activities for the area and water use data. Revisions have made to the irrigation activities reported based on updates made by the ABS (ABS 2021b). The All other crops category is the aggregation of the previously reported Other broadacre, Other cereals and Other crops categories. The Pastures – Grazing category is the aggregation of previously reported Pastures for grazing and Dairy categories. See the metadata for additional information on how these series were constructed (Table 6).
Table 5 shows the irrigation activities for the production and value data. The key differences are the reporting of disaggregated Other cereals and Other broadacre categories, as well as Dairy and Pastures – Grazing categories (which continue to be reported by the ABS for production and value).
| All other crops | Pastures - Grazing |
| Almonds | Pastures - Hay |
| Cotton | Rice |
| Fruit | Vegetables |
| Grapevines |
Source: ABARES
| Almonds | Other cereals |
| Cotton | Pastures – Hay |
| Dairy | Pastures - Grazing |
| Fruit | Rice |
| Grapevines | Vegetables |
| Other broadacre |
Source: ABARES
For regions within the MDB where data was missing (for example, due to ABS confidentiality constraints) ABARES has estimated values. ABARES has used a variety of methods to impute missing data, as listed in Table 6. All imputed data points are marked in additional columns in the dataset (denoted with the "meta" suffix) and remain subject to further refinement.
| Value | Description |
|---|---|
| 1 | ABS unit-level data constructed by ABARES |
| 2 | Catchment data apportioned by ABARES using ABS NRM data |
| 3 | Missing values filled with a linear interpolation |
| 4 | Missing values filled with ABARES regression results |
| 5 | Data obtained from external sources (e.g. MDBA) |
| 6 | Missing data that was not filled using other methods |
| 7 | ABARES estimate |
| 8 | Aggregated category, where sub-categories have different sources |
| 9 | Aggregated category, where at least one of the sub-categories has missing data |
Source: ABARES
The supply file was compiled using data from the MDBA, state water agencies (NSW Department of Planning, Industry and Environment, Goulburn-Murray Water, Northern Victorian Resource Manager and the South Australian Department for Environment and Water), BOM and the Department of Agriculture, Water and the Environment (DAWE). Water price data has been compiled and cleaned by ABARES using the GAM price cleaning method described in Sanders et al. 2019.
Each of the variables included in the supply file are briefly described in Table 7, which contains data for catchments in the MDB from 2000–01 to 2020–21.
For 2020–21, data for water forfeits has not yet been published by NSW and has been estimated by ABARES based on the carryover rules applied in that state.
The volume of entitlements on issue reported in the supply file is based on 2020-21 data. As a result, some structural changes over the past two decades (such as the introduction of low reliability entitlements in Victoria) are smoothed over, as the data is intended to support modelling and analysis of forward-looking scenarios.
| Name | Description | Units | Source |
|---|---|---|---|
| Rainfall | The annual average volume of rainfall recorded across catchments. June and July are excluded from annual calculation. | mm | BOM |
| Entitlement volumes | Water entitlements are an ongoing right to access a share of water. They are equal to a nominal volume of water for different types of reliability, and are able to be traded or held for potential use. | ML | State water availability reports |
| Allocation percentages | The percentage for each entitlement type that is able to be accessed during a water year or a particular period. For combined regions (i.e. Vic. Goulburn-Broken) allocation percentages are derived by calculating the combined regional allocation volume, divided by the combined regional entitlement volume. |
% | State water allocation announcements |
| Uncontrolled flow usage | Uncontrolled flow events occur when there is a water flow that is not able to be controlled, and is greater than the amount allocated for consumption or environmental needs. During this time anyone is allowed to access the water. The volume accessed for use is considered the uncontrolled flow usage. | ML | New South Wales Available Water Determination (‘AWD’) Reports |
| Allocation volume | A water allocation is the right to access a volume of water during a water year. It is equal to the entitlement volume multiplied by allocation percentages for each entitlement type. | ML | State water allocation announcements, state water availability reports, NSW AWD reports |
| Within year forfeits | Water users can sometimes lose water from evaporation or other causes. When this occurs the volume lost is considered a within year forfeit. | ML | Victorian unused water reports, NSW General Purpose accounting and AWD reports |
| End of year forfeits | End of year forfeits are equal to the total volume of water that has not been used in the water year or carried over into the next year. | ML | VIC Unused water reports, NSW General Purpose accounting, and AWD reports |
| Carryover from previous year | The total volume of allocation water individual water right holders have held in storage to carry over from the previous year. | ML | NSW Department of Primary Industries, Northern VIC Resource Manager, South Australia Department for Environment and Water, Vic. Water Register |
| Environmental buyback entitlement volumes | Total volume of entitlements purchased for the environment by the Commonwealth Environmental Water Holder (CEWH). | ML | DAWE |
| On-Farm Infrastructure programs entitlement volumes | Total volume of entitlements recovered for the environment through on-farm infrastructure programs. | ML | DAWE |
| Off-Farm Infrastructure program entitlement volumes | Total volume of entitlements recovered for the environment through off-farm infrastructure programs. | ML | DAWE |
| Delta | The sum of entitlement volumes recovered for the environment from buybacks and on-farm infrastructure programs as a proportion of the total volume of entitlements. | % | ABARES estimate |
| Price of water allocations | Average annual real ($2019–20) allocation price. June and July are excluded from annual calculation. | $/ML | BOM national water register. Data was cleaned using ABARES price cleaning scripts. |
| Net allocation water trade from CEWH to irrigators | Total volume of water sold from the CEWH to irrigators. | CEWH | |
| Net allocation water trade (excluding environmental trade) | Total volume of allocation water traded into a catchment region subtracted by the total volume of water traded out of it. | ML | MDBA provisions, Victorian Water Register |
| Water used for irrigation | ABARES estimate for total water use for irrigation by catchment by year | ML | ABARES estimate |
ABS 2021a, Consumer Price Index, Australia, cat. no. 6401.0, Australian Bureau of Statistics, Canberra, accessed 28 June 2021.
ABS 2021b, Water use on Australian farms, cat. no. 4618.0, Australian Bureau of Statistics, Canberra, accessed 14 May 2021.
Gupta, M, Hughes, N & Wakerman-Powell, K 2018, A model of water trade and irrigation activity in the southern Murray-Darling Basin, paper presented at the Australasian Agricultural & Resource Economics Society 2018 Annual Conference, Canberra, February, accessed 20 February 2020.
Sanders, O, Hughes, N & Gupta, M 2019, Measuring water market prices; Statistical methods for interpreting water trade data, ABARES research report, Canberra, February, CC BY 4.0, DOI: 10.25814/5c5388a92260d, accessed 24 February 2020.
Report download
Murray-Darling Basin Water Market Catchment Dataset 2021 – Report – PDF [497 KB]
Murray-Darling Basin Water Market Catchment Dataset 2021 – Report – DOCX Word [1.36 MB]