Skip to main content Skip to main navigation Skip to search
ABARES

Top navigation abares

  • Department
  • Ministers
  • Media Centre
Main menu

Main navigation ABARES

  • ABARES Home
    ABARES Home
  • About
    About
  • Research topics
    Research topics
  • Products
    Products
  • Data
    Data
  • News
    News
  • Conferences and events
    Conferences and events
  • Careers
    Careers
Department of Agriculture

Breadcrumb

  1. DAFF Home
  2. ABARES
  3. Data
  4. Weekly commodity price update
  5. Australian horticulture prices

Secondary ABARES

  • Weekly commodity price update
    • World agricultural prices
    • Australian agricultural prices
    • Australian horticulture prices

Australian horticulture prices

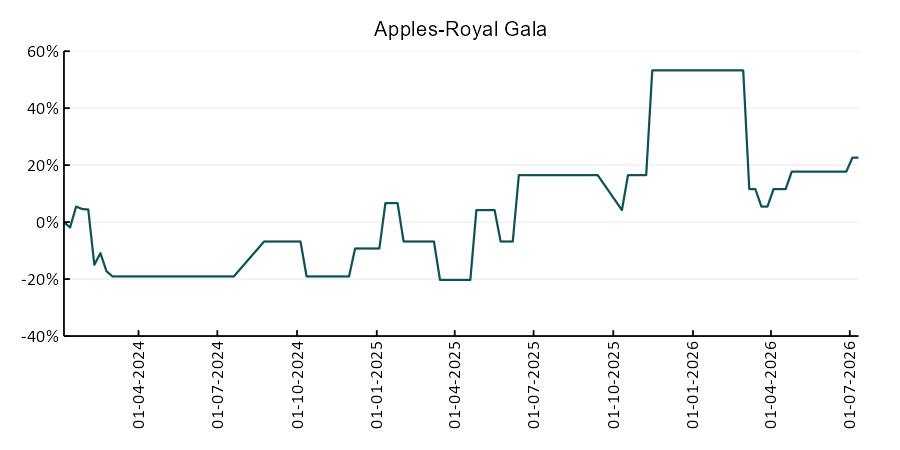
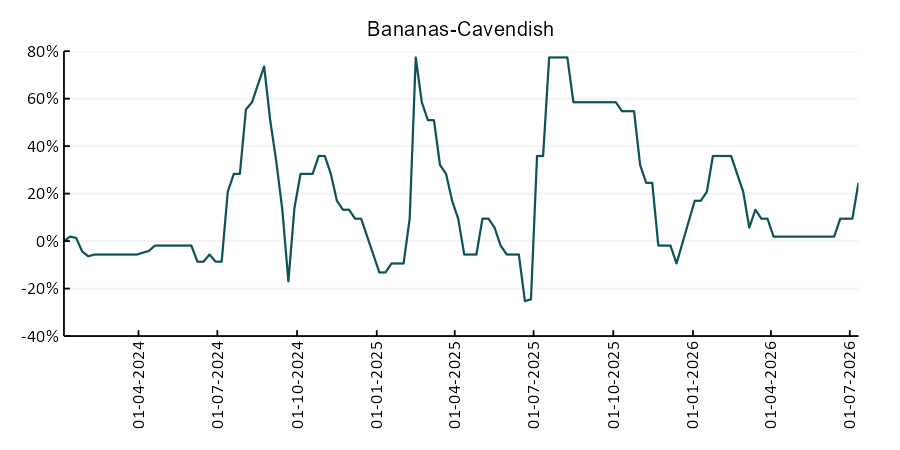
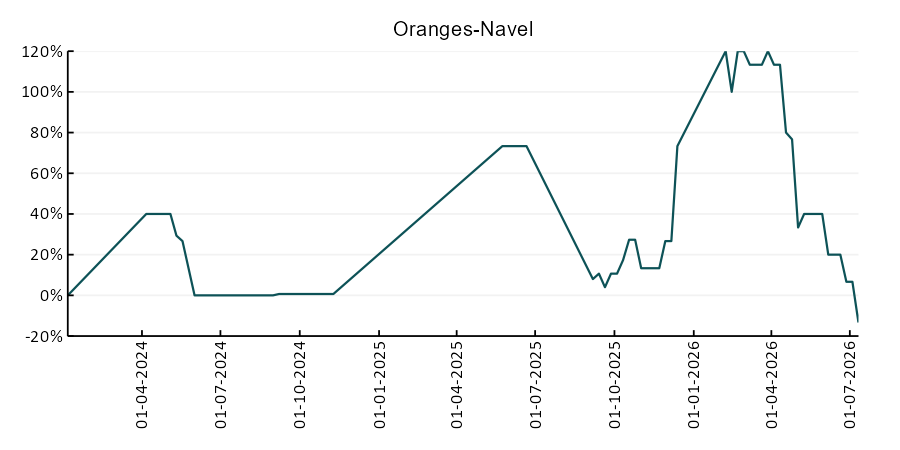
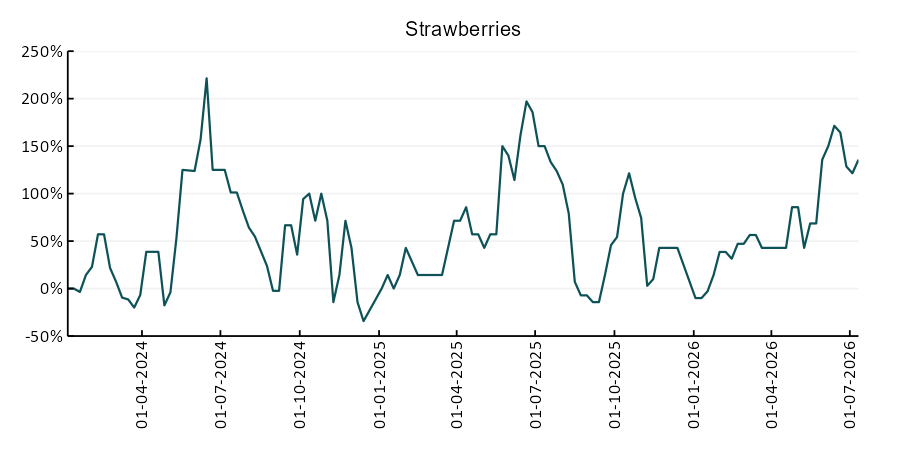
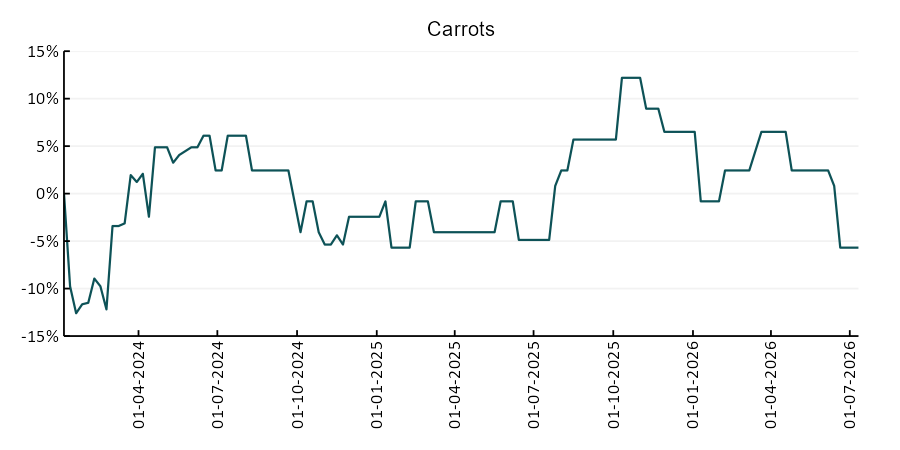
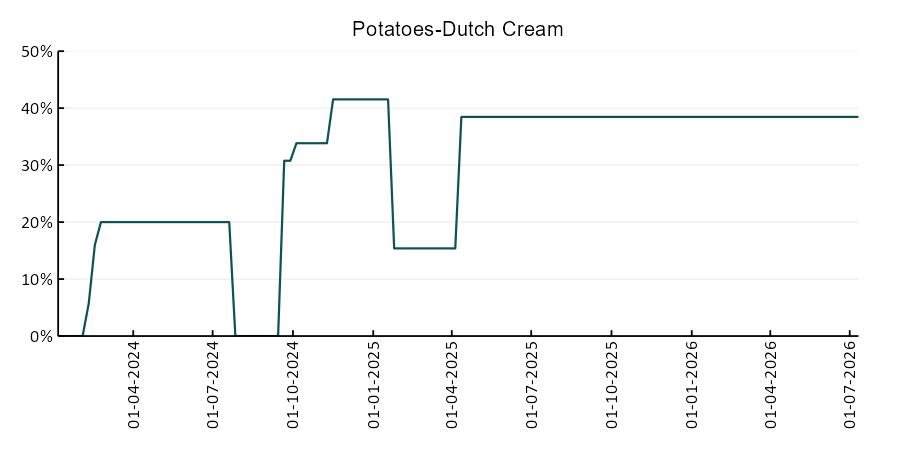
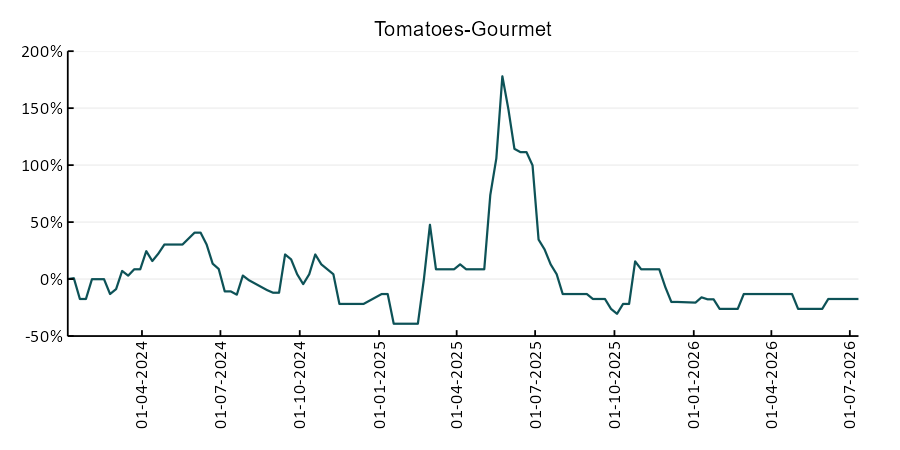
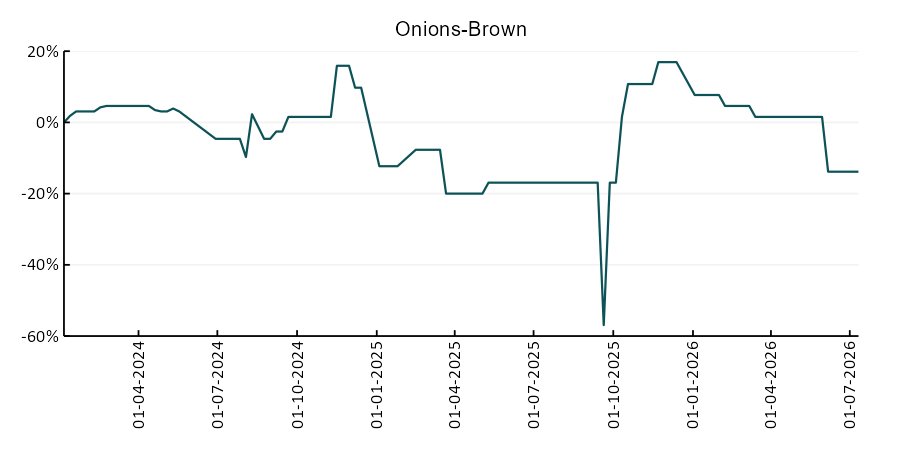
Movements in selected fruit and vegetable prices at Melbourne Wholesale Markets.

Click chart image to expand.

Fruit

This line chart shows the prices for Apples – Royal Gala from 2024 to 2026. The price on 31 January 2026 was 0.53 index. This price indicator is unchanged from the previous week.
Apple (Royal Gala)
This line chart shows the prices for Bananas – Cavendish from 2024 to 2026. The price on 31 January 2026 was 0.36 index. This price indicator is unchanged from the previous week.
Banana (Cavendish)
This line chart shows the prices for Oranges – Navel from 2024 to 2026. The price on 13 December 2025 was 0.73 index. This price indicator is higher than the previous week.
Orange (Navel)
This line chart shows the prices for Strawberries from 2024 to 2026. The price on 31 January 2026 was 0.39 index. This price indicator is higher than the previous week.
Strawberry

Vegetables

This line chart shows the prices for Carrots from 2024 to 2026. The price on 31 January 2026 was -0.01 index. This price indicator is unchanged from the previous week.
Carrot
This line chart shows the prices for Potatoes – Dutch Cream from 2024 to 2026. The price on 31 January 2026 was 0.38 index. This price indicator is unchanged from the previous week.
Potato (Dutch cream)
This line chart shows the prices for Tomatoes – Gourmet from 2024 to 2026. The price on 31 January 2026 was -0.26 index. This price indicator is lower than the previous week.
Tomato (gourmet)
This line chart shows the prices for Onion – Brown from 2024 to 2026. The price on 31 January 2026 was 0.08 index. This price indicator is unchanged from the previous week.
Onion (brown)

Sources: See data attribution

Thanks for your feedback.
Thanks! Your feedback has been submitted.

We aren't able to respond to your individual comments or questions.
To contact us directly phone us or submit an online inquiry

CAPTCHA
This question is for testing whether or not you are a human visitor and to prevent automated spam submissions.

Please verify that you are not a robot.

Skip
Page last updated: 05 February 2026

We acknowledge the continuous connection of First Nations Traditional Owners and Custodians to the lands, seas and waters of Australia. We recognise their care for and cultivation of Country. We pay respect to Elders past and present, and recognise their knowledge and contribution to the productivity, innovation and sustainability of Australia’s agriculture, fisheries and forestry industries.

Artwork: Protecting our Country, Growing our Future
© Amy Allerton, contemporary Aboriginal Artist of the Gumbaynggirr, Bundjalung and Gamilaroi nations.

Footer

  • Contact us
  • Accessibility
  • Disclaimer
  • Privacy
  • FOI

© Department of Agriculture, Fisheries and Forestry

Facebook X LinkedIn Instagram