
Authors: Kevin Burns, Shujia (Charlie) Qin and Trish Gleeson
Introduction
Indonesia’s trade ties with Australia are longstanding. However, Indonesia’s previously strong growth in agricultural imports has slowed over the past 10 years, coinciding with policy changes focussed on self-sufficiency goals aimed at improving food security. At the same time its economy has been growing strongly, with food demand expanding and consumers’ preferences becoming increasingly diverse. Bilateral and regional trade agreements, as well as Indonesia’s new Omnibus Law, may bring about a more liberalised trade and investment policy environment. But self-sufficiency remains the principal rationale for restrictions on trade, and complex regulatory and legal systems pose ongoing barriers to doing business, including for Australian agricultural exporters.
Indonesia was one of the countries most affected by the Asian Financial Crisis in 1998 but, in the decades since, its economic growth has outperformed Australia’s other major agricultural export destinations except China (Figure 1). Despite the Global Financial Crisis (GFC), Indonesia’s real GDP growth averaged 5% a year between 2000 and 2020. This includes the contraction in 2020 due to the impact of the COVID-19 pandemic. By comparison, with the exception of China, the economies of Australia’s other major trading partners grew much more slowly. Indonesia’s GDP per capita growth, an important indicator of household welfare and economic development, has also exceeded Australia’s other major export markets. Indonesia is now the 10th largest economy in the world and the largest economy in South-East Asia (World Bank 2021a).
Indonesia is the 4th most populous country in the world and the largest in South-East Asia, with a population estimated at 270 million in 2020 (United Nations 2019; BPS 2021). Its population is also relatively young, with almost two-thirds born after 1980, and the working age group (16–64) accounting for 71% of the population.
FIGURE 1 GDP and GDP per capita growth of Australia’s top 5 agricultural export markets, 2000 to 2050
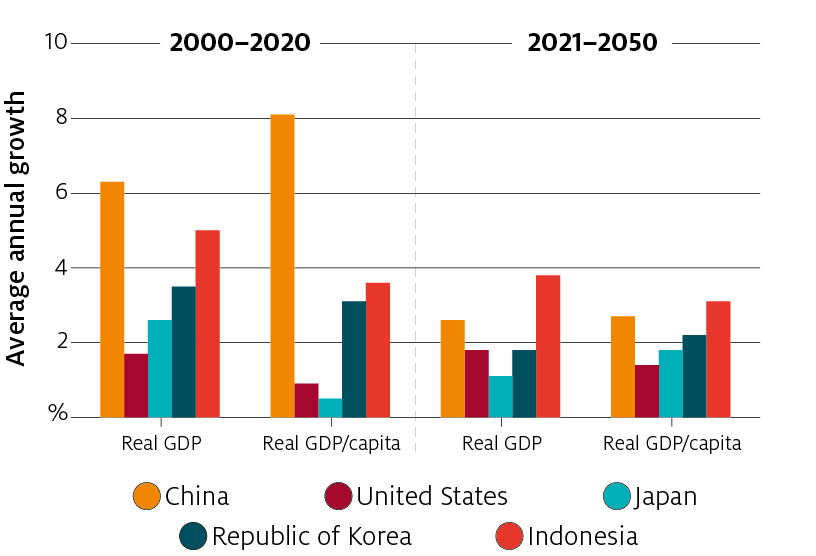
Source: IMF 2021 (historical) and OECD 2018 (projections)
Food security policies have favoured domestic production over imports
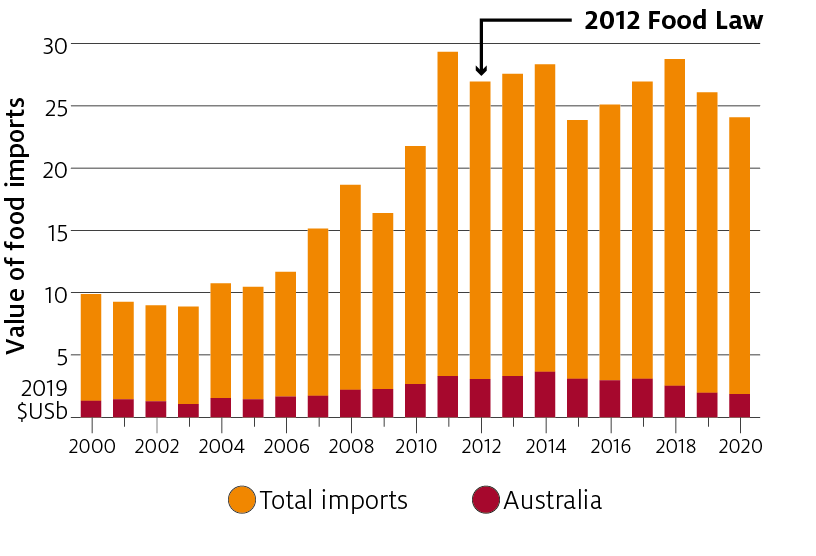
High rates of economic and population growth, combined with falling rates of poverty and malnutrition, have contributed to a marked increase in the country’s food consumption. This growth in food consumption is reflected in the increased real value of Indonesia’s food imports between 2000 and 2012 (Figure 2). Food imports have also been driven by demand from Indonesia’s food processing sector, which has strong backward linkages within global value chains. Indonesia’s top 5 imported agricultural commodities now include wheat, soymeal, milk powder, sugar and cotton, which make up 35% of Indonesia’s agricultural imports.
Since 2012 food import growth has stalled (Figure 2). The Indonesian rupiah’s 26% depreciation against the US dollar in 2013, which increased the cost of imports, was a factor in constraining import demand at that time. This was compounded by the 2012 Food Law and the Indonesian Government’s sharpening focus on agricultural self-sufficiency, which protects the domestic industry from foreign competition by restricting agrifood imports.
FIGURE 2 Indonesia’s real value of food imports, total and from Australia, 2000–2020
Since 2008, when the price of food commodities peaked, Indonesia’s policy objectives have emphasized food security, self-sufficiency and food sovereignty (OECD 2021). To achieve these objectives, the government has consistently taken an interventionist approach, using reference prices, import restrictions, tariffs, input subsidies (especially fertiliser) to assist producers, and price interventions and food subsidies (especially for rice) to support consumers (Gunning-Trant et al. 2015; OECD 2021).
Indonesia’s food demand growth will stem from ongoing expansion in its market size (GDP and population), as well as from structural transitions occurring within the country. A rapidly urbanising society and expanding middle class have made Indonesia one of the world’s fastest growing consumer markets, including for many agricultural commodities (DFAT 2020). As these changes transform the nature of food consumption in the country, there will be increasing pressure on policymakers to allow imports to meet this demand growth.
Higher incomes and urbanisation are diversifying food demand
While per capita consumption of cereals and starchy staple food products (such as rice and cassava) has increased slightly since 1990 (Figure 3), there has been much stronger consumption growth of higher value foods such as dairy products, fruit, seafood and vegetables. Per capita consumption of dairy products has more than trebled since 1990, and more than doubled for fruit, seafood and vegetables.
This ‘nutrition transition’ away from traditional diets is also reflected in the ways that households purchase food, and types of places where food is consumed. Significant growth in the number of restaurants and food stalls (Arif et al. 2020), and the growing use of smart phones and food delivery services, have supported consumer preferences for ready-made and prepared meals. Indonesia is at the forefront of many e-commerce platforms, encouraged by its young, higher income and urbanised population’s openness to new technology, particularly in food. These trends have accelerated during the COVID-19 pandemic, which has further spurred the shift to online buying, but also raised concerns for food safety and product transparency in many countries (Greenville, McGilvray & Black 2020).
FIGURE 3 Per capita consumption of some foods has increased much faster than staple foods
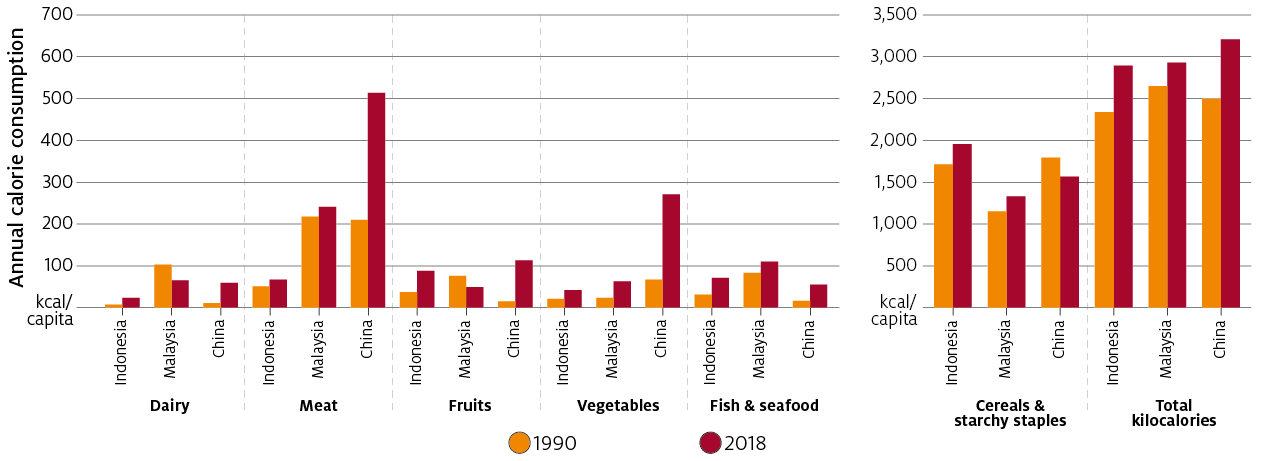
Source: FAO 2021
Trends in Indonesia’s food consumption have been driven by fundamental transitions within the economy
Higher incomes have played a significant role in changing diets, by giving consumers more discretionary spending to move calorie intake away from cereals and starchy staples towards more expensive and diverse foods (particularly fresh fruit, meat and vegetables), as well as increased consumption of processed and prepared foods from hospitality and imported products. Between 2002 and 2016 the proportion of the population classified as middle class in Indonesia grew from 7% to 20% (World Bank 2019). Upper- and middle-income consumption is now estimated at 82% of Indonesia’s total food and beverage consumption (USDA 2021).
In a much-heralded move, Indonesia was reclassified as an upper-middle income country in 2020 by the World Bank. However, Indonesia lost this status just a year later due to the economic impact of COVID-19 (Hamadeh, van Rompaey & Metreau 2021). Indonesia has suffered one of the worst COVID-19 outbreaks in Asia. Controls to combat the spread of the virus led to an additional 1.1 million people slipping into poverty between March 2020 and March 2021. This increased the number of Indonesia’s poor to 27.5 million people, or 10.1% of the population, and turned back 3 years of progress in poverty reduction (World Bank 2021b). Once Indonesia navigates its way out of the health crisis, it should resume its trajectory to higher incomes.
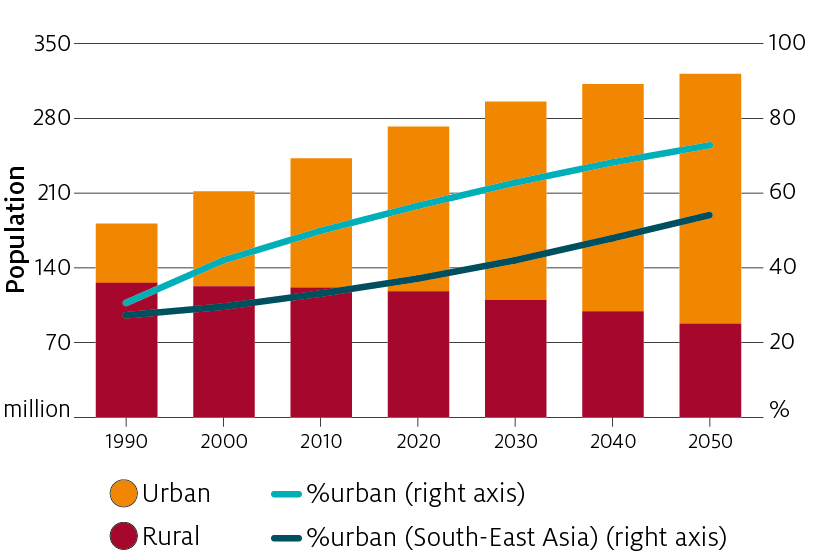
Urbanisation also has had wide-ranging impacts on food demand by increasing the availability of modern food consumption methods, moving consumption away from traditional ‘wet’ markets to super- and hyper-markets, and increasing the use of technology in shopping and takeaway. Indonesia’s rate of urbanisation has outpaced most other countries in South-East Asia (Figure 4). Between 1990 and 2020, Indonesia’s urban population expanded from 55 million (around 31% of the population) to 154 million (57%). Indonesia’s rural population peaked in 1993, and has declined since then, from 126 million to 118 million.
FIGURE 4 Indonesia’s population has become increasingly urbanised
Food demand growth will be in discretionary products
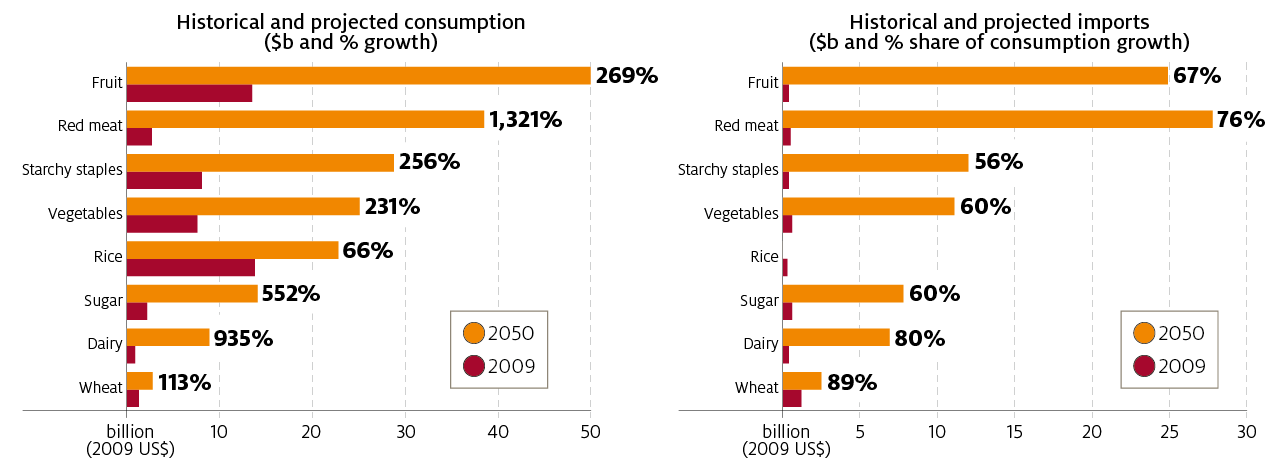
The substantial increase in food consumption has reflected economic “catch up”, as consumption of many food groups has increased from a low base (Figure 3). This trend is projected to continue over the longer term (Figure 5). While there remains strong political will to pursue food self-sufficiency in Indonesia, this will become even more difficult in the future, given the projected growth in demand for high-value and diverse foods.
Domestic production of key food products has been hampered by the persistent challenges of limited land supply, an agricultural sector characterised by smallholdings, a deteriorating resource base (such as erosion problems and nutrient depletion, particularly on sloping hillsides), and ongoing competition for resources between production of non-food cash crops and food crops (Gunning-Trant et al. 2015).
Due to these constraints in Indonesia’s agriculture sector, it is likely that around three-quarters of the value of food consumption growth to 2050 will be supplied by imports.
Indonesia’s climate also makes domestic production of some commodities unsuitable. For example, Indonesia is the world’s second largest wheat importer by volume because of the strong demand for noodles and bakery products. However, Indonesia is wholly unsuited for wheat production. For other commodities, such as beef and dairy, the domestic industry is still developing and has not reached a sufficiently large scale to meet demand. Domestic beef production meets approximately 48% of the country’s demand, with imports of beef and live cattle meeting the shortfall. Further, while dairy consumption is estimated to grow by 3% per year (Ministry of Agriculture 2020a), approximately 80% of dairy products are imported since the majority of Indonesia’s domestic milk production is supplied by smallholder dairy farmers and cannot meet domestic demand (USDA 2020).
Indonesia produces a diverse range of mainly tropical fruits. However, changing consumer preferences have led to strong demand growth for imported fresh fruits such as apples, berries, citrus, grapes and stone fruit. In 2020, Indonesia imported fresh fruits valued at US$1.2 billion, 66% of which were from China. Australia was the second-largest supplier of fresh fruits to Indonesia (8% of imports), followed by the United States (7%) (ITC 2021).
FIGURE 5 Projected Indonesian agrifood consumption is higher across a variety of commodities
Allowing domestic production to respond to demand trends would require the Indonesian Government to remove policies that distort the efficient allocation of resources – for example, price supports for basic foods and government-granted monopolies. Additionally, meeting increasing demand for foods not easily produced in Indonesia requires removal of policies that restrict imported ingredients.
Prospects for reform: a changing policy environment
In recent years, Indonesia has been actively pursuing increased economic cooperation through regional trade agreements, such as the Regional Comprehensive Economic Partnership (RCEP, enters into force on 1 January 2022), and with bilateral agreements, such as the Indonesia-Australia Comprehensive Economic Partnership Agreement (IA-CEPA, entered into force in 2020). As an importer, Indonesia is already party to 14 in-force agreements – 5 of which are bilateral (with Australia, Chile, Japan, Pakistan and Palestine); 6 are regional as a member of ASEAN (with Australia and New Zealand, China, Hong Kong, India, Japan, Republic of Korea); 1 is as part of the Group of Eight Developing Countries (which include Bangladesh, Egypt, Indonesia, Iran, Malaysia, Nigeria, Pakistan, Turkey); and 2 are within ASEAN (ASEAN Regional Group Agreement and ASEAN Integration System of Preferences).
Unfortunately, Indonesia’s complex regulatory environment has made implementation of these agreements less than efficient. Increased behind-the-border barriers to trade have been encouraged by the self-sufficiency policies of the Food Law and a suite of complementing, overlapping and at times contradictory agricultural and trade regulations. Due to restrictions on foreign ownership in some agricultural industries, there has also been little foreign investment in Indonesian agriculture, particularly in food crops and horticulture. Between 2015 and 2019, only 3%-7% of total foreign direct investment was in agriculture, and most of that was in the oil palm sector (Pasaribu, Murwani & Setiawan 2021). Foreign investment can contribute to food affordability and quality by introducing new technologies and knowledge, managerial capabilities and connections to the global market.
In a departure from previous policies, the most recent agricultural policy – the Strategic Plan of the Ministry of Agriculture 2020–2024 – places more focus on increasing productivity through improving farmers’ skills and increasing exports to address perceived trade imbalances (Rafani & Sudaryanto 2020). Key targets include increased productivity and quality of food crops, development of agricultural infrastructure and facilities, improved agricultural counselling and training, increased food diversity, and improved agricultural quarantine and biological safety oversight (Ministry of Agriculture 2020b). However, food security and self-sufficiency remain key objectives for several strategic products.
The shift towards a more liberalised trade and investment policy is also reflected in the 2020 Omnibus Law on Job Creation, which aims to strengthen Indonesia’s economy, increase competitiveness and create jobs by removing regulation and red tape which, among other things, have inhibited domestic and foreign investment (Greenhouse 2021). For the agricultural sector, the new policy contains many revisions of the 2012 Food Law and other regulations. It emphasises productivity growth rather than protectionist trade policies as a way of supporting the sector (CIPS 2020). Indeed, the Omnibus Law recognises that food imports and domestic food production have equally important roles for achieving food security.
To encourage imports, the Omnibus Law liberalises some of the policies which formerly constrained trade. These include the removal of penalties for importing agricultural commodities when national stocks are sufficient; the removal of quantity restrictions on imports of horticulture, livestock and animal products; and the removal of weight limitations on imports of live cattle (CIPS 2020). For investment, the Omnibus Law has deregulated some of the more restrictive sectors, such as removing a 30% foreign ownership cap in horticulture businesses and removing the negative investment list, which affected horticulture and 14 other sectors (Pasaribu, Murwani & Setiawan 2021). Combined with the broader reforms across the economy, these policy changes could attract increased investment (both local and foreign) in agricultural production as well as food and beverage processing.
But barriers to trade persist
Although the Omnibus Law has been ratified, its impact on food trade will depend on its broader implementation and, in particular, its treatment of food trade and ambition to reform the country’s complex food trade policy. For example, Ministry of Agriculture and Ministry of Trade regulations that contain non-tariff measures (NTMs) on food imports remain in place, even after implementation of the Omnibus Law reforms, and these may continue to constrain trade despite liberalisation elsewhere in the economy (Amanta 2021).
Under present arrangements, the regulatory environment for imports and agricultural commodities can be complex, ambiguous and changeable, which causes regulatory and policy uncertainty. Although Indonesia has reduced import tariffs – with the average applied most favoured nation tariff on agrifood products at just over 5% in 2017 (OECD 2020) – in recent years NTMs have increasingly been used to restrict food imports.
NTMs include technical measures and quantitative restrictions. Technical measures, such as sanitary and phytosanitary (SPS) measures, technical barriers to trade (TBT) and pre-shipment inspections, are designed to protect consumers and the environment. However, they also increase compliance and storage costs. Inefficient application of these measures adds significantly to costs and can be used as an ad hoc barrier to deter selected imports (Figure 6).
FIGURE 6 Process of importation with non-tariff measures (NTMs)
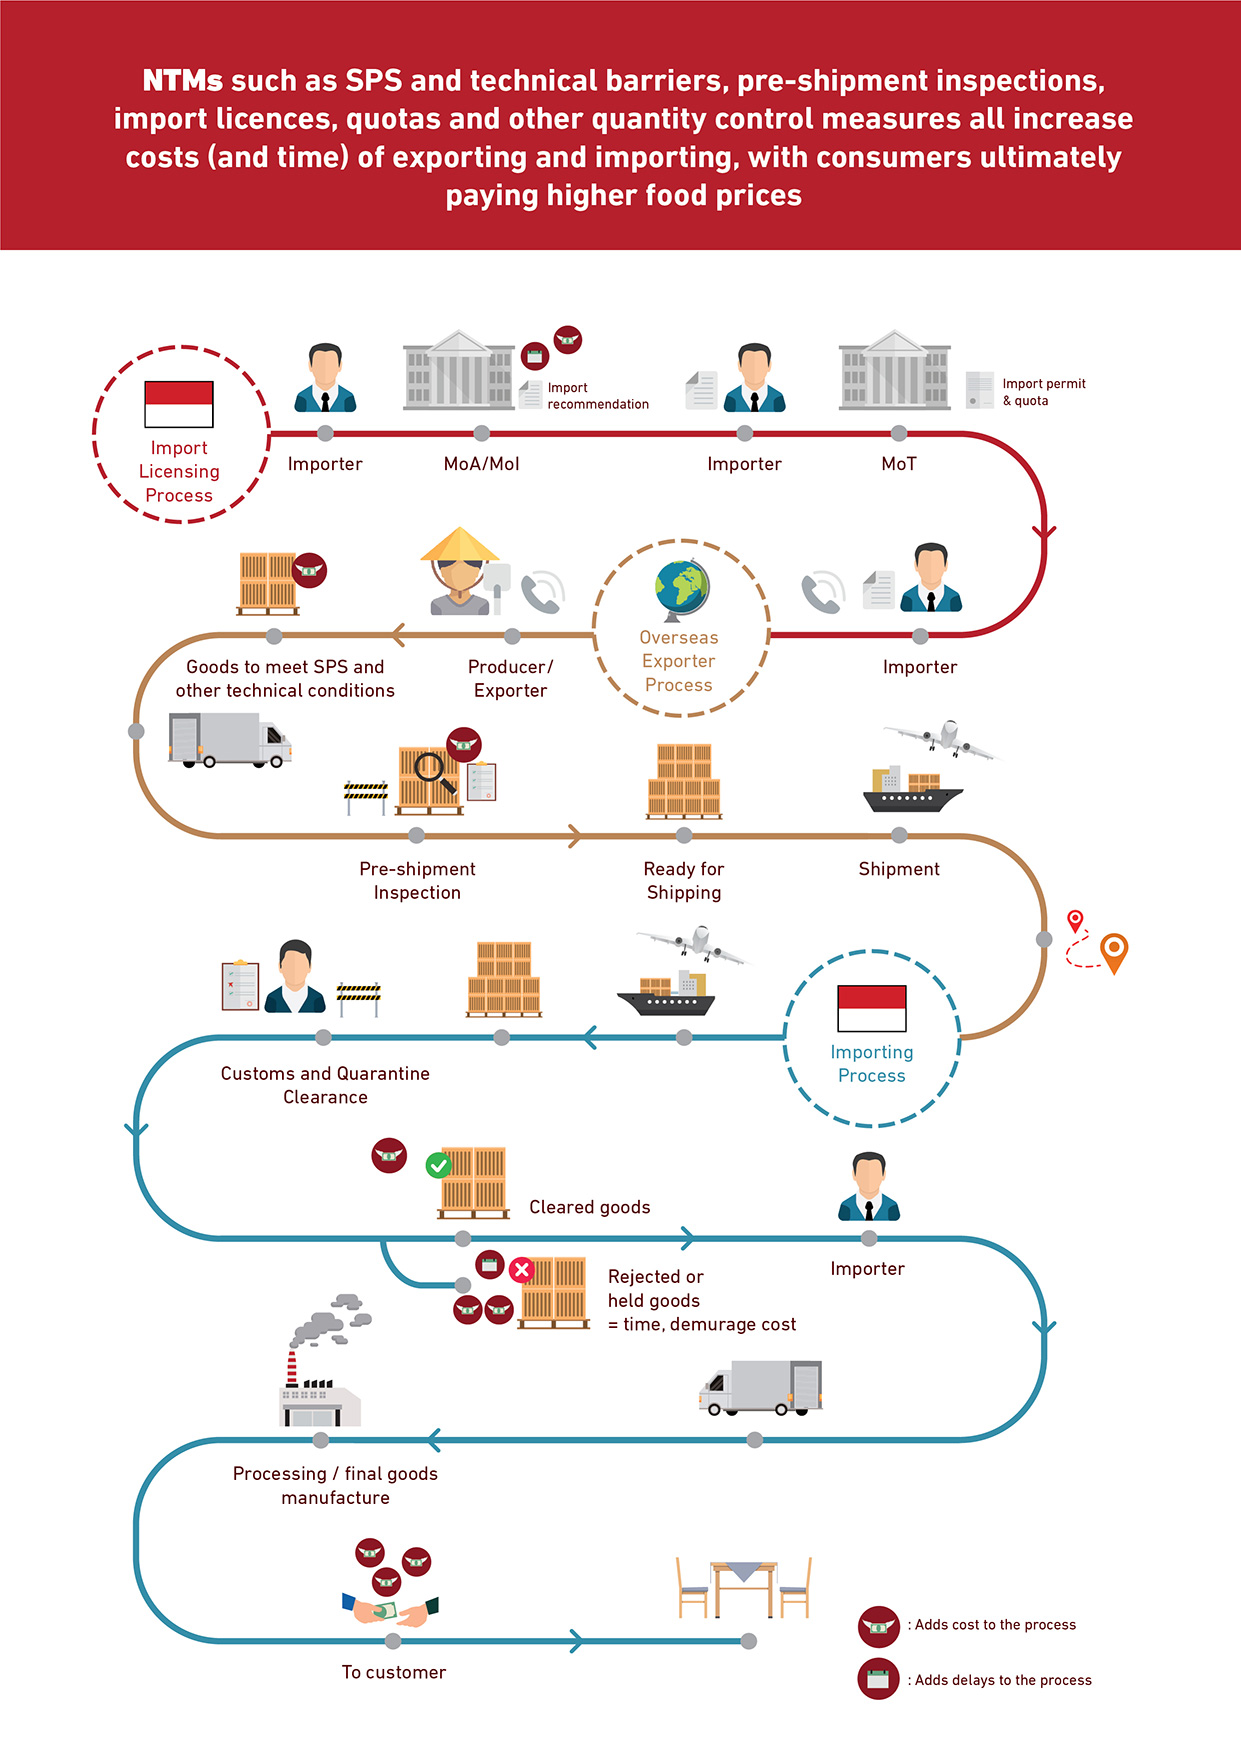
Quantitative restrictions set limits on how much a country can import and are implemented through a complex system of ‘recommendations to import’ from the Ministry of Agriculture and import permits issued by the Ministry of Trade. These restrictions or quotas imposed through non-automatic import licensing systems are associated with import delays due to the complicated process, and can result in food shortages in the market and higher food prices. The Omnibus Law purports to address this particular issue by streamlining the online systems used to issue import recommendations and permits. Notwithstanding, it appears that the non-automatic certification process and quantity restrictions will continue to be used to restrict trade.
There are significant opportunities for two-way trade in agricultural products between Australia and Indonesia. According to UNCTAD’s Revealed Comparative Advantage radar, Australian agriculture has comparative advantages in food and live-animal exports, especially in the export of barley, fruit and nuts, live animals, meat and wheat. Indonesia’s agriculture has comparative advantages in the export of cocoa, coffee, seafood, spices, tea, vegetable oil and its products (mainly palm oil) (UNCTAD 2021). These differences mean that our 2 countries have an opportunity for a traditionally complementary trade relationship that could be reinforced through stronger trade and investment ties.
Unfortunately. the heralded potential of Indonesia’s market has long been a point of frustration for Australia’s agricultural exporters, since opaque and costly NTMs have resulted in uncertainty and risk for traders. Solid economic, population and demand growth, the entry into force of IA-CEPA and liberalisation of tariffs have promised immense opportunities for exporters. For some key products, tariff-rate quotas provide some relief from costly NTMs. For example, Indonesia has agreed to issue permits automatically and without seasonality for significant quantities of key agriculture products such as frozen beef, carrots, cattle, citrus products, feed grains, potatoes and sheep meat (DFAT 2019). However, for many other products costly restrictions remain.
Despite the policy direction set by the Omnibus Law, self-sufficiency remains the principal rationale for regulatory restrictions that create barriers for Australian agribusiness to enter the Indonesian market. While the Omnibus Law suggests that Indonesia is committed to reducing regulatory complexities, the country’s complex regulatory and legal systems – and many jurisdictional layers – continue to pose barriers for exporters wishing to trade in Indonesia (Patunru & Surianta 2020). In Indonesia itself, these self-sufficiency policies create price distortions, which cause resources to be directed into potentially less productive but protected agricultural sub-sectors, including beef, chilies, cocoa, maize, potatoes, rice, shallots, soybeans and sugar.
To improve Indonesia’s food security, greater openness to trade is required, both to reduce food prices and manage supply risk. Not only would this make food more affordable, but it would also diminish the distortionary effects past policies have had on the agrifood sector. Removing these distortions would allow farmers and investors to allocate resources according to profitability (Greenville 2018). The Omnibus Law is a positive step in this direction. However, for Australian exporters, while there is potential for market expansion for many products – particularly those feeding into Indonesia’s value chains – progress is likely to be slow and measured.
Amanta, F 2021, The cost of non-tariff measures on food and agriculture in Indonesia, Policy Paper No. 36, Center for Indonesian Policy Studies (CIPS), April.
Arif, S, Isdijoso, W, Ramadhan Fatah, A, and Rosidha Tamyis, A 2020, Strategic review of food security and nutrition in Indonesia: 2019–20 update, Jakarta, SMERU Research Institute, August.
BPS 2021, The Indonesian Population Census 2020, Highlights, Statistics Indonesia, presented to the United Nations Expert Group Meeting, 9–12 February 2021.
CIPS 2020, Key changes in the Omnibus Law Job Creation related to food and agriculture, Center for Indonesian Policy Studies, pdf 121kb.
DFAT 2019, Indonesia-Australia Comprehensive Economic Partnership Agreement: Outcomes, Australian Government Department of Foreign Affairs and Trade, 5 July.
—— 2020, Market Insights: Indonesia, Australian Government Department of Foreign Affairs and Trade, December.
FAO 2021, FAOSTAT Food Balance, Food and Agriculture Organization of the United Nations, accessed 16 July 2021.
Greenhouse 2021, Indonesia’s Omnibus Law and Effects on Foreign Investors in 2021, May.
Greenville, J 2018, ASEAN rice market integration: findings from a feasibility study, OECD Food, Agriculture and Fisheries Papers, No. 117, OECD Publishing, Paris.
——, McGilvray, H & Black, S 2020, Australian agricultural trade and the COVID-19 pandemic, Australian Bureau of Agricultural and Resource Economics and Sciences, Canberra.
Gunning-Trant, C, Sheng, Y, Hamshere, P, Gleeson, T & Moir, B 2015, What Indonesia wants: Analysis of Indonesia’s food demand to 2050, Australian Bureau of Agricultural and Resource Economics and Sciences, Canberra.
Hamadeh, N, van Rompaey, C & Metreau, E 2021, New World Bank country classifications by income level: 2021–2022, 1 July.
IMF 2021, World Economic Outlook Database April 2021, International Monetary Fund, Washington DC, accessed 10 August 2021.
ITC 2021, ITC Trade Map, accessed 19 October 2021.
Ministry of Agriculture 2020a, Outlook Susu Sapi (Dairy Outlook) 2019, Ministry of Agriculture of the Republic of Indonesia, Jakarta, 18 February.
—— 2020b, Statistik Pertanian (Agricultural Statistics) 2019, Center for Agricultural Data and Information System, Ministry of Agriculture of the Republic of Indonesia, Jakarta, 17 March.
OECD 2018, GDP long-term forecast (indicator), Organization for Economic Co-operation and Development, accessed 10 August 2021.
—— 2021, Agricultural Policy Monitoring and Evaluation 2021: Addressing the Challenges Facing Food Systems, OECD Publishing, Paris.
Pasaribu, D, Murwani, A & Setiawan I 2021, Foreign Direct Investment in Indonesia’s Agriculture, Policy Paper No. 35, Centre for Indonesian Policy Studies (CIPS), Jakarta, April.
Patunru, A & Surianta, A 2020, Attracting FDI Post Covid-19 by Simplifying Indonesia’s Regulatory Framework, Policy Brief No. 4, Centre for Indonesian Policy Studies (CIPS), Jakarta, May.
——, —— & Audrine, P 2021, Indonesia-Australia Comprehensive Economic Partnership Agreement: Building the Powerhouse, Centre for Indonesian Policy Studies (CIPS), Jakarta.
PwC 2017, The Long View: How will the global economic order change by 2050, PricewaterhouseCoopers, London, February.
Rafani, I & Sudaryanto, T 2020, Strategic Plan of the Indonesian Ministry of Agriculture 2020–2024, FFTC Agricultural Policy Platform, March.
The Economist Intelligence Unit (EIU) 2021, 2020 Global Food Security Index, Indonesia.
United Nations 2018, Urbanization Prospects: The 2018 Revision, Department of Economic and Social Affairs, Population Division, Online Edition.
——2019, World Population Prospects 2019, Department of Economic and Social Affairs, Population Division, Online Edition. Rev. 1.
United Nations Conference on Trade and Development 2021, Revealed Comparative Advantage 2019, UNCTADSstat, accessed 28 October 2021.
United Nations Statistics Division 2021, UN Comtrade Database, accessed 4 August 2021.
USDA 2020, Dairy and Products Annual: Indonesia, USDA Foreign Agricultural Service, Jakarta, 20 October.
—— 2021, Indonesia: Retail Foods, USDA Foreign Agricultural Service, Jakarta, 6 July.
World Bank 2019, Aspiring Indonesia – Expanding the Middle Class, September.
—— 2021a, The World Bank in Indonesia, 6 April.
—— 2021b, Indonesia Economic Prospects (IEP) June 2021: Boosting the Recovery, 17 June.