
Snapshot of Australian Agriculture 2026
This Insights paper describes the current state of Australian agriculture, with the aim of providing key information and statistics in one place. It covers key aspects of Australian agriculture: its role in the broader economy, trends in production, exports, the impact of non-tariff measures, biosecurity, agricultural employment, farm incomes, industry structure, climate variability impacts, productivity, the use of natural resource management practices and sequestration on agricultural land.
If you have difficulty accessing these files, visit web accessibility for assistance.
Agriculture, fisheries and forestry’s contribution to the Australian economy
Australian agriculture accounts for (Figure 1):
- 68.3% of water consumption (11,760 gigalitres in 2023-24)
- 57.1% of land use (439 million hectares in December 2023)
- 12.4% of goods and services exports ($80.2 billion in 2024–25)
- 2.2% of value added (GDP) in 2024-25
- 5.6% of rural employment and 2.1% of national employment (308,000 people in 2024-25).
Figure 1 Australian agriculture, fisheries and forestry's share of national economic and environmental indicators
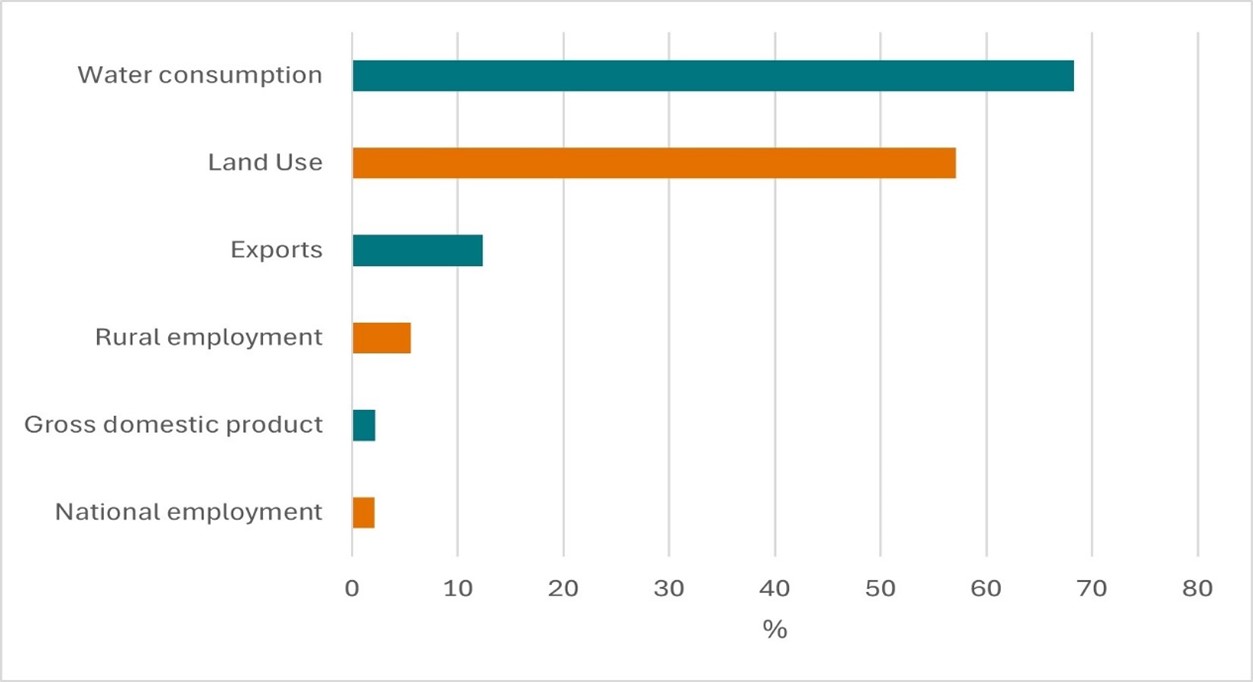
Notes: Water consumption is total water use minus total water supply (supply of distributed water, wastewater, reuse water, and return flows).
Reference years for each indicator can be found in the dot points above this figure.
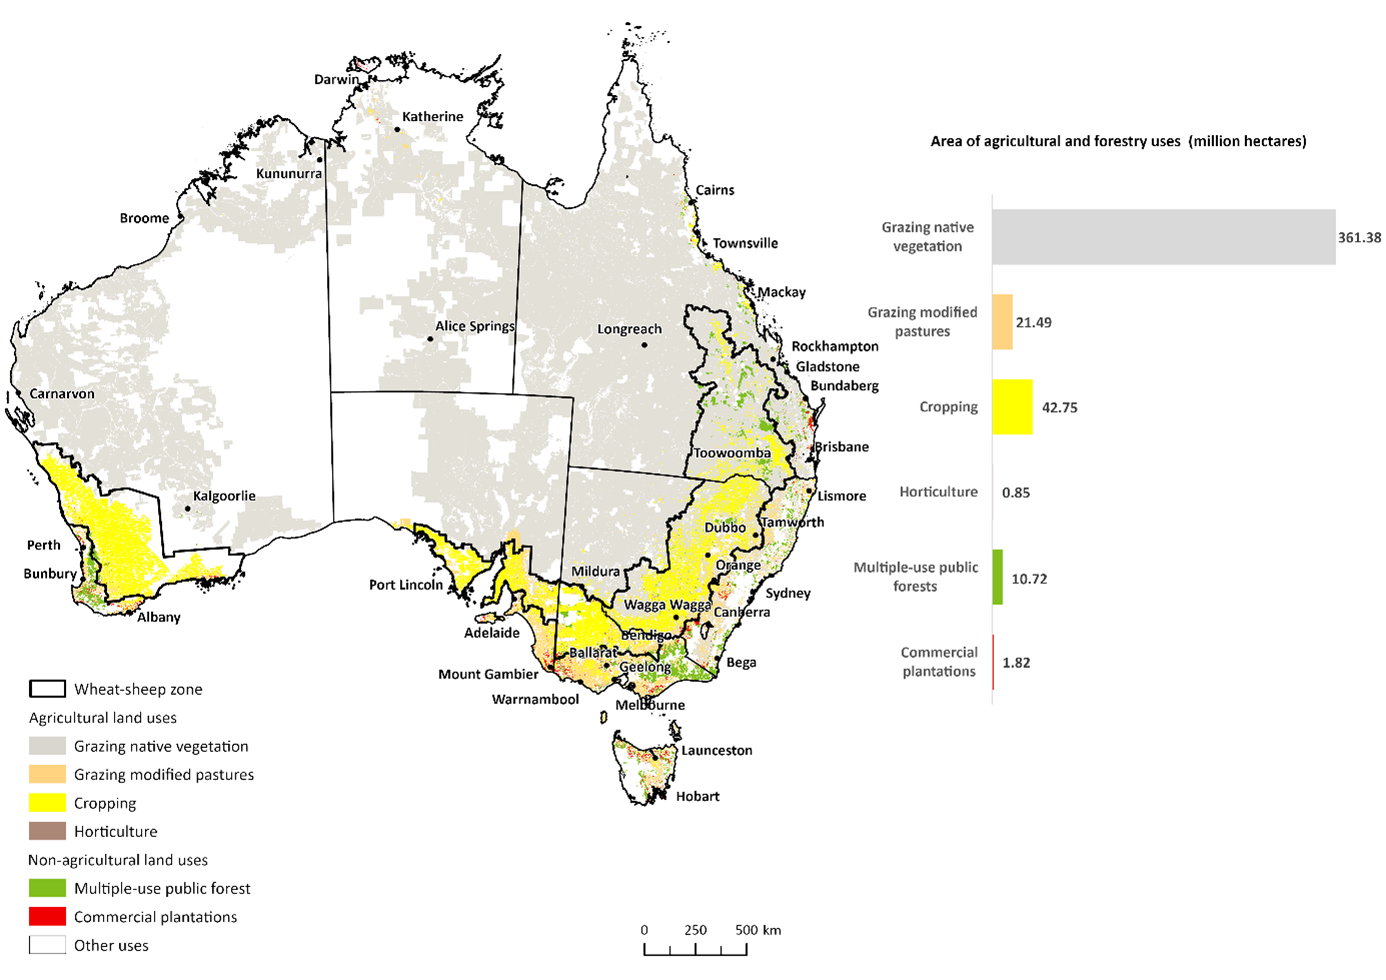
The mix of Australian agricultural activity is determined by climate, water availability, soil type and proximity to markets. Livestock grazing is widespread, occurring in most areas of Australia, while cropping and horticulture are generally concentrated in areas relatively close to the coast (Figure 2).
Figure 2 Australian land used for agriculture and forestry
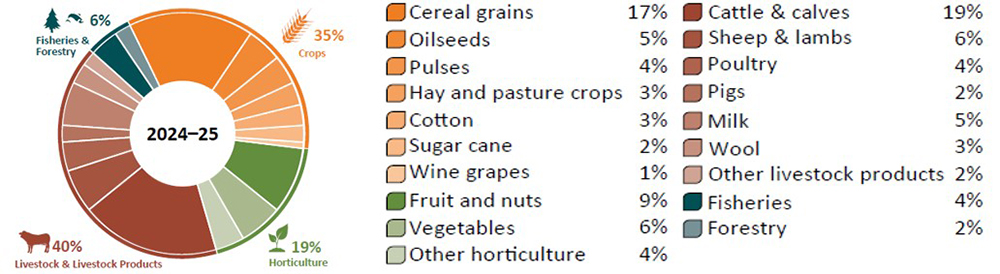
Australia has a diverse agricultural, fisheries and forestry sector, producing a range of crop and livestock products (Figure 3).
Figure 3 Agriculture, fisheries and forestry value of production, by commodity, 2024–25
Three successive years of record-breaking production value from 2020–21 to 2022–23 were underpinned by extremely favourable climate conditions and strong commodity prices on average across agricultural products. Following a decline in 2023–24, on the back of drier conditions and lower crop prices, agricultural production value rebounded in 2024–25 supported by strong livestock and livestock product prices, as well as higher crop production. Total agricultural, fisheries and forestry production in 2024–25 reached the second highest level on record in nominal terms and third highest level in real terms (Figure 4).
Figure 4 Value of Australian agriculture, fisheries and forestry production 2004-05 to 2024-25
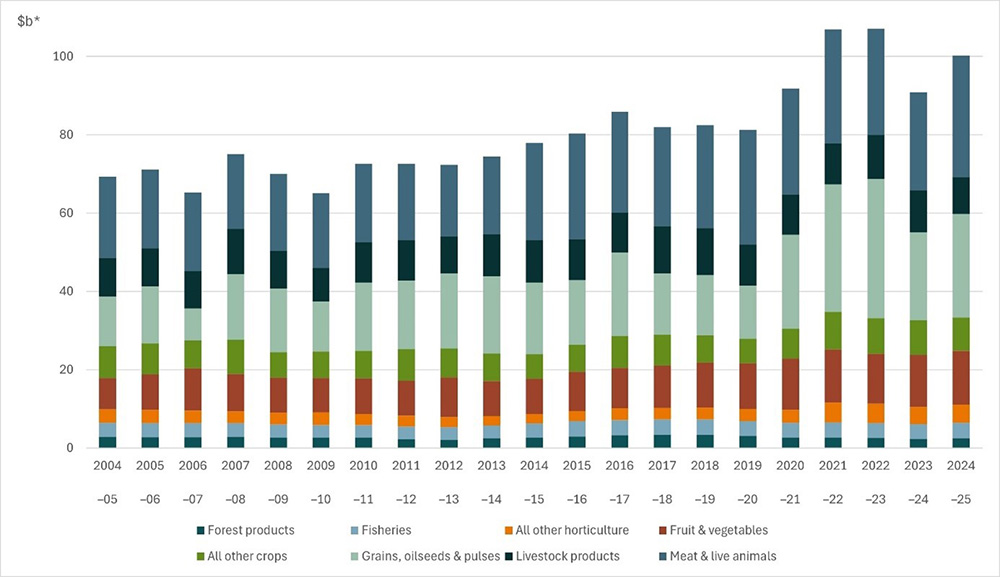
Note: *2024–25 Australian dollars.
The gross value of agriculture, fisheries and forestry production has increased by 45% in the past 20 years in real terms (expressed in 2024-25 dollars) from $69.3 billion in 2004–05 to $100.3 billion in 2024-25.
Drivers of growth in the value of agriculture's output over the past 20 years vary by sector.
- Cropping: producers have improved productivity by adopting new technologies and management practices leading to strong volume growth.
- Livestock: higher prices have been the main driver of growth, reflecting growing demand for protein in emerging countries and some temporary factors, such as drought in the United States and disease outbreaks such as African Swine Fever in meat importing countries.
Changes in Australian agriculture can be seen through compositional shifts in its output. Over the last 30 years, production of horticultural commodities, meat, oilseeds and pulses have grown to account for much larger shares of production while livestock products (wool and milk) account for much less (Figure 5).
Figure 5 Australian agriculture's production volumes, 1994-95 to 1998-99 average and 2020-21 to 2024-25 average
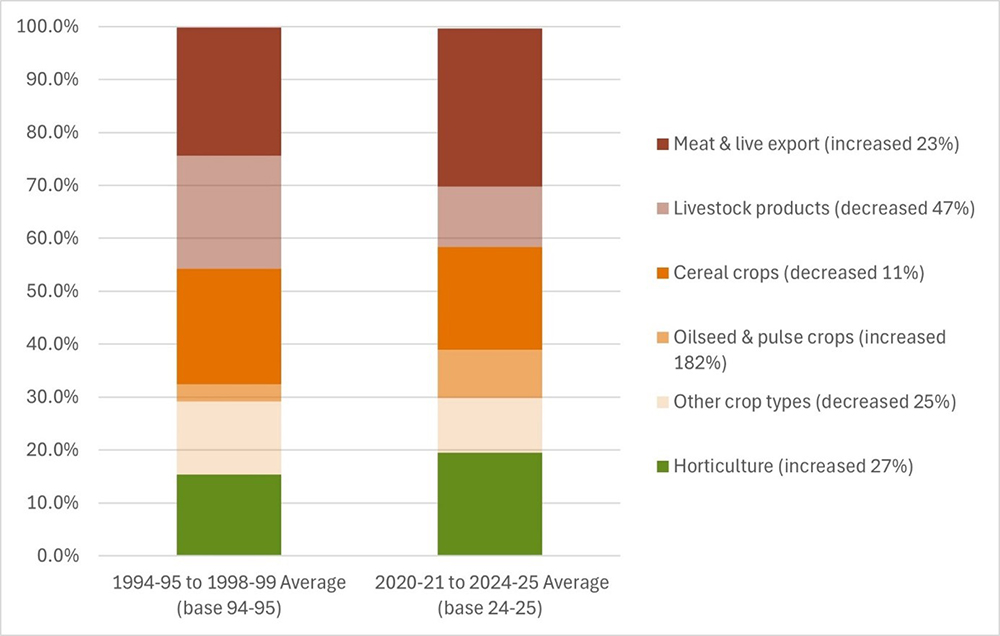
Notes: Commodity group contribution by volume to total agricultural output, 1994–95 to 1998–99 average and 2020–21 to 2024–25 average. Based on chain volume measures. Base years of 1994–95 and 2024–25 were used for the 5-year ranges shown to minimise the effect of non-additivity on category shares. The Other crop types category includes wine grapes, sugar cane, cotton and fodder crops.
In the three years to 2024-25 Australia exported 71% of agriculture's production, by volume. The export orientation of each industry can vary by commodity type. Wheat and beef, which are large sectors, are more export-focused than dairy, horticulture and pigs and poultry (Figure 6).
Figure 6 Australian agriculture's exports, share by commodity, 2022–23 to 2024–25 average
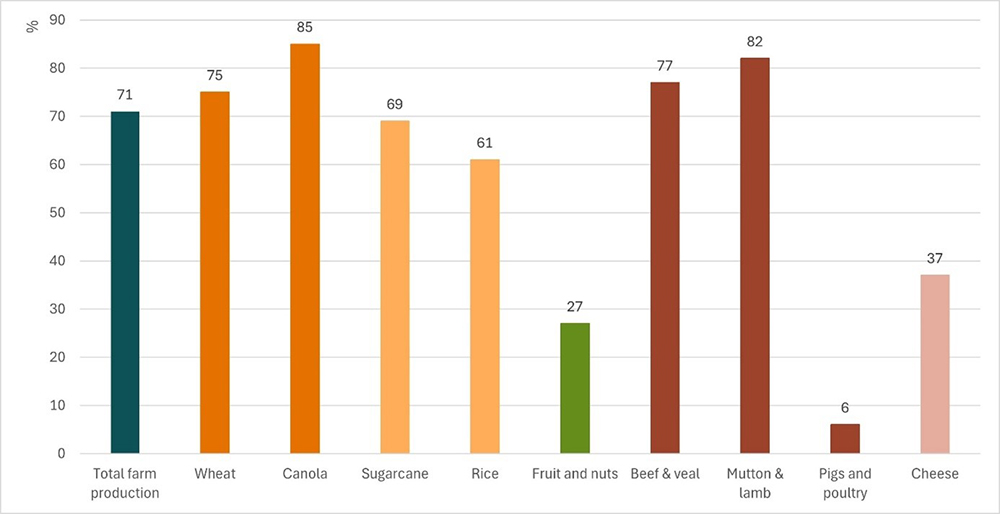
Note: Share of agriculture's production exported by sector, 3-year average, 2022–23 to 2024–25.
The value of agricultural, fisheries and forestry exports has increased by 60% in the past 20 years in real terms (expressed in 2024–25 dollars) from $47.5 billion in 2004–05 to $75.8 billion in 2024–25. China is the biggest single export destination for Australian agricultural, fisheries and forestry exports (Figure 7). Grains, oilseeds and pulses have been the fastest-growing agricultural export, growing at an average annual rate of 9% in real terms over the 20-year period, followed by meat and live animals (5%), and other crop exports (4%), while livestock product exports have declined at an average annual rate of 1% in real terms.
Figure 7 Exports of Australian agriculture's commodities, by country, 2004-05 to 2024-25
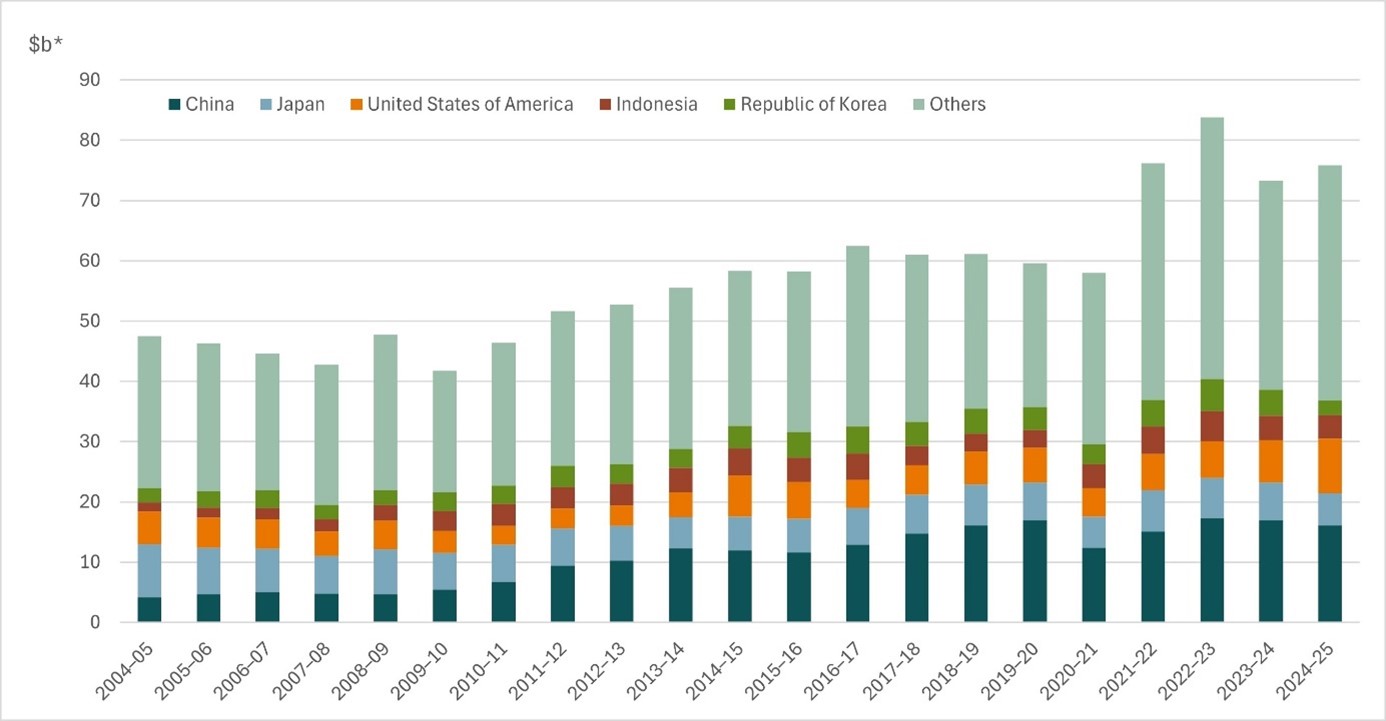
Note: *2024–25 Australian dollars.
Tariffs on agricultural products have decreased in recent decades to average 12% globally and 6% for Australian exporters (Figure 8). Declining tariff barriers have been offset by increasing non-tariff measures, which can raise costs in the supply chain, reduce profitability and reduce supply of exports to a country. Consequently, non-tariff measures have been increasingly gaining growing attention in trade policy discussions.
Figure 8 Average non-tariff measures and tariffs in agriculture
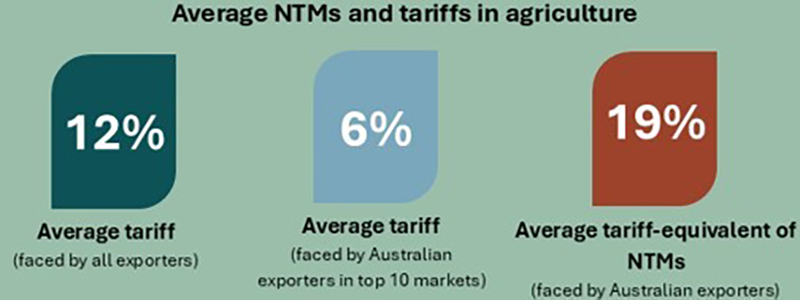
A non-tariff measure (NTM) is defined as a trade policy measure other than a tariff (noting that this is different to a barrier and does not relate to whether the policy measure is justifiable under international trade law). Agricultural NTMs can promote trade and can also reduce trade and consist mainly of sanitary and phytosanitary measures (such as food safety and plant/animal health standards) and technical barriers to trade (such as labeling, testing, certification requirements).
ABARES research (Fell & Creed 2024) has quantified the effect of agricultural non-tariff measures on Australian export quantities, finding that they are approximately equivalent to a 19% tariff. This has increased rapidly over the last decade (Figure 9). Furthermore, ABARES research (Cao 2025) found the cost to Australia’s agricultural exports exceeded $4 billion per year. The reduction and/or elimination of costly NTMs supports market diversification by reducing the cost of doing business and by removing barriers to entry into new markets. Reducing the compliance burden of these measures could bring multi-billion-dollar benefits to the agricultural sector.
Figure 9 Average tariff-equivalent of non-tariff measures faced by Australian agricultural exporters
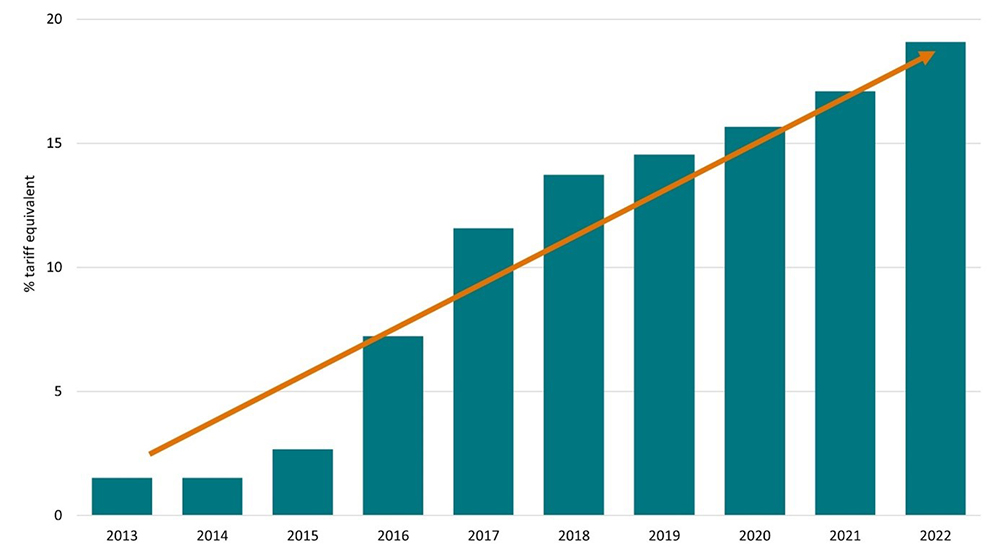
Note: Average across grains, red meat, fruit and vegetables, with constant weightings applied (one-third for grains, one-third for red meat, one-sixth for fruit, one-sixth for vegetables) to provide a rudimentary approximation of the share of Australian farm-gate production value across these commodities. The chart includes all commodities and bilateral routes, including routes where no NTMs exist.
Australia’s biosecurity system reduces the risk of exotic pest and disease incursions and the impact of pests and diseases that are already established. In the absence of these efforts, pests and diseases could cause more harm to people, animals, plants, and the environment. Freedom from many of the world’s major pests and diseases provides agricultural industries with a significant trade advantage and is important for maintaining access to valuable export markets, as well as maintaining productivity.
In the past year biosecurity challenges for agriculture have continued to evolve. Varroa mite, a parasite of the European honeybee, has now spread across Eastern Australia threatening horticultural crop pollination. Varroa has been declared as established and widespread in NSW and ACT and has been detected in locations throughout Victoria, with detections increasing in the last few months of 2025. Varroa was recently detected in eastern South Australia near Adelaide and in southern Queensland including near Brisbane, the Gold Coast and Sunshine Coast. Since its arrival Varroa has impacted multiple agricultural sectors. Varroa and drought conditions were jointly attributed to causing a 17% loss in NSW registered commercial beekeepers in 2025 (NSW DPI 2025), and Varroa is associated with increasing costs of pollination services for horticultural species (NSW DPI 2024).
Horticulture has also been threatened by an outbreak of Potato Mop-Top Virus (Pomovirus solani) (PMTV) in Tasmania, the first detection of PMTV in Australia (TAS NRE 2025). In September 2025 it was accepted that PMTV was not technically feasible to eradicate from Australia. While this virus poses no food safety or health risks, PMTV could affect production yields, by damaging the leaves, shoots and tubers of potato plants, as well as distorting the skin and flesh. However, the virus is found in most potato producing regions globally, and can be managed through good biosecurity hygiene practices, crop rotation and industry awareness of symptoms. New South Wales, Victoria and South Australia have implemented restrictions on the movement of unprocessed Tasmanian potatoes and other risk items such as equipment used in potato production, to reduce the chance of spread to the mainland.
Avian influenza viruses remain a significant risk to Australia's poultry meat and egg industries (ABARES 2025a). Australia has officially declared the eradication of H7 high pathogenicity avian influenza (HPAI) in poultry. However, the risk of future outbreaks remains, including if the high pathogenic H5 strain is introduced into mainland Australia via migratory birds. This strain continues to have significant impacts on poultry production systems overseas. Australia remains free of other significant livestock diseases such as Foot-and-mouth disease (FMD) and lumpy skin disease (LSD), which are present in near neighbouring countries.
Labour is a key input to Australian agriculture. According to the latest Australian Bureau of Statistics (ABS) Labour Force Survey (ABS 2025e), the Australian agricultural sector employed 247,000 people on average over the four quarters to November 2025, down 10.3% from the previous year and 11.6% from a decade earlier. Sheep, beef cattle and grain farming is the largest employer by industry, followed by fruit and tree nut growing, and nursery and floriculture production (Figure 10).
Figure 10 Employment by agricultural industry, 2015 and 2025
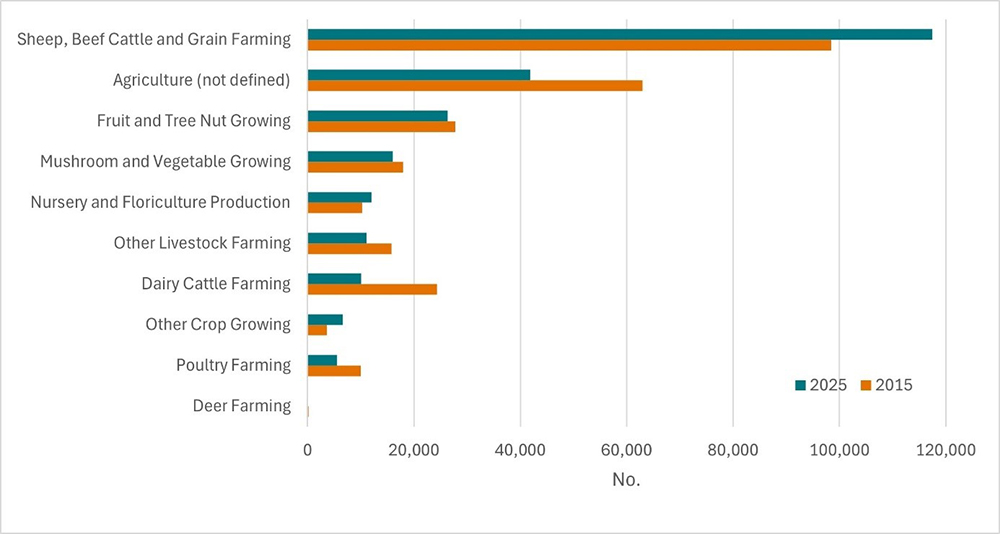
Note: Annual averages.
The broader ABS Labour Account, which also includes employed short-term non-residents and counts secondary jobs, reveals a higher estimate of 354,600 employed people in agriculture on average over the four quarters to September 2025 (ABS 2025d), down 0.2% from the previous year and 9.1% from a decade earlier. Even so, official statistics do not easily capture seasonal workers, labour hire workers and the agricultural workforce that extends beyond the farm gate, meaning that there are limitations in how completely and accurately the workforce can be counted (Capel 2024).
Variation in total employment on farms throughout the year occurs almost entirely through changes in the use of casual and contract labour. The number of casual and contract workers employed on farms peaks in late summer and is at its lowest in late winter, reflecting the timing of labour-intensive operations, such as planting and harvest. Horticultural farms tend to use relatively large amounts of casual and contract labour at key times of the year (Figure 11), while broadacre and dairy farms tend to use this kind of labour to a lesser extent and more consistently through the year.
Figure 11 Horticulture farm casual and contract labour use, July 2019 to June 2025
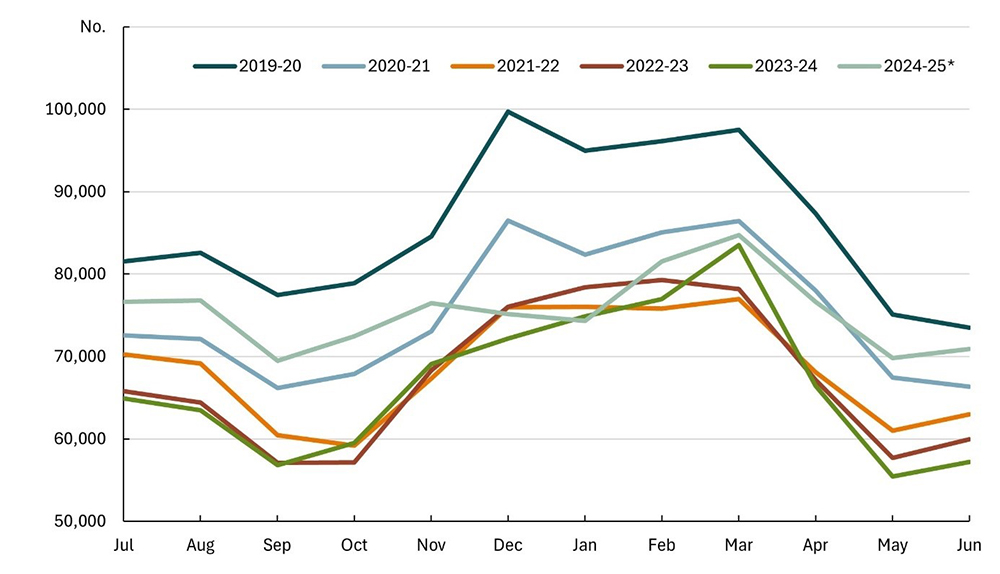
Note: *Preliminary.
Recent farm performance relative to longer-term averages provides important context for understanding developments in agricultural industries. In this section we compare averages over the three years to 2024–25 with longer-term averages, drawing out key insights by industry.
Cropping and dairy outperform long-term averages while other industries maintain near-trend outcomes.
Over the 3 years to 2024-2025, average incomes for cropping and dairy farms considerably exceeded the longer-term average, where as beef and sheep farms underperformed relative to the longer-term average (Figure 12).
Figure 12 Average farm cash income per farm, by industry, Australia
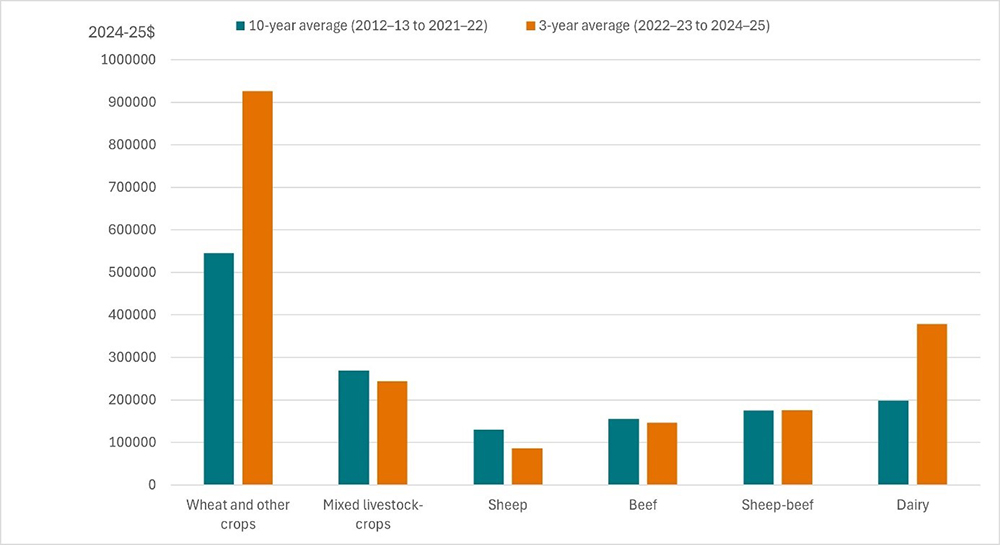
Note: Data expressed in 2024–25 dollars.
In 2023–24, there were declines in average farm cash incomes across all industries due to dry conditions and lower commodity prices. In 2024–25 average farm incomes are estimated to have rebounded across cropping and dairy farms, driven by improved prices and favourable seasonal conditions in key regions (ABARES 2025a).
For livestock farms, lower farmgate prices and below average rainfall in key areas resulted in the 3-year average to 2024–25 underperforming relative to the 10-year average (2012–13 to 2021–22). However, the downturn for livestock farms was partly offset by high turn-off rates, reducing the impact of lower prices on farms.
Strong prices and favourable seasonal conditions in 2022–23 led to record high incomes for cropping and dairy farms, offsetting the lower incomes recorded in 2023–24. In 2024–25, an increase in income is estimated for cropping and dairy farms, resulting in the 3-year average significantly outperforming the longer-term average.
For the wheat and other crops industry (specialist cropping farms), the 3-year average farm cash income of $925,900 is well above the longer-term average of $545,300, driven by strong prices for wheat, barley and grain legumes. Despite the overall average increase, significant differences in income across regions reflect differing growing conditions.
For mixed livestock-crops farms, lower receipts from sheep, wool and beef cattle more than offset higher receipts from crops, which meant the 3-year average to 2024–25 was only slightly below the longer-term average of $268,800.
Beef industry farm incomes fell substantially in 2023–24 following drier conditions and lower prices received for beef cattle, with incomes estimated to have bounced back in 2024–25 as beef prices recovered. As a consequence, the 3-year average to 2024–25 was just below the longer-term average of $155,300.
Sheep industry farm incomes fell due to unfavourable seasonal conditions in 2023–24 in addition to sharp declines in prices for sheep, lambs and wool. Despite average incomes for the sheep industry increasing substantially in 2024–25 due to stronger prices, the 3-year average farm cash income was well below the longer-term average of $130,000. (ABARES 2025a).
The sheep-beef industry includes farms that produce a mix of sheep and beef cattle. Most of these farms are located in New South Wales and Victoria, in regions that were less affected by dry seasonal conditions than specialist sheep or beef producers. As a result, the 3-year average farm cash income for sheep-beef farms is expected to perform in line with the longer-term average.
The 3-year average farm cash income for dairy farms is estimated to have outperformed the longer-term average income of $198,000 due to record high milk prices, and above average seasonal conditions in key areas which helped to constrain fodder costs (Topp, Ryder, & Smith 2025).
Broadacre and dairy farms accounted for an estimated 53,400 farm businesses in 2023–24, with 62% classified as livestock farms, 30% cropping farms and 8% dairy farms.
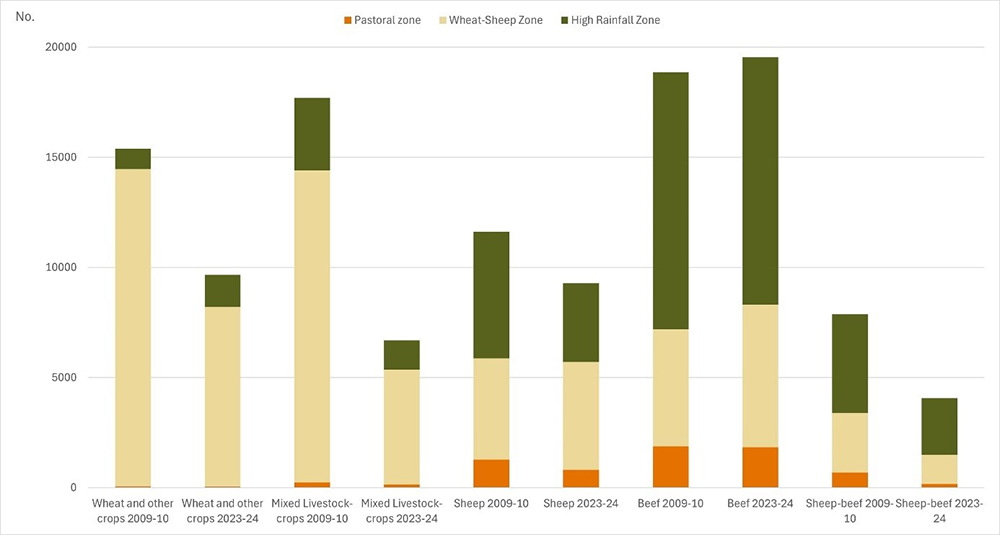
Between 2009–10 and 2023–24, overall broadacre farm numbers fell by an estimated 9% from 59,000. The most significant decline in broadacre farm numbers occurred within the mixed-livestock industry in the wheat-sheep zone, where considerable amalgamation of farms into larger enterprises focussing on cropping has taken place (Figure 13).
Figure 13 Number of broadacre farms, industry by zone, 2009-10 to 2023-24
Over the longer term, farm incomes have been adversely affected by trends toward higher temperatures and lower winter rainfall. ABARES latest modelling estimated that changes in seasonal conditions over the period 2001 to 2023 (relative to 1951 to 2000) reduced annual average broadacre farm profits by 18%, or around $28,500 per farm (ABARES 2025d). These impacts have been most pronounced in south-western and south-eastern Australia, with northern Australia and the coastal higher rainfall zones tending to be less affected (Figure 14).
Figure 14 Effect of recent seasonal conditions on farm profit, 2001–2023
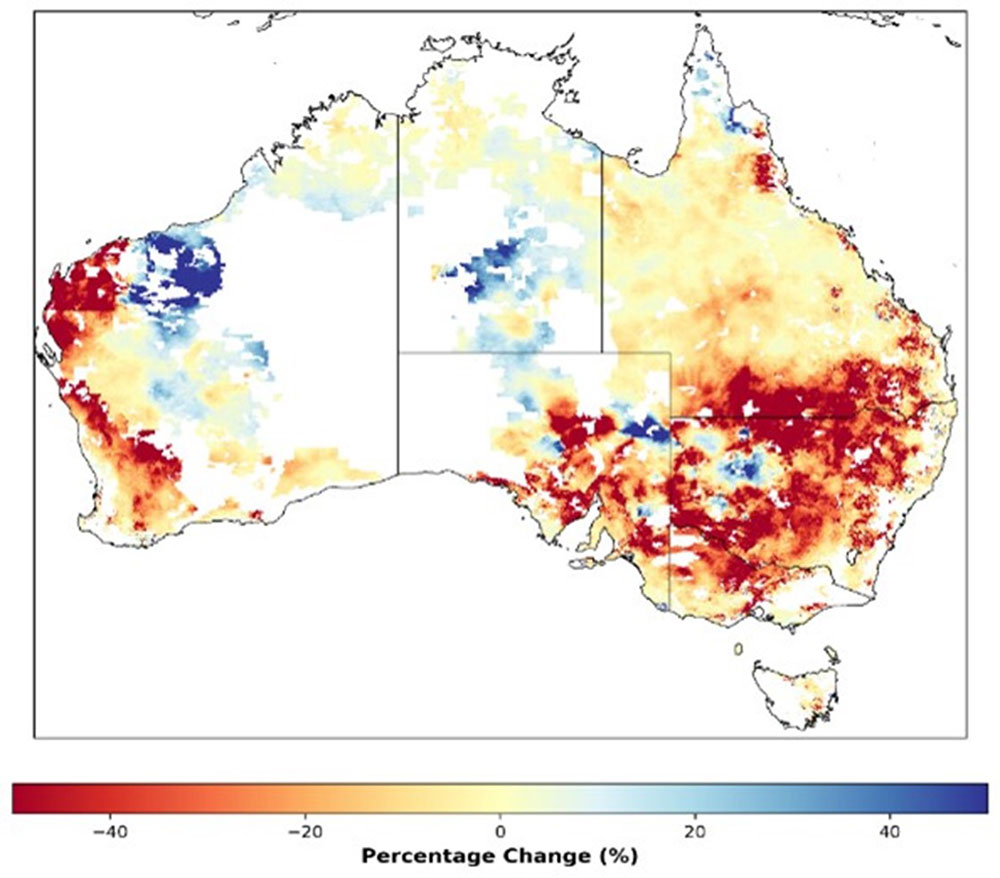
Note: Change in average annual farm profitability 2001-2023 relative to 1950-2000. Annual farm profitability is simulated by applying historical climate conditions to fixed farm characteristics based on the last ten years of observed Australian Agricultural and Grazing Industries Survey data. This analysis isolates the impact of changes in climates conditions on farm profitability; other exogenous inputs including commodity prices and farm inputs are held constant.
The effects of climate variability on farms are complex and can vary greatly across locations, farm types and sizes. On average, cropping farms face greater climate risk than livestock farms, whereas the risk associated with price variability is larger for livestock farms than cropping (Figure 15).
Figure 15 Changes in annual broadacre farm profitability^ due to climate and price risks
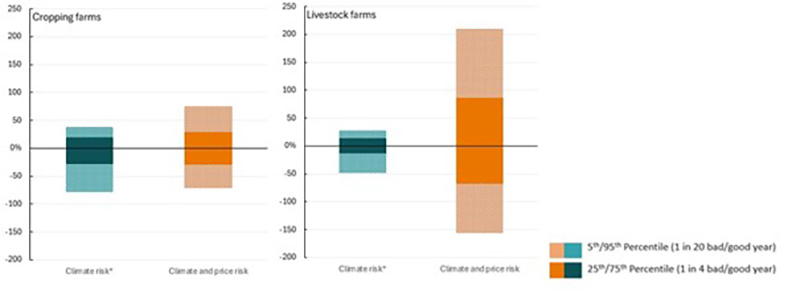
Note: Farm profitability is simulated by applying historical climate conditions and commodity prices over the past 3 years (2022-23 to 1989-90) to the 2022-23 farm cohort, holding farm characteristics constant. Profit outcomes for the past 33 years are ordered by percentile (solid bars represent 25th-75th percentiles, shaded bars represent 5th-95th percentiles).
^Change in profit is presented relative to the median year. *Change in profitability given historical climate conditions, commodity prices held constant (isolated impact of climate on profitability). For more information see Hughes et al. 2020.
In drought years, cropping farms are subject to large declines in production and revenue due to reduced crop yields, while livestock farms can partially offset drought impacts in the short-term by increasing livestock sales i.e., de-stocking (Hughes et al. 2019).
Australian farmers have a number of strategies for managing risks associated with short term fluctuations in climate, including maintaining relatively high levels of equity, liquid assets and borrowing capacity, using inputs conservatively, diversifying across enterprises and locations and earning off-farm income.
Exposure to climate variability and drought risk varies across Australia but is generally higher in drier in-land agricultural zones compared with high-rainfall coastal zones (ABARES 2025d). Price variability can be managed by cropping farms better than livestock farms due to cropping farms having typically more diverse production and storage.
Productivity is a core economic measure of agricultural industry performance. It is a measure of how well farm inputs — labour, land, capital, materials and services, have been used by farmers to generate outputs such as milk, wheat, livestock and wool. Productivity and profit are closely linked, and in the long-run, productivity growth is an important lever for improving profitability. Productivity grows when farm outputs have increased relative to the inputs used. Assuming constant prices, more output means more revenue, and fewer inputs means lower costs. Prices are also closely linked with profitability but are outside the control of most price-taking farms in Australia.
Australian agricultural productivity has a strong history, outperforming most other industries in the Australian economy. This is despite a widespread productivity slowdown impacting most parts of the Australian economy over the last two decades (Chancellor and Boult, 2024). While agricultural productivity is not immune from this slowdown, it continues to outperform most other industries, reflecting a strong sector underpinned by a robust innovation system.
Across Australia’s agricultural sector, productivity performance has varied significantly by industry and commodity type. Cropping industry productivity growth has outpaced that of the livestock industries. Average annual productivity growth was 1.6% per year on average over the period from 1977–78 to 2023–24 for the cropping industry, whereas specialist sheep and beef industry productivity averaged 0.5% per year and 0.6% per year on average, respectively. Cropping sector productivity has benefited extensively from increasing average farm size through consolidation, capital deepening, technology adoption, and improvements in management practices (Figure 16).
Figure 16 Average annual productivity growth rate, by industry, 1977–78 to 2023–24
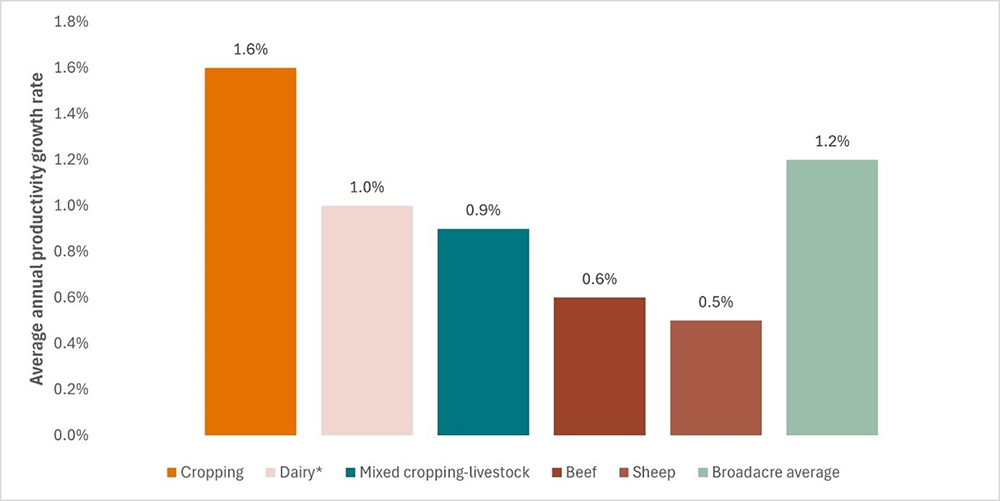
Note: Dairy industry productivity growth rate start year is 1978-79.
In addition to differences by industry, productivity performance has varied by state and region. An ABARES report identified that the Australian dairy industry had experienced differences in productivity growth across different production regions (Chancellor and Greenville, 2025). Over the period from 1978–79 to 2023–24, average annual productivity growth in the dairy industry nationally was 1.2% per year on average. However, productivity growth across individual dairy regions has varied, particularly when comparing irrigation regions to those in high natural rainfall areas. This analysis reveals Australian dairy is operating as a multispeed industry (Figure 17).
Figure 17 Average annual productivity growth rate, by dairy region, 1978–79 to 2023–24
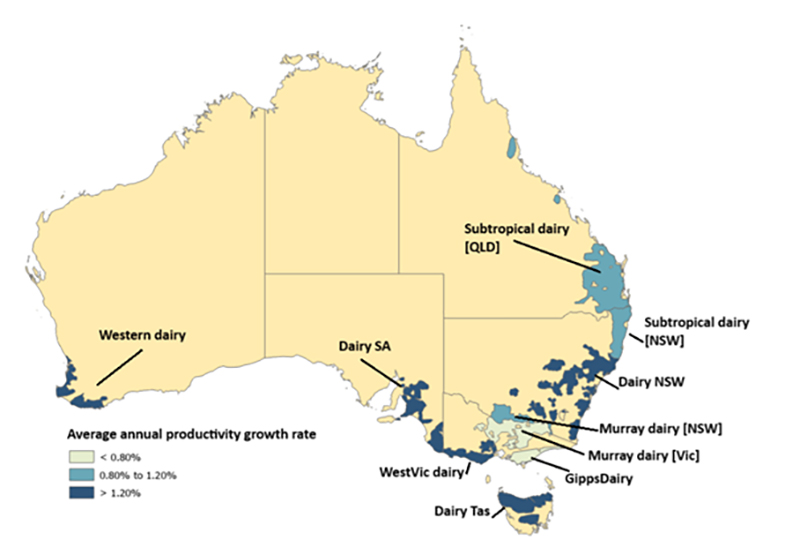
Note: Colour scale represents average long‑run productivity growth, such that darker blue represents a higher average long‑run productivity growth rate and lighter blue represents a lower average long‑run productivity growth rate.
Investment in innovation and research and development (R&D) is key to maintaining and boosting productivity growth. However, there is often a significant time lag between investment, the research and development taking place, and on-farm adoption. Therefore, investments made (or not made) now will be realised well into the future. The R&D framework and investment levels are strong in Australia; however, it is important that investment stays at relatively high levels. ABARES has estimated that for every $1 of investment in agricultural R&D, there is a return of approximately $8 over 10 years (Chancellor, 2023).
Over the medium to longer term, productivity gains are likely to be brought about through innovation and the adoption of new technology, exits of farm businesses with lower profitability and productivity, refinement in enterprise mix, and increases in scale. These productivity gains will be important to maintaining and boosting profitability, by offsetting increases in input prices or declines in commodity prices.
Natural Resource Management (NRM) involves practices that manage natural resources or reduce net emissions. In 2024, ABARES conducted a supplementary survey of farm practices and attitudes related to NRM, emissions reduction and drought resilience. Over the three years to 2023–24, 92% of broadacre and dairy farms used at least one surveyed NRM practice. Collectively, these farms accounted for 96% of broadacre output (Ryder and Kingsmill 2025).
When separated by zone, 95% of broadacre farms in the wheat-sheep zone and 92% of farms in the high rainfall zone used at least one of the surveyed NRM practices, compared with only 59% of broadacre farms in the pastoral zone. These differences are partly because many of the practices are not relevant to farming activities in the pastoral zone.
Some practices were more prevalent than others. The most prevalent practices included soil testing (57% of broadacre and dairy farms in the 3 years to 2023–24), reducing the amount of fertiliser used (46%) and stubble retention (45%). Less prevalent practices included use of climate-related land management tools (10% of farms), covering crops (13%) and strategies to minimise the impacts of climate change (15%) (Figure 18).
Figure 18 NRM practices, broadacre and dairy farms, 2021–22 to 2023–24
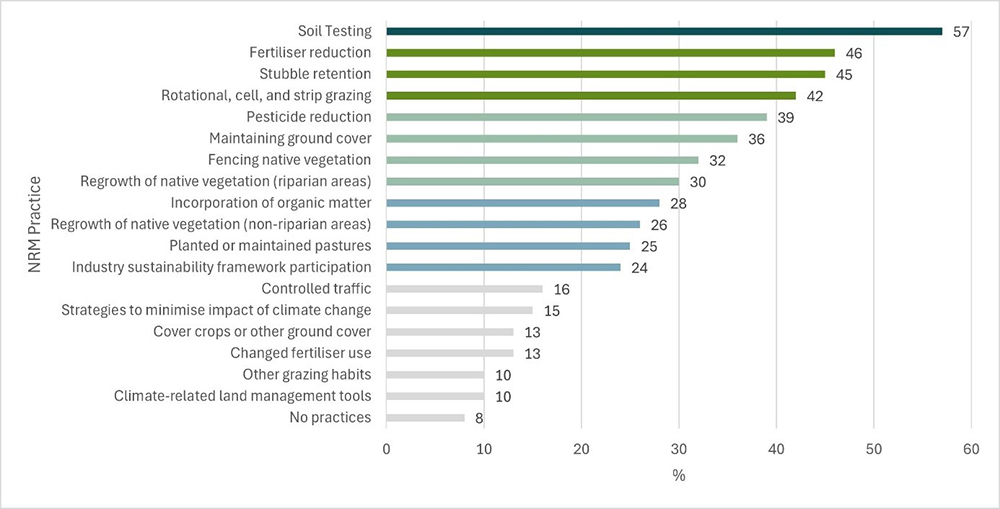
The use of each NRM practice is affected by the mix of production activities undertaken on-farm. For example, stubble was retained by 45% of all broadacre and dairy farms in the 3 years to 2023–24, with 69% of farms with crops retaining stubble. Rates of stubble retention were particularly high on wheat and other crops farms, with 97% of farms in this industry retaining stubble.
There is interest in expanding the use of NRM practices with 18% of broadacre and dairy farms expecting to undertake at least one new on-farm activity to manage natural resources or reduce net emissions within the following two years. Of these farms, 98% had used at least one NRM practice in the 3 years to 2023–24.
Among broadacre and dairy farms, only 7% of farmers indicated they knew their farm’s net greenhouse gas emissions. A further 12% of broadacre and dairy farms expressed that they would like to know their farm’s greenhouse gas emissions, while 69% expressed that they did not want to know their farm’s emissions.
Farmers report using NRM practices for practical business reasons. Around 80% of farms surveyed said they used NRM practices to improve their farm’s sustainability. A similar proportion of farms also indicated that the NRM practices they used were to reduce costs or increase output.
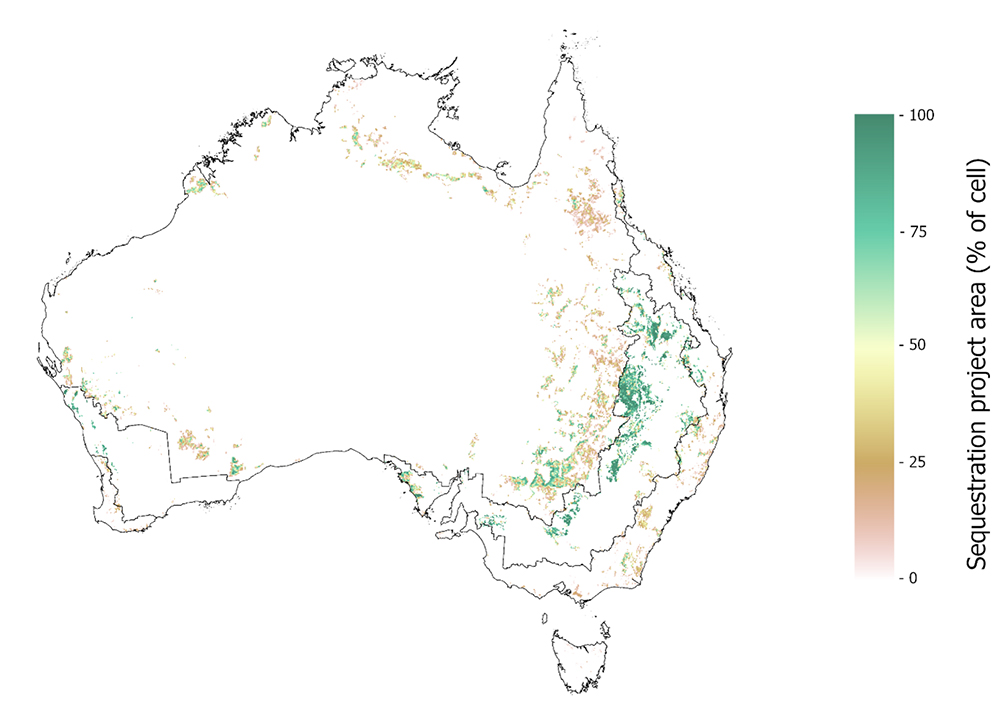
Land-based sequestration will contribute significantly to the transition to net zero greenhouse gas emissions. Recent Treasury modelling (Treasury 2025) estimated 119 million tonnes of land-based sequestration would be required in 2050 to achieve net zero. Based on this scenario, Whittle et al. (2025) estimated an additional 18 million hectares of agricultural land would be covered in sequestration projects through environmental plantings or managed regeneration via the Australian Carbon Credit Unit (ACCU) scheme (Figure 19). However, this is only an illustrative scenario. Different outcomes are possible under different carbon price paths, or when considering additional land-based sequestration methods.
Figure 19 Estimated location of sequestration projects undertaken between 2025 and 2050, 119MT scenario
Land-based sequestration projects generate benefits to landholders through sequestration revenue and potentially productivity and amenity benefits. There are also benefits to the broader economy by providing lower-cost alternatives to other abatement activities. Sequestration projects are estimated to yield $9 billion in annual profits to landholders in 2050 and reduce costs of offsetting emissions in other parts of the economy by $7 billion annually in 2050.
Agricultural revenue is expected to increase by 39% between 2025 and 2050, despite a 2% displacement of agricultural production by 2050 due to sequestration. The impact on agriculture is moderated by many participating farmers opting for a mix of sequestration and agricultural production.
Sequestration projects will be widely spread throughout Australia, and will have little impact on most regional communities, although there are exceptions. Concentrated regional impacts can be largely eliminated by policies that restrict the ability of landholders to undertake sequestration projects, but these policies impose significant costs on landholders and the broader economy.
The ACCU market will be crucial to ensure a smooth and efficient transition. This hinges on the ability of landholders to undertake credited sequestration projects regardless of location, to choose the best sequestration method for their circumstance, and to continue grazing livestock among the vegetation (provided this does not undermine sequestration). Access to these options is critical to delivering the level of land-based sequestration presented in the Net Zero Plan scenario, in a way that works for the agricultural sector, regional communities, and all Australians.
ABARES 2024, Catchment Scale Land Use of Australia – Update December 2023 version 2, Australian Bureau of Agricultural and Resource Economics and Sciences, Canberra, DOI: https://doi.org/10.25814/2w2p-ph98.
ABARES 2025a, Agricultural Commodities: December quarter 2025, Australian Bureau of Agricultural and Resource Economics and Sciences, Canberra, DOI: https://doi.org/10.25814/seg6-pk47.
ABARES 2025b, Australian Farm Productivity – Broadacre and Dairy Estimates, Australian Bureau of Agricultural and Resource Economics and Sciences, Canberra, accessed 16 January 2026.
ABARES 2025c, Australian forest and wood products statistics (AFWPS), Australian Bureau of Agricultural and Resource Economics and Sciences, Canberra, accessed 2 February 2026.
ABARES 2025d, Australian gridded farm data, Australian Bureau of Agricultural and Resource Economics and Sciences, Canberra, November, DOI: https://doi.org/10.25814/7ftz-9j87.
ABS 2022, Agricultural Commodities, Australia, Australian Bureau of Statistics, Canberra.
ABS 2024, Water Account, Australia, Australian Bureau of Statistics, Canberra, accessed 21 January 2026.
ABS 2025a, Australian National Accounts: National Income, Expenditure and Product, Australia, Australian Bureau of Statistics, Canberra.
ABS 2025b, Balance of Payments and International Investment Position, Australia, Australia, Australian Bureau of Statistics, Canberra.
ABS 2025c, International Trade in Goods, Australia, Australian Bureau of Statistics, Canberra.
ABS 2025d, Labour Account Australia, Australian Bureau of Statistics, Canberra, accessed 2 January 2026.
ABS 2025e, Labour Force, Australia, Detailed, Australian Bureau of Statistics, Canberra, accessed 2 January 2026.
Cao, L 2025, A new stylised approach of modelling non-tariff measures in a CGE model, ABARES technical report, Australian Bureau of Agricultural and Resource Economics and Sciences, Canberra, June 2025.
Capel, L 2024, Defining the agricultural workforce, ABARES research report, Australian Bureau of Agricultural and Resource Economics and Sciences, Canberra, February, DOI: https://doi.org/10.25814/rf44-kp75.
Chancellor, W. and Greenville, J 2025, The ‘multispeed’ industry: Dairy productivity in the spotlight, ABARES Insights, Canberra, November, DOI: https://doi.org/10.25814/4hhw-m486.
Chancellor, W. & Boult, C 2024, Australia’s farm productivity slowdown – why it matters, and what it means for policy makers, ABARES Insights, Canberra, July, DOI: https://doi.org/10.25814/dcvj-7934.
Chancellor, W 2023, Agricultural research and development investment in Australia, ABARES research report, Canberra, March, DOI: https://doi.org/10.25814/2d90 zk45.
Hughes, N, Galeano, D & Hattfield-Dodds, S 2019, The effects of drought and climate variability on Australian farms, ABARES, Canberra, DOI: http://doi.org/10.25814/5de84714f6e08.
Hughes, N & Gooday, P 2021, Climate change impacts and adaptation on Australian farms, ABARES Insights, Canberra, DOI: http://doi.org/10.25814/589v-7662.
NSW DPI 2024, Honey and Beeswax, NSW, NSW Department of Primary Industries and Regional Development, Sydney.
NSW DPI 2025, Honey and Beeswax, NSW, NSW Department of Primary Industries and Regional Development, Sydney.
Fell, J, Creed, C 2024, Non-tariff barriers: a multi-billion dollar burden, ABARES Insights, Australian Bureau of Agricultural and Resource Economics and Sciences, Canberra, December.
Ryder, J and Kingsmill, C 2025, A Survey of Emissions and Natural Resource Management Practices in Australia, 2023–24, ABARES, Canberra, December, DOI: https://doi.org/10.25814/199t-ch57. CC BY 4.0.
TAS NRE 2025, Potato mop-top virus, Tasmania, Department of Natural Resources and Environment Tasmania, Hobart.
Topp, V, Ryder, J and Smith, J 2025, Financial performance of dairy farms, 2022–23 to 2024–25, ABARES, Canberra, July, DOI: https://doi.org/10.25814/46db-zn66. CC BY 4.0.
Treasury 2025, Australia’s Net Zero Transformation: Treasury Modelling and Analysis, The Treasury, Canberra, accessed 12 November 2025.
Whittle, L, Hone, S, Morris, L, Greenville, J & Galeano, D 2025, Sequestration on Agricultural Land: Impacts and Policy Trade-offs, ABARES Insights, Australian Bureau of Agricultural and Resource Economics and Sciences, Canberra.
ABARES Insights: Snapshot of Australian Agriculture 2018
ABARES Insights: Snapshot of Australian Agriculture 2020
ABARES Insights: Snapshot of Australian Agriculture 2021
ABARES Insights: Snapshot of Australian Agriculture 2022
ABARES Insights: Snapshot of Australian Agriculture 2023
ABARES Insights: Snapshot of Australian Agriculture 2024
ABARES Insights: Snapshot of Australian Agriculture 2025
If you have difficulty accessing these files, please email ABARES for assistance.