Most Australian water markets are highly localised, involving trade between users within a single river catchment. A key exception is the southern Murray-Darling Basin where the high degree of hydrological connectivity allows water to be traded between river systems and across state boundaries.
Authors: Tim Goesch, Manannan Donoghoe and Neal Hughes
The Snapshot of Australian Water Markets describes the main features of Australia’s water markets and details key factors influencing water prices in the Murray-Darling Basin.
[expand all]
Australian Water markets: why, where, who and how
Why do we have water markets?
The main impetus for the creation of water markets in Australia was increasing water scarcity. By the 1980s it was becoming increasingly evident that many surface water and groundwater systems were fully or over allocated (National Water Commission (NWC), 2011). This led to a number of reforms in the 1990s and 2000s, including the adoption of a cap and trade system across the major trading regions of the Murray-Darling Basin, where water users own a right to a share of the available water supply from a defined water resource (i.e. a river or dam), and have the right to trade these shares with other users.
There are two main water products in Australia: allocations and entitlements. Entitlements are ongoing rights to a share of water from a water resource each year while allocations are the volume of water allocated to an entitlement in a given year, usually expressed as a percentage of entitlement volume. Trade in entitlements represents a permanent transfer of water access rights while trade in allocations involves the temporary transfer of water within an irrigation season.
Trade allows water to be reallocated from lower value to higher value uses. Allocation trade helps irrigators adjust to short term shocks while entitlement trade facilitates longer term structural adjustment. For example, allocation trade significantly reduced the cost of the Millennium drought by allowing irrigators with permanent plantings to purchase water from irrigators in other regions in the southern connected Murray-Darling Basin (sMDB).
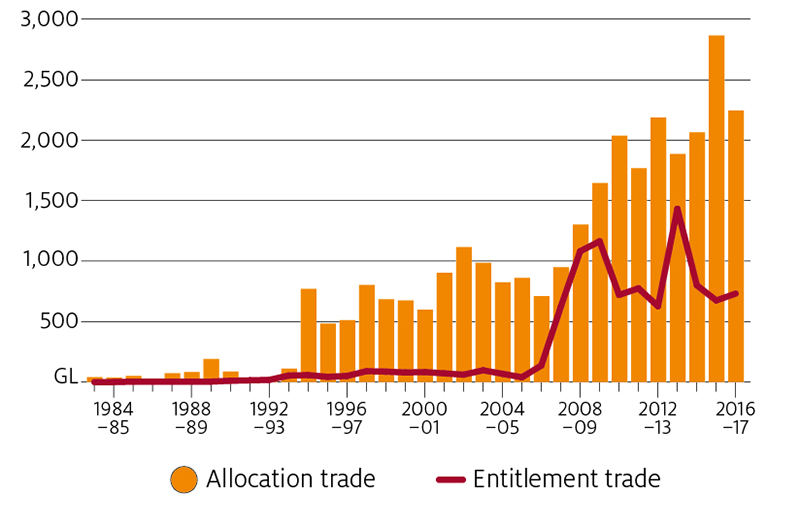
The combination of water reform, reductions in transaction costs and increases in water scarcity have resulted in a steady increase in trade in allocations and entitlements since the 1980s (Figure 1).
FIGURE 1 Annual volume of water trade in the southern MDB, 1983–84 to 2016–17Source: 1983–84 to 2009–10 taken from NWC (2011). 2010–11 to 2016–17 allocation data provided by the Murray–Darling Basin Authority, entitlement data produced internally by ABARES. Allocation data excludes environmental transfers. Entitlement data includes entitlements transferred to the Australian Government as part of the Murray-Darling Basin Plan
Where does water trading occur?
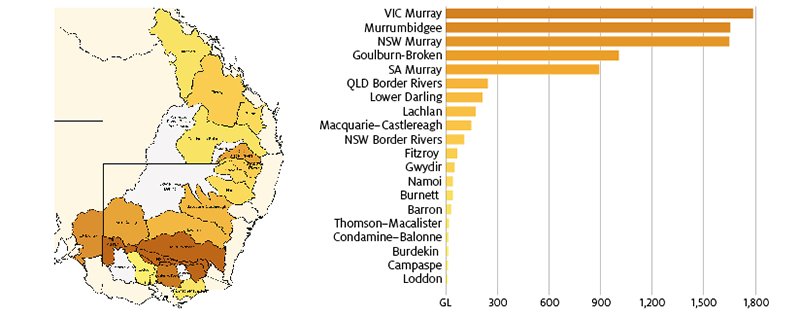
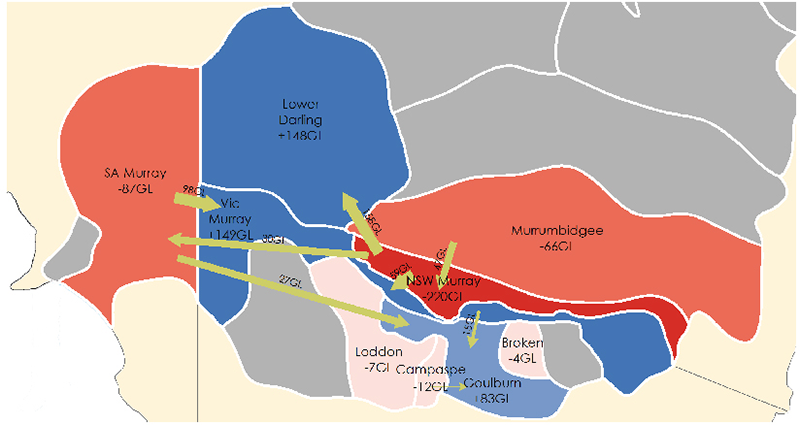
Australia’s most active water markets are in the MDB, accounting for 97 per cent of all allocation trade (Figure 2) and 77 per cent of all entitlement trade in 2016–17 (ABARES, 2018). The vast majority of this trade is in regulated surface water in the sMDB. Most Australian water markets are highly localised, involving trade between users within a single river catchment. A key exception is the sMDB where the high degree of hydrological connectivity allows water to be traded between river systems and across state boundaries (Figure 3).
How does water trading occur?
Water trade involves the voluntary transfer of water rights. The main options for accessing water markets are through water brokers and electronic exchanges. There are also some private transactions.
Buyers and sellers are free to trade water subject to water trading rules established and enforced by state government agencies. The Commonwealth also plays a co-ordinating role in the MDB to ensure that states comply with water trading rules contained in the Murray-Darling Basin Plan. A key component of these trading rules are limits on trading water between different locations. These limits are intended to reflect physical constraints on transporting water across the river system. However, this may not always be the case, with concerns that some restrictions are based on non-physical factors.
FIGURE 2 National allocation trade, by water system 2016–17Source: Australian Water Markets Report 2016–17 (ABARES)FIGURE 3 Surface water allocation net interregional trade flows, excluding environmental transfers, southern Murray-Darling Basin, 2016–17Source: Australian Water Markets Report 2016–17 (ABARES)
Who participates in Australian water markets?
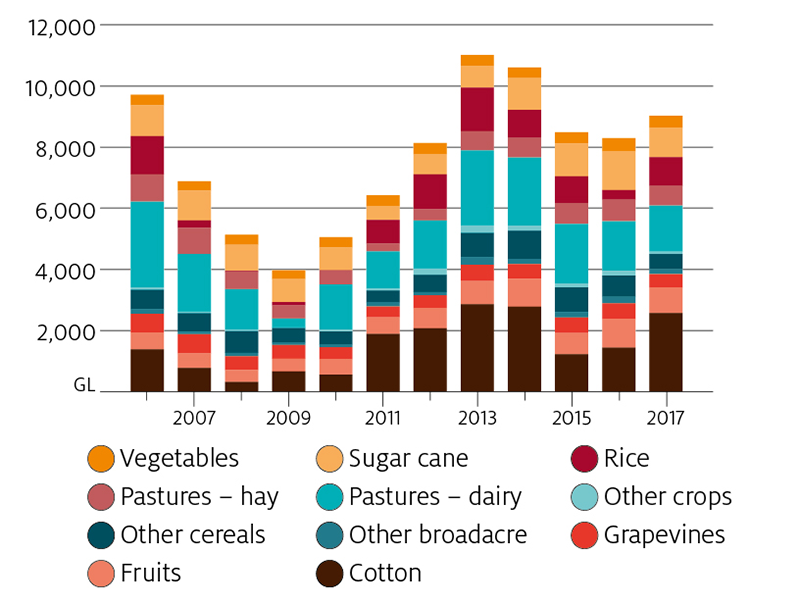
Agriculture is the main consumer of water in Australia, accounting for around 70 per cent of all extractions for consumptive use (BoM, 2018). This water is mainly used for irrigation which accounts for around a quarter of Australia’s agricultural production (ABS, 2018). National water use has varied within each industry depending on the prevailing seasonal conditions and commodity prices, however cotton and irrigated pastures have historically accounted for the majority of use (Figure 4).
FIGURE 4 National water use, by irrigated industry, 2006 to 2017Source: ABARES and ABS data
Irrigators are the main participants in Australian water markets. Other participants include urban water utilities, environmental water managers and investors. Victorian Government research (Tim Cummins & Associates, 2016) suggests that non-farm entities comprise a very small component of the water market.
Water market prices are driven by supply and demand
Water storages/allocations
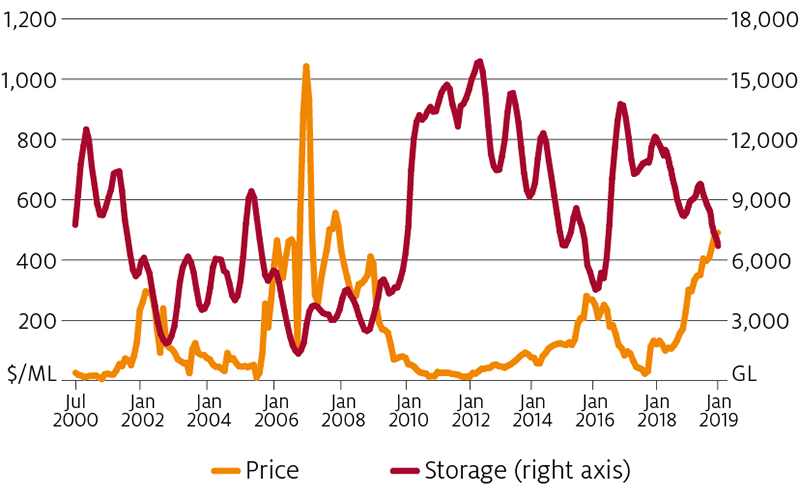
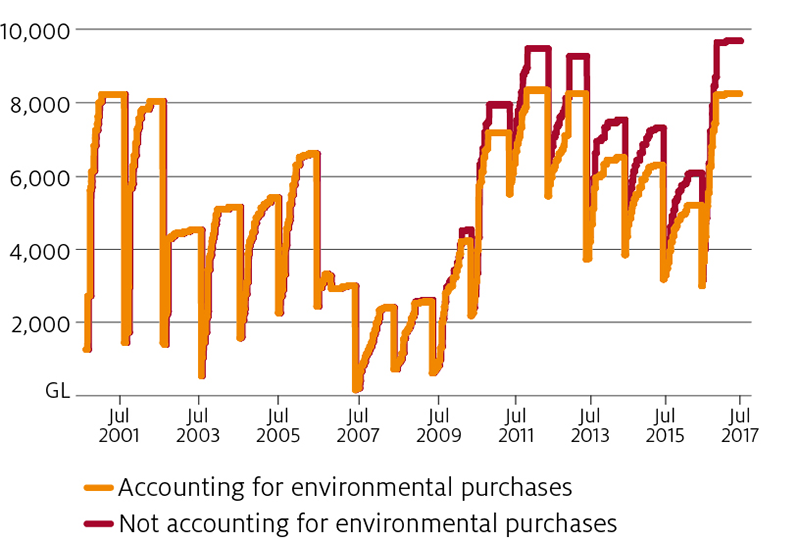
The primary driver of water prices in the sMDB is the supply of water allocations. Water allocations are determined by state government agencies based on volumes of water held in storage. As a result, allocation prices are highly dependent on weather.
Figure 5 compares water allocation prices with storage volumes in the sMDB between July 2000 and January 2019. It shows that allocation prices peaked during the worst of the Millennium drought before declining to near zero during the 2011 and 2012 floods.
FIGURE 5 Monthly allocation prices and storage volume in the southern MDB, July 2000 to January 2019Source: Volume weighted average price from BOM. Storages from Water NSW, SA Water and Goulburn-Murray Water. SMDB storages include Hume Dam, Dartmouth Dam, Yarrawonga Weir, Lake Victoria, Menindee Lakes, Blowering Dam, Burrinjuck Dam, Lake Elidon, Lake Eppalock, Cairn Curran Reservoir and Laanecoorie Reservoir
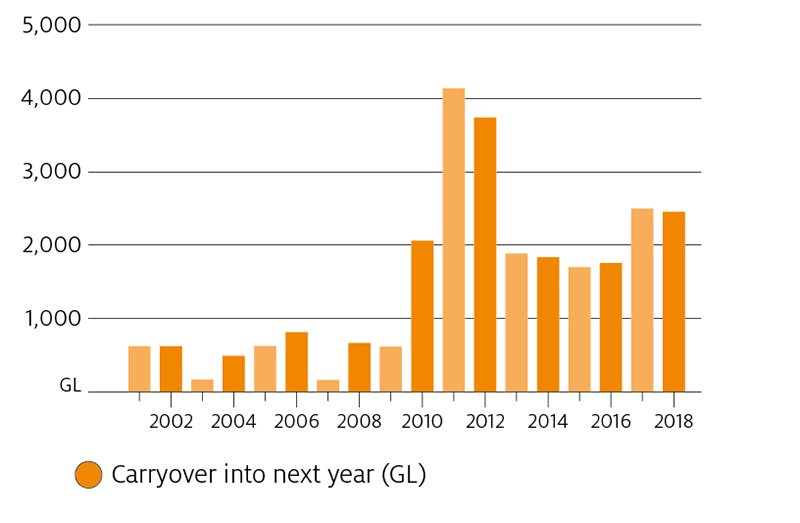
Carry over
Water availability is also influenced by carryover. Carryover allows irrigators to store water by transferring allocations between seasons. There have been significant changes to carryover rules in the sMDB over the past decade, including the introduction of carryover in Victoria and South Australia. These changes have resulted in a substantial increase in the use of carryover in years with similar seasonal conditions (Figure 6).
The increased use of carryover tends to smooth water supply and water prices: allowing more water to be set aside in wetter years to provide additional supply in dry years. Similar to water trading, carryover can significantly reduce the cost of drought. Increased carryover also changes the dynamics of the water market, with allocation prices not only dependent on current storage levels, but also on expectations of future inflows (and therefore weather forecasts) (Hughes & Goesch, 2009).
Water recovery
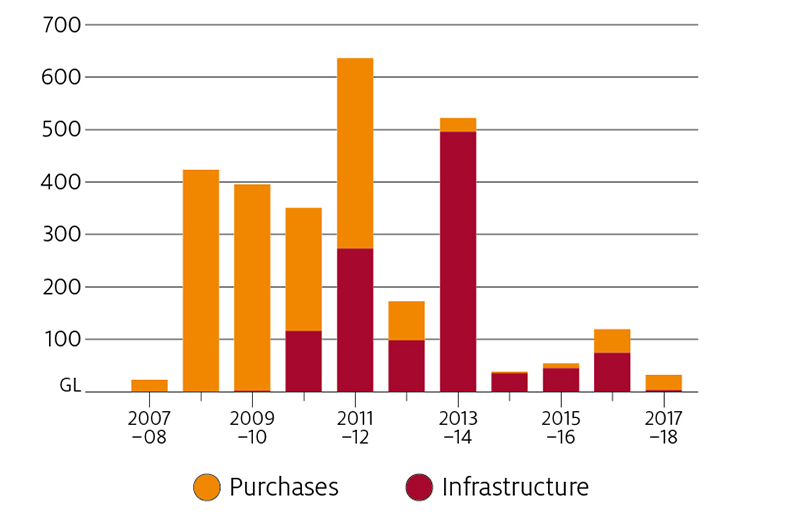
The volume of water available for irrigation is also influenced by environmental water recovery programs, such as those undertaken by the Commonwealth to meet the new sustainable diversion limits under the Murray-Darling Basin Plan (DAWR, 2018). These programs recover water rights for environmental purposes via a range of mechanisms, including through the direct purchase (buyback) of water rights from irrigators and investments in on and off-farm irrigation infrastructure.
Figure 7 shows Commonwealth water recovery in the MDB since 2007–08. At the end of June 2018 the Commonwealth had recovered around 2,100 GL of water entitlements for the environment.
Water recovery programs effectively reduce the volume of water available for irrigation. For example, Commonwealth water purchases reduced allocations to irrigation by around 14 per cent in 2015–16 (Figure 8). ABARES modelling estimates that this reduction in supply increased allocation prices in the sMDB by around $25ML on average between 2012–13 and 2014–15 (Hughes, Gupta & Rathakumar, 2016). The effects of infrastructure recovery programs on water prices is more complex than purchases because these programs can affect both the supply and demand for water.
FIGURE 7 Commonwealth water recovery, 2007–08 to 2017–18Source: custom ABARES and ABS datasetsFIGURE 8 Allocation plus carryover, with and without Commonwealth purchasesSource: Australian Water Markets Report 2016–17 (ABARES); includes regulated surface water entitlements only
Water demand
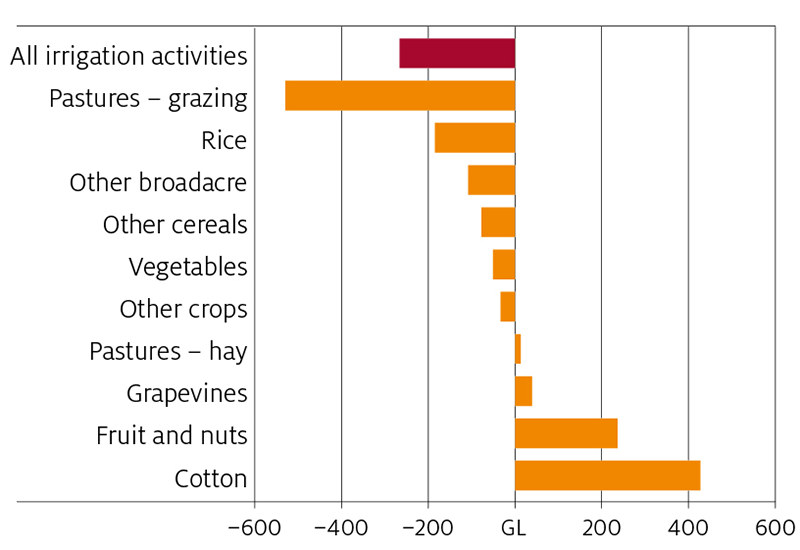
Water prices are also influenced by demand. There have been significant changes in demand in the MDB in recent years, including increases in the volume of water used to irrigate cotton in southern NSW and nuts in the Victorian Sunrasyia. ABARES recently estimated changes in water demand in the sMDB between 2002–03 and 2016–17. This analysis shows that the significant increase in demand for water for cotton and nuts has been offset by a decrease in demand for most other activities – particularly grazing pastures (dairy) and rice (Figure 9) (Gupta & Hughes, 2018). These changes in water demand are the result of long run structural changes within the irrigation industry.
FIGURE 9 Long-run changes in water use in the sMDB (2002–03 compared to 2016–17) at a price of $100/ML, by activitySource: Future scenarios for the southern Murray–Darling Basin water market (ABARES 2018)
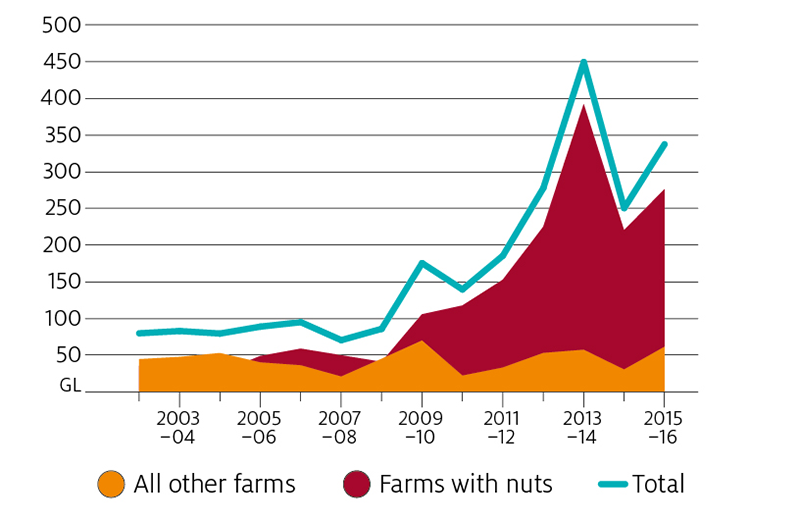
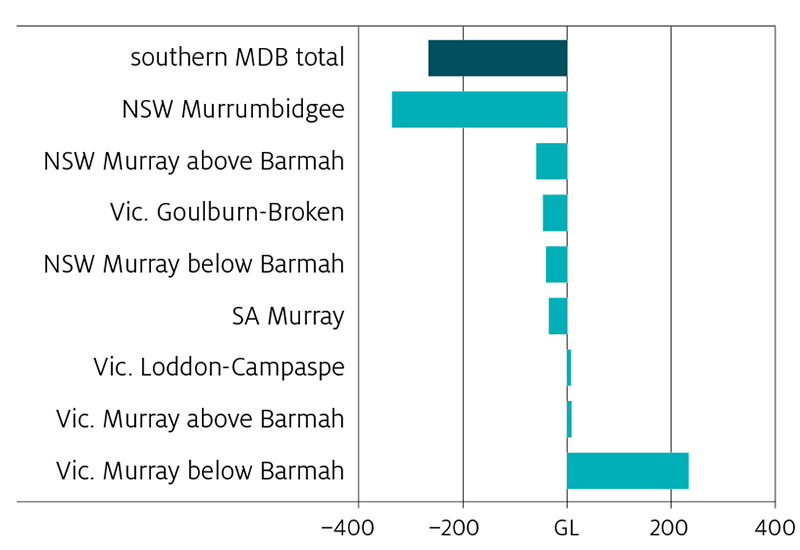
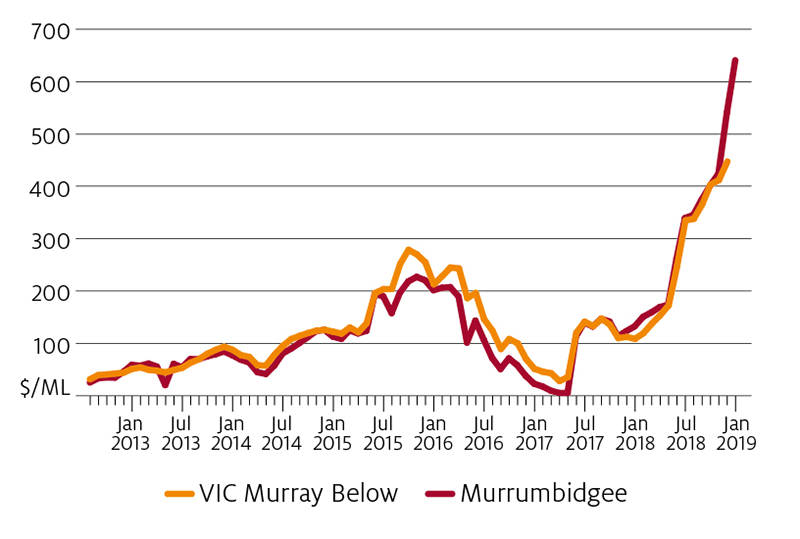
These changes in use have been facilitated by interregional trade. For example, the significant increase in water use in the Victorian Murray below the Barmah choke (Figure 10) mainly due to an expansion in almond plantings has been supported by transfers out the NSW Murrumbidgee, and more recently, out of the Victorian Goulburn system (Figure 11). This increase in interregional trade has meant that limits on trade between regions have been binding more often in recent years.
Currently there are a number of restrictions limiting trade out of upstream trading zones in the sMBD, including out of the Murrumbidgee and Goulburn systems. When these limits are reached, no more trade can occur, resulting in differences in water prices between regions. In 2016–17 the Murrumbidgee export limit was binding for most of the year, leading to allocation prices being higher in the rest of the southern connected system than in the Murrumbidgee (Figure 12). More recently, dry conditions in NSW have seen a reversal of trade flows, resulting in higher allocation prices in the Murrumbidgee relative to other regions in the southern connected system.
FIGURE 10 Water use by farm type, Victorian Murray below Barmah Choke, 2002–03 to 2015–16Source: custom ABARES and ABS datasetsFIGURE 11 Long-run changes in water use in the sMDB (2002–03 compared to 2016–17) at a price of $100/ML, by regionSource: Future scenarios for the southern Murray–Darling Basin water market (ABARES 2018)FIGURE 12 Price divergence between Victorian Murray Below and Murrumbidgee, June 2012 to January 2019Source: NSW and Victorian water registries. Data cleaned internally by ABARES
Future scenarios for the southern MDB water market
In recent years, concerns have been raised about how the sMDB water market would cope in the event of another significant drought. In particular, there have been concerns about how environmental water recovery and increases in demand for water for nuts and cotton could influence future water prices.
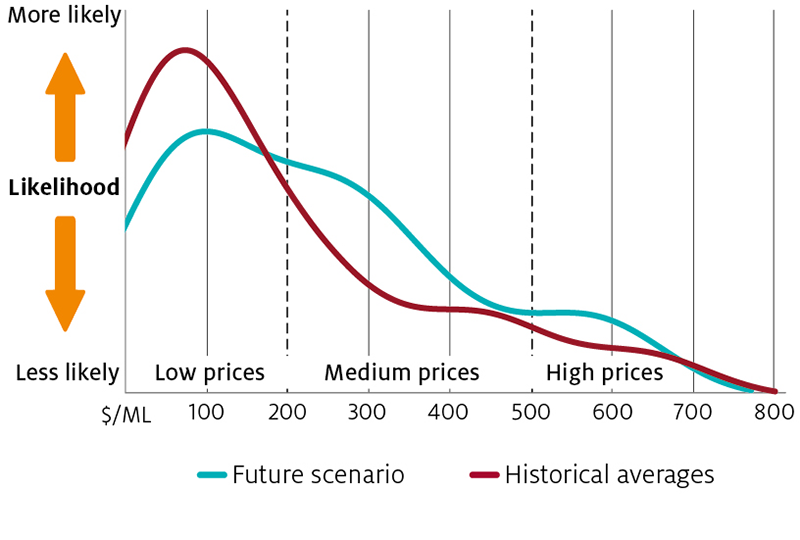
In 2018, ABARES released modelling estimates of future prices in the sMDB assuming prevailing levels of water demand, water recovery and irrigation development and a repeat of the historical climate between 2002–03 to 2016–17 (Gupta & Hughes, 2018). The results suggest that while future allocation prices are likely to be higher on average due to water recovery, they are unlikely to rise higher than those observed during the peak of the Millennium drought (this is partly due to the increased use of carryover – which tends to smooth water prices over time).
It should be noted that these results do not represent the full range of future conditions, and that it is possible that prices could rise higher than during the peak of the Millennium drought in the event of a more severe drought. In addition, the future distribution of allocation prices is likely to change, with fewer years of low prices, more years with moderate prices, and a similar frequency of very high prices (figure 13).
The modelling also found that future allocation prices could be higher in the Victorian Murray as trade constraints (out of the Murrumbidgee and Goulburn) start to bind more frequently, limiting the volume of water imported into this region (Gupta & Hughes, 2018).
In practice, future prices will depend on a number of supply and demand factors including the extent and nature of future water recovery, any further changes in the irrigation sector and the effects of climate change on rainfall, inflows and water demand.
FIGURE 13 Water price histogramSource: Future scenarios for the southern Murray–Darling Basin water market (ABARES 2018)
Future water market challenges
While water market reforms in Australia have been very successful, there remain a number of challenges.
Firstly, limits on interregional trade are likely to become more of an issue in the future given recent changes in water demand in the sMDB (including growing demand from almond plantations). The challenge here is to allow as much water trade as possible within the physical constraints of the river system. Achieving this may require further reform of water trading rules and/or rules governing the operation of the river system (For more detail see Hughes, Gupta & Rathakumar, 2016). For example, the Productivity Commission recently found that, while some trade restrictions inconsistent with Basin Plan trading rules had been removed, eleven instances of potential non-compliance remain unresolved (PC 2018).
Secondly, while the introduction of carryover in the sMDB has been a positive development, there still exists some scope to further refine carryover rules (Hughes et al, 2013). Similar to water trading, the challenge is to provide water users with as much flexibility over storage as possible subject to the physical constraints of the storage system (for example, dam capacity limits and evaporation/spill losses). In the case of the sMDB, there is potential to adopt more sophisticated water storage rights, similar to the capacity sharing and continuous accounting arrangements adopted in the northern MDB (Hughes et al, 2013).
Another challenge is around the provision of market information, particularly around prevailing market prices. At present water market price data collected by state government agencies is subject to a number of quality issues (Sanders, Hughes and Gupta, 2019). Further, while water price data is available from various private exchanges and brokers, each account for only a small proportion of market activity. A recent development in this area is the waterflow price comparison website developed under the Governments Business Research and Innovation Initiative (BRII).
References
ABARES. (2018). Australian water markets report 2016–17. Canberra: ABARES.
Australian Government Department of Agriculture and Water Resources (DAWR). (2019). Water programs in the Murray-Darling Basin. Retrieved March 15, 2019, from agriculture.gov.au/water/mdb/programs
Hughes, N., & Goesch, T. (2009). Management of irrigation water storages: carryover rights and capacity sharing, ABARE report to the National Program for Sustainable Irrigation. Canberra: ABARE. Retrieved from https://daff.ent.sirsidynix.net.au/client/en_AU/search/asset/1027742/0