
About this paper
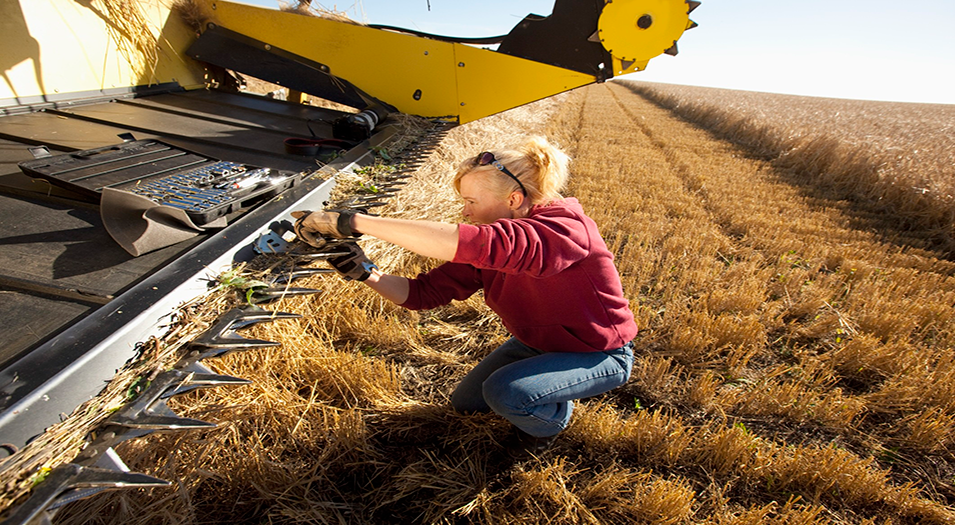
This snapshot describes Australia’s agricultural workforce, providing key information and statistics in one place, using data from the 2021 Australian Bureau of Statistics’ Census of Population and Housing.
It covers where workers live, what industries and occupations they work in, the workforce’s mobility, educational attainment and age, and hours worked.
To inform about the diverse people and communities that contribute to Australian agriculture, the snapshot also examines the involvement of women, young people, Indigenous people, people from culturally and linguistically diverse backgrounds and people with disability in the agricultural workforce.
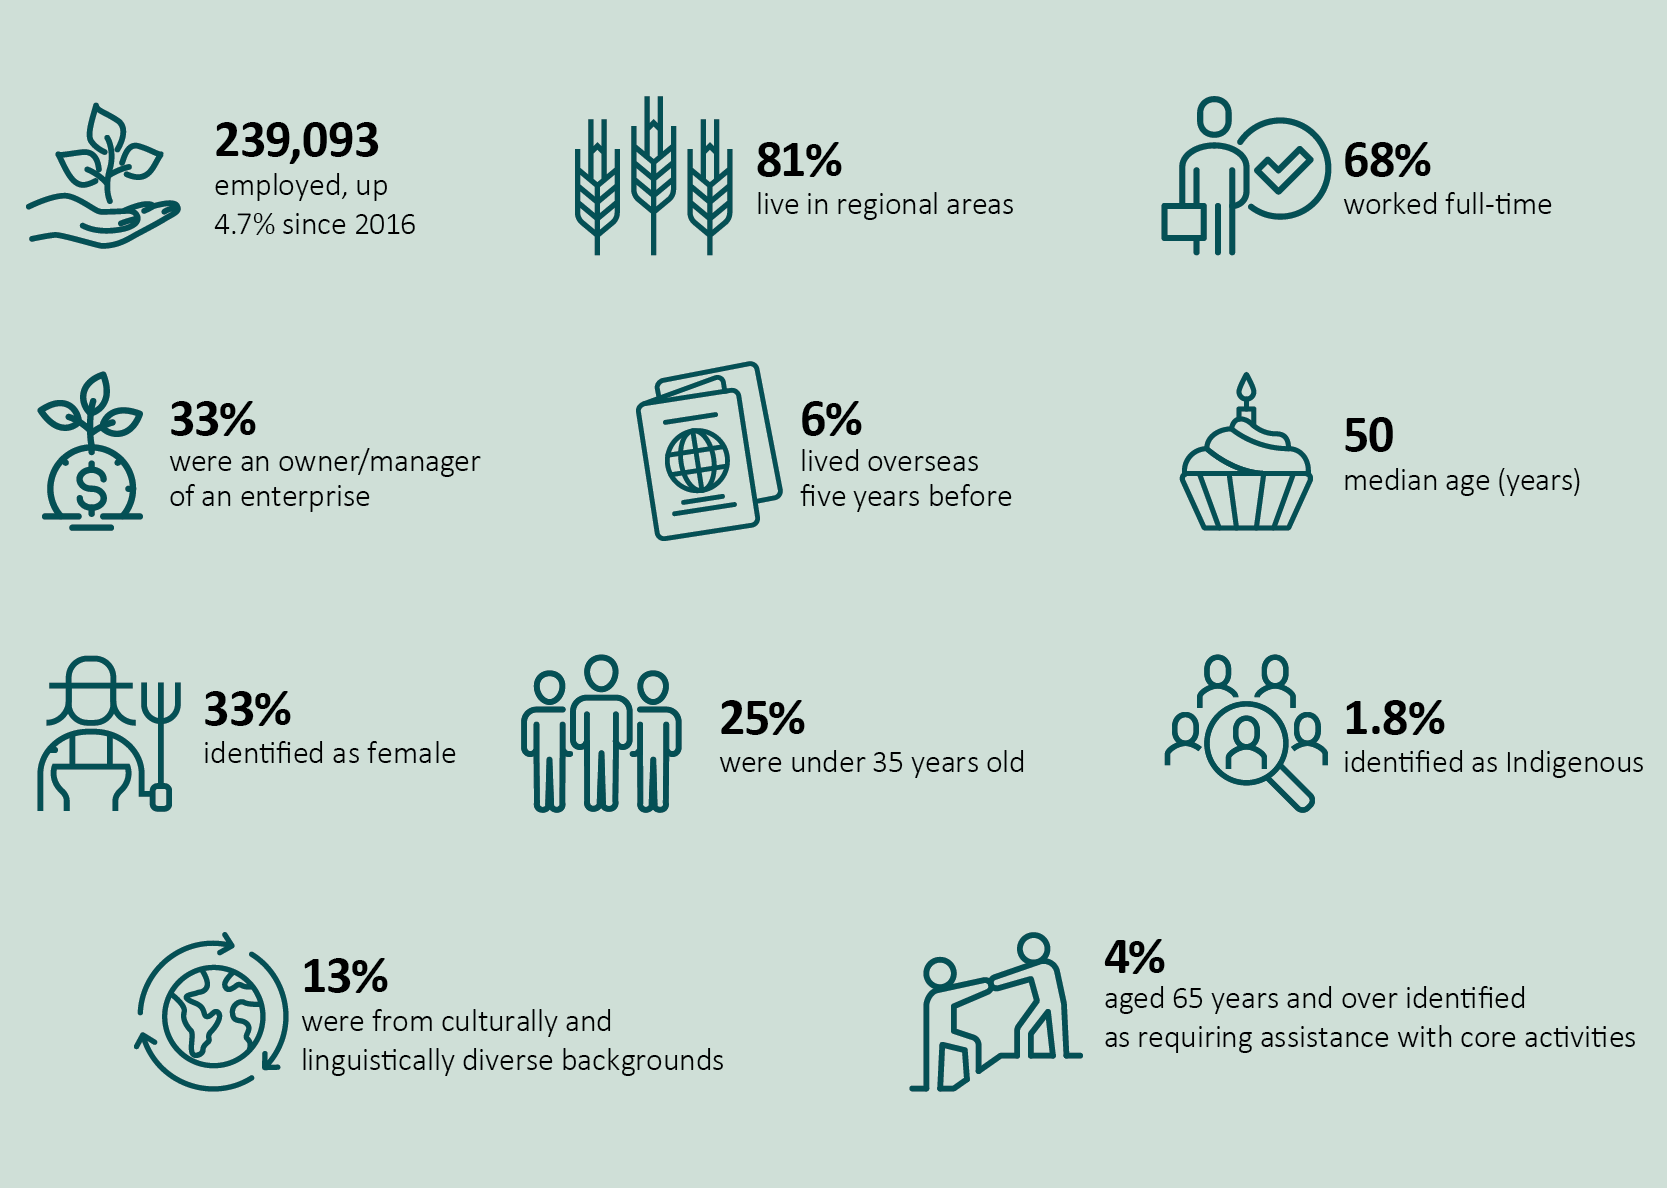
Australia’s agricultural workforce in 2021
Download this Insights paper
ABARES Insights: Snapshot of Australia’s Agricultural Workforce 2023 – PDF
ABARES Insights: Snapshot of Australia’s Agricultural Workforce 2023 – DOCX
Previous reports
ABARES Insights: Snapshot of Australia’s Agricultural Workforce 2018 - (PDF 1.1 MB)