
Authors: David Mobsby, Robert Curtotti
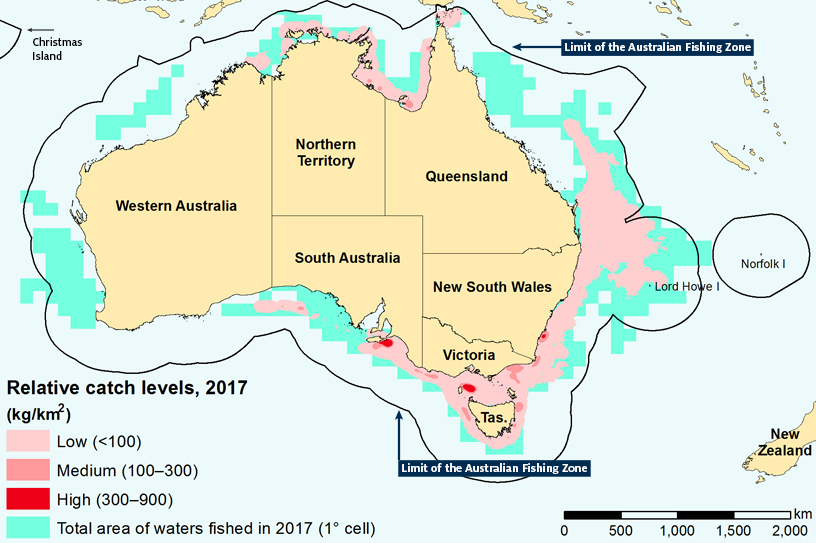
Note: Map includes fishing on the high-seas (external to EEZ), but does not include aquaculture production or catch in state jurisdictional waters and excludes Herd Island and McDonald Island Fishery, Macquarie Island Toothfish Fishery, the Commission for the Conservation of Antarctic Marine Living Resources exploratory toothfish fisheries, Cocos (Keeling) Islands Fishery and the full extent of the Christmas Island Fishery. In accordance with AFMA’s Disclosure Policy, the areas fished by fewer than five boats are indicated at the resolution of one degree (111km) and shown as “Total area of waters fished in 2017 (1° cell).”
Source: Patterson et al. 2018
This brief contains an overview of Australia’s commercial fisheries and aquaculture industries and six key aspects of Australian commercial fisheries and aquaculture including: industry structure, trends in production, trade, consumption, sustainability and innovation.
Australia’s fisheries span across a large area of ocean. Australia has the world’s third largest Exclusive Economic Zone (EEZ). The Australian Fishing Zone, which straddles both the territorial sea and the EEZ has an area of over 8 million km2 and is larger than the area of mainland Australia. This zone contains mainly Commonwealth managed fisheries. State jurisdictions operate mainly in coastal waters up to the 3 nautical mile limit. Australia also participates in international fisheries.
The majority of economic activity (wild-catch and aquaculture) occurs within state managed fisheries. This is because of the location of high value wild-caught species and the location of aquaculture production closer to shore.
Despite having one of the largest fishing areas in the world, Australia is a minor producer of fisheries products. This is primarily because of the relatively low biological productivity of the Australian marine environment, and also because Australian fisheries are carefully managed to ensure sustainable seafood is available over the longer term.
Figure 1 Australian Maritime Zones
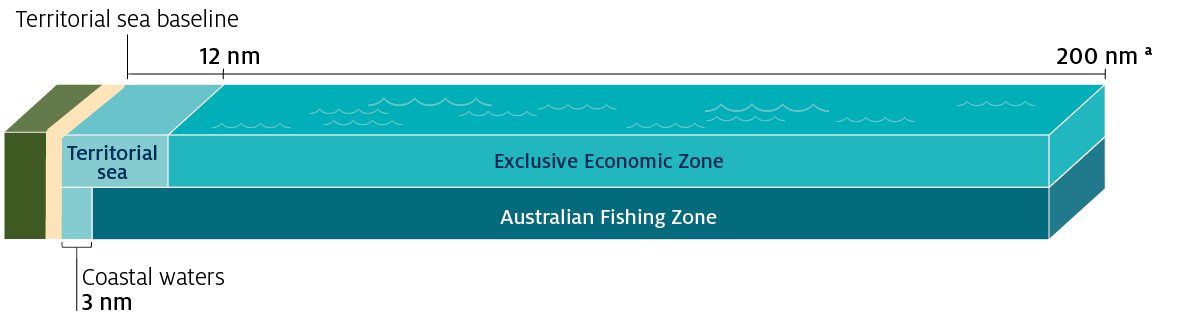
Note: a The limit of the EEZ may be less than 200nm if the limit of another country’s EEZ is reached. Boundaries between overlapping EEZs are determined by international treaty.
nm nautical mile (1 nautical mile = 1.852km). Source: Adapted from Geoscience Australia (2018)ABS Census of Population and Housing
[expand all]
Aquaculture growth supports fisheries production
Australia’s fishing industry includes both wild capture fisheries and coastal aquaculture operations. Wild capture fisheries target a multitude of species groups with landing of catch occurring mostly in regional areas. Aquaculture production is focused on a range of species, including atlantic salmon, tuna, oysters and prawns.
The wild-catch sector accounts for the majority of the gross value of production (GVP) of Australia’s commercial fishery and aquaculture industry. However, the decline in the value of wild-catch fisheries and the development of Australia’s aquaculture sector has resulted in aquaculture increasing its share of total production value.
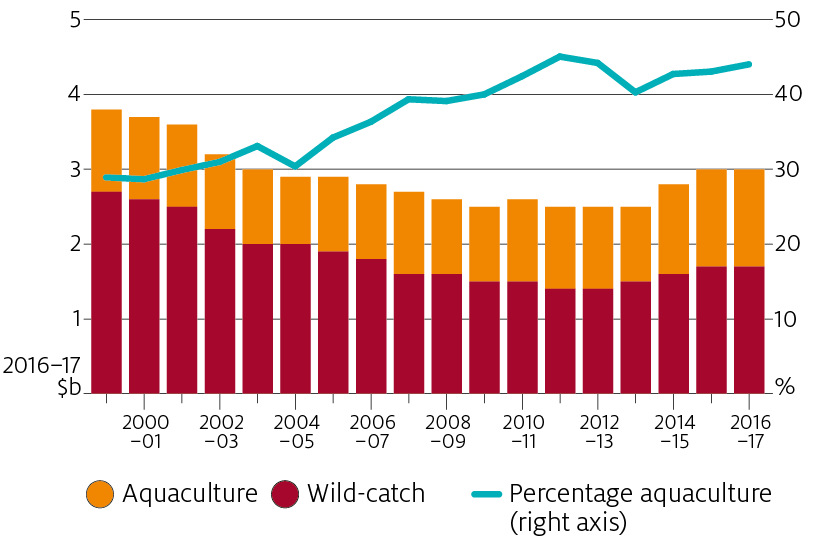
Source: ABARES
Australia’s fishing industry is regionally based with catch landed across the Australian coastline. As such the industry plays an important role in supporting regional communities.
Despite the Australian commercial fisheries and aquaculture industry producing a diverse range of products, a relatively small number of species comprise the majority of the GVP. Concentration in production mean that just three species groups (salmonids, rock
lobster and prawns) account for around 60 per cent of the GVP of Australian fisheries and aquaculture in 2016–17.
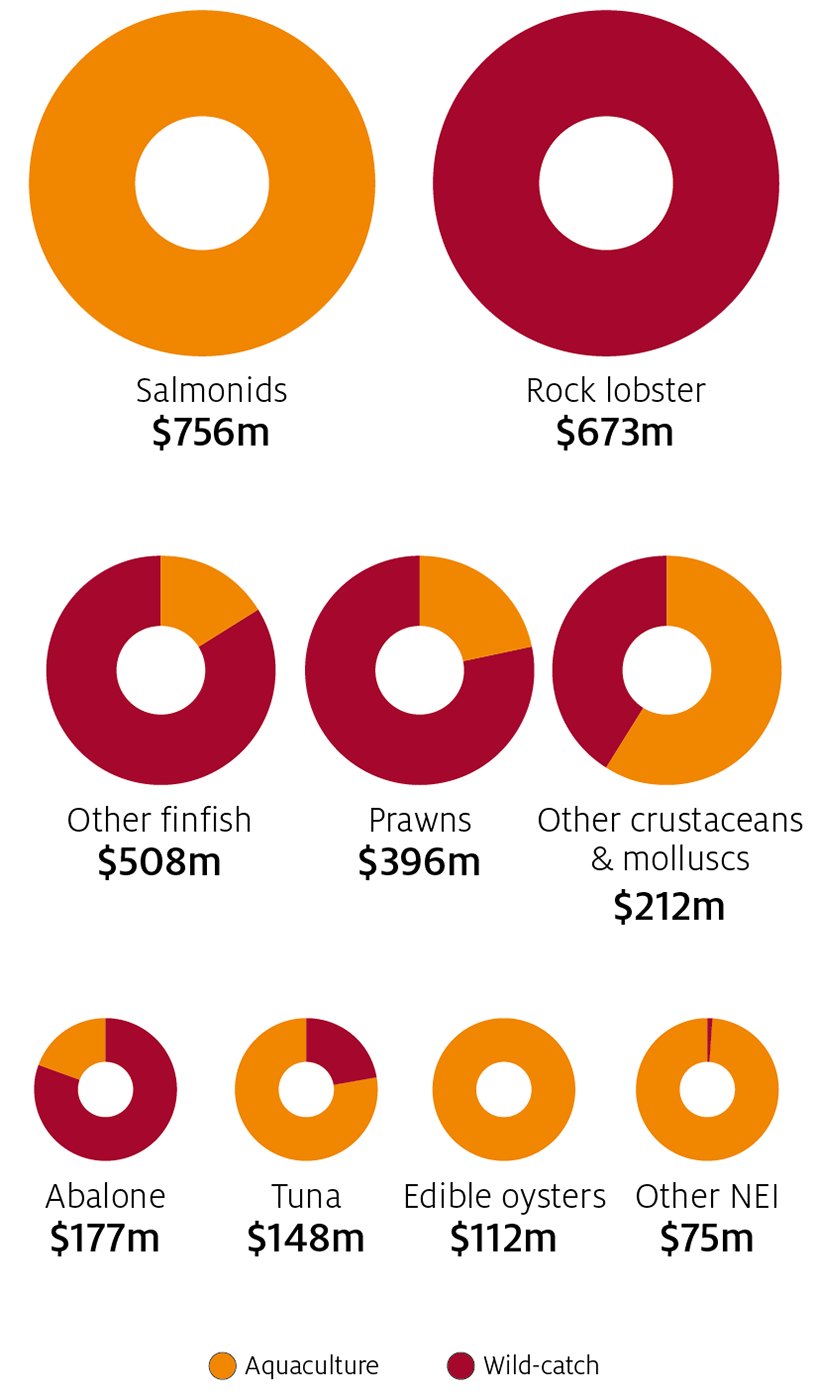
Note: NEI Not elsewhere included. Salmonids refer to fish of the family Salmonidae such as salmon and trout.
Source: ABARES
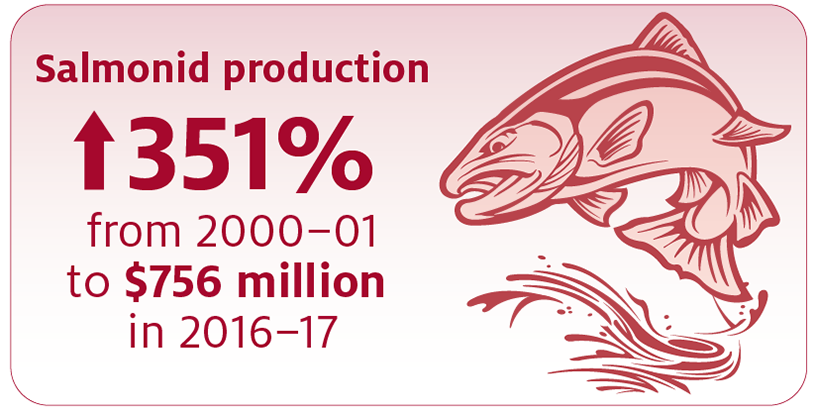
The value of Australian aquaculture production increased by 27 per cent in real terms between 2000–01 and 2016–17. The increasing value of the aquaculture sector is largely the result of increased Tasmanian salmonid production more than offsetting
declines in the value of aquaculture tuna and pearl oysters. The rising share of aquaculture in Australian seafood supply is consistent with a global trend of meeting increasing demand for seafood from aquaculture.
Source: ABARES
Exports
Australia exports a large portion of the value of what it produces but still only accounts for less than 1 per cent of world trade by value, which was valued at $US143 billion in 2016 (FAO 2018a). Globally, seafood is becoming increasingly traded internationally, in 2016, 27 per cent of seafood was traded compared with 11 per cent in 1976 (FAO 2018b).
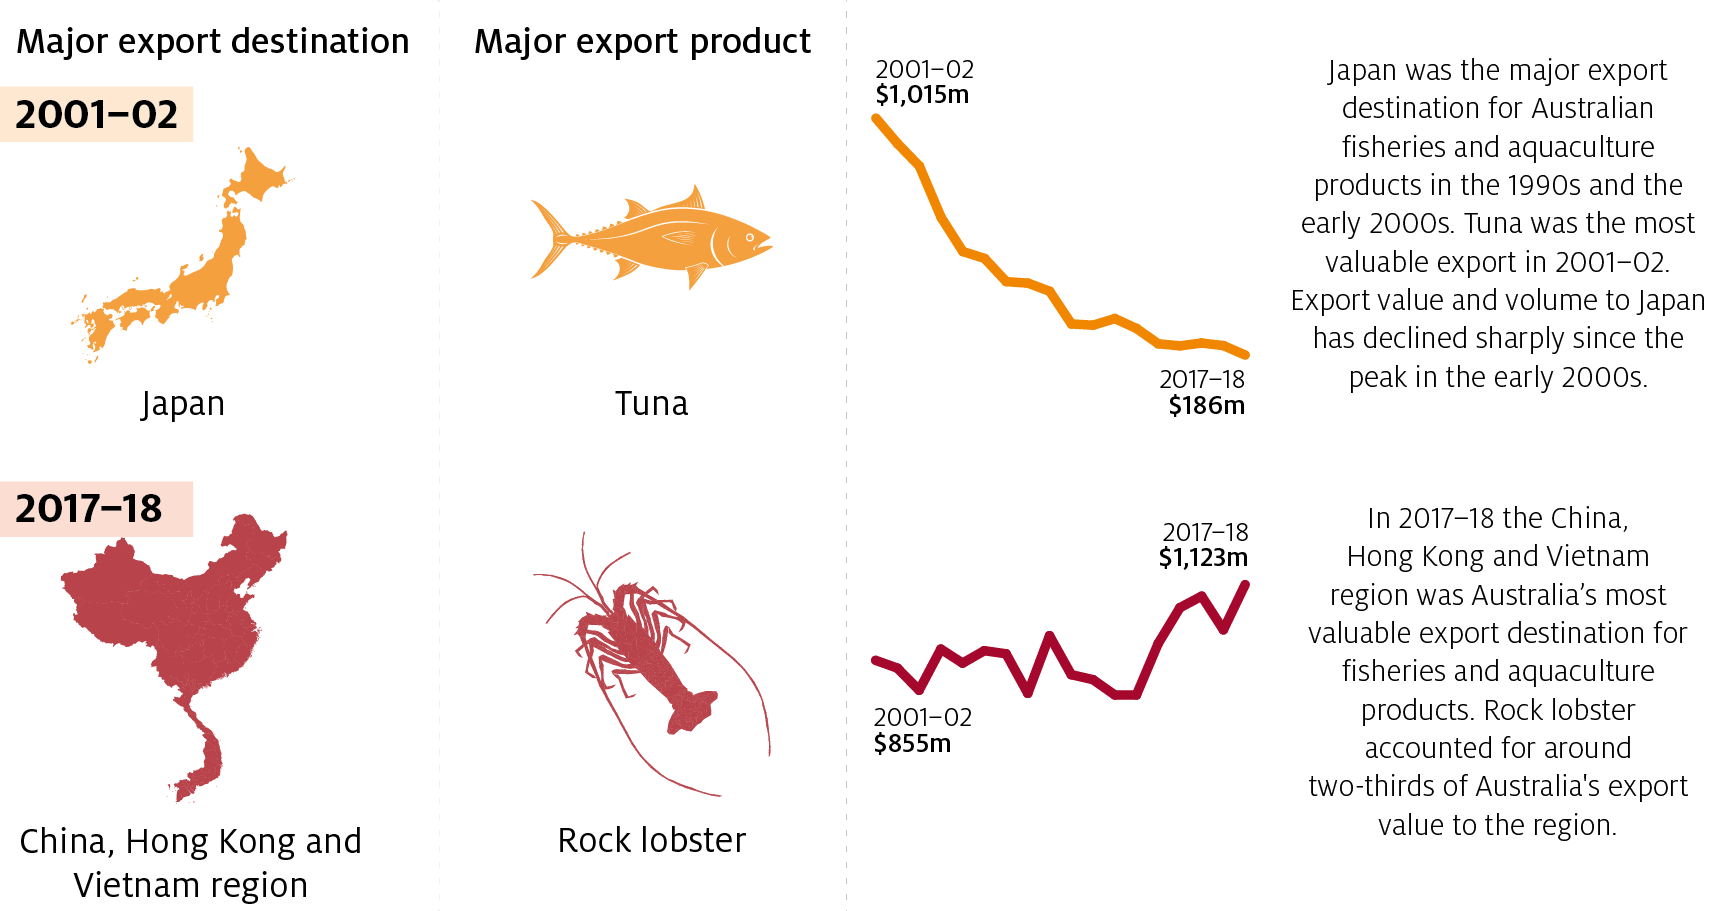
Australia’s trade in the fishery and aquaculture sectors is driven by several factors, including the proximity of Australia to the growing seafood market in Asia and Australia’s reputation as a reliable and high-quality supplier of high unit value fishery and aquaculture
products. Changing population, income levels, urbanisation trends and preferences in the main export markets are also important factors. Other factors, such as trade agreements between Australia and its trading partners and the macroeconomic factors of competing exporting countries, can also contribute to Australia’s overall competitiveness in the global market.
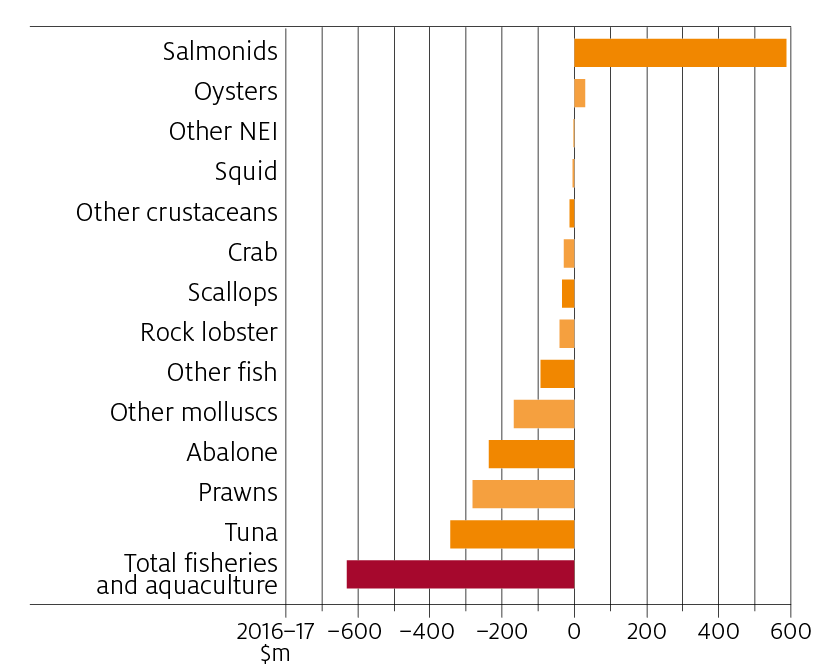
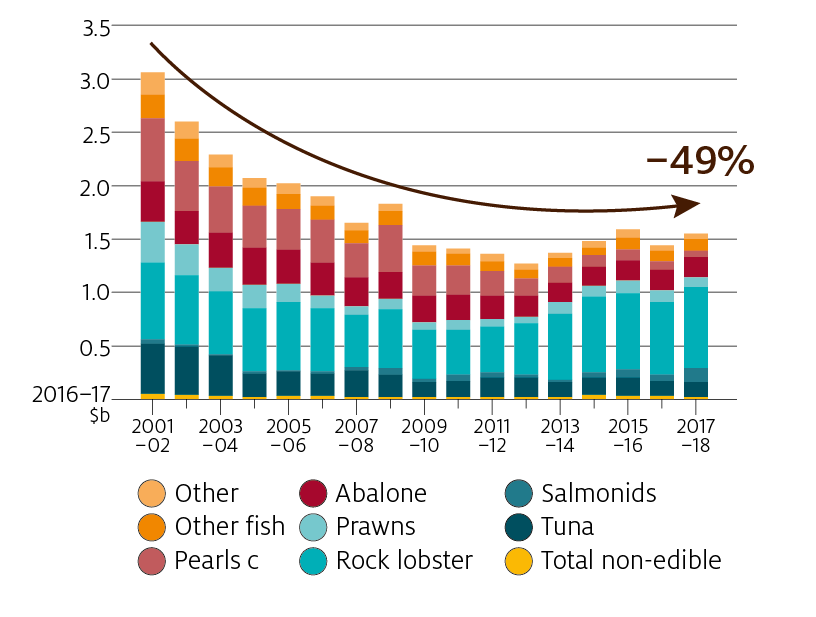
The value of Australia’s seafood exports nearly halved in real terms between 2001–02 and 2017–18 to $1.55 billion (in 2016–17 dollars). The decline in export value was largely the result of lower export price and volume of tuna, abalone, prawns and pearls.
Source: ABS, Information Consultancy Services, 2007, cat. no. 9920.0, Canberra
Note: Value is presented in 2016–17 dollars.
Source: ABARES; ABS, Information Consultancy Services, 2007, cat. no. 9920.0, Canberra
Imports and consumption
Imports
Australia’s level of seafood production means that imports are required to fill the gap between Australia’s seafood consumption and local seafood supply. Whereas Australian fishery and aquaculture exports are dominated by high unit value products such as rock lobster and abalone, imports of fishery and aquaculture products largely consist of lower unit value products such as canned or frozen finfish but also include higher unit value products such as prawns and salmonoids.
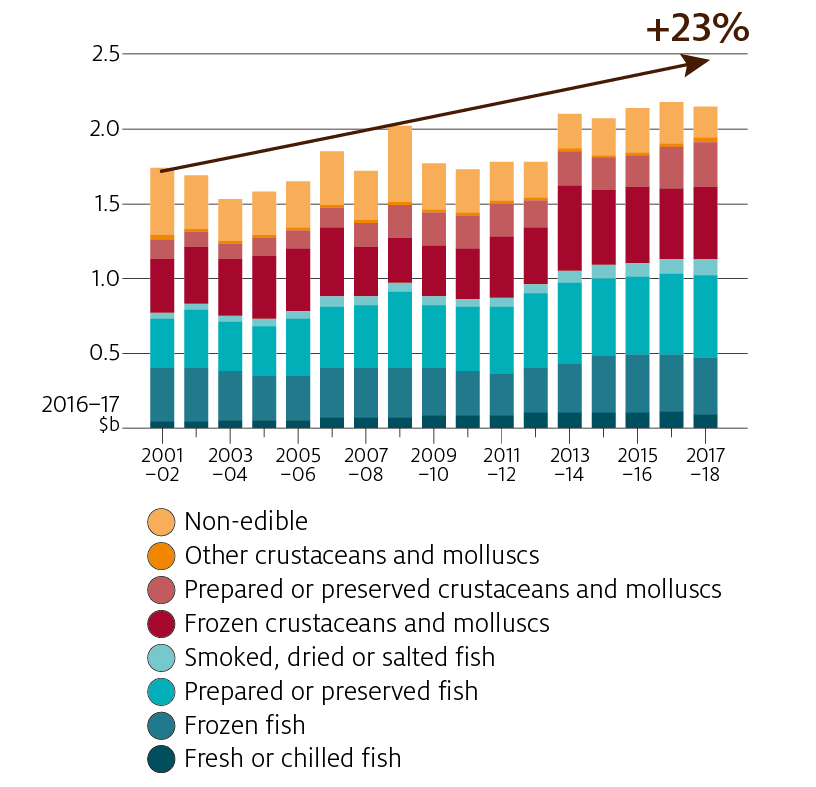
The total value of fisheries and aquaculture imports increased by 23 per cent in real terms between 2001–02 and 2017–18 to $2.1 billion. Over the same period total the value of edible fisheries product imports increased by 50 per cent in real terms to $1.94 billion, while the value of inedible fisheries imports declined by 55 per cent to $205 million.
- Imports of fisheries products into Australia have risen as a result of growing global aquaculture industry offering lower priced product to consumers.
- Finfish imports account for around 60 per cent of seafood import value.
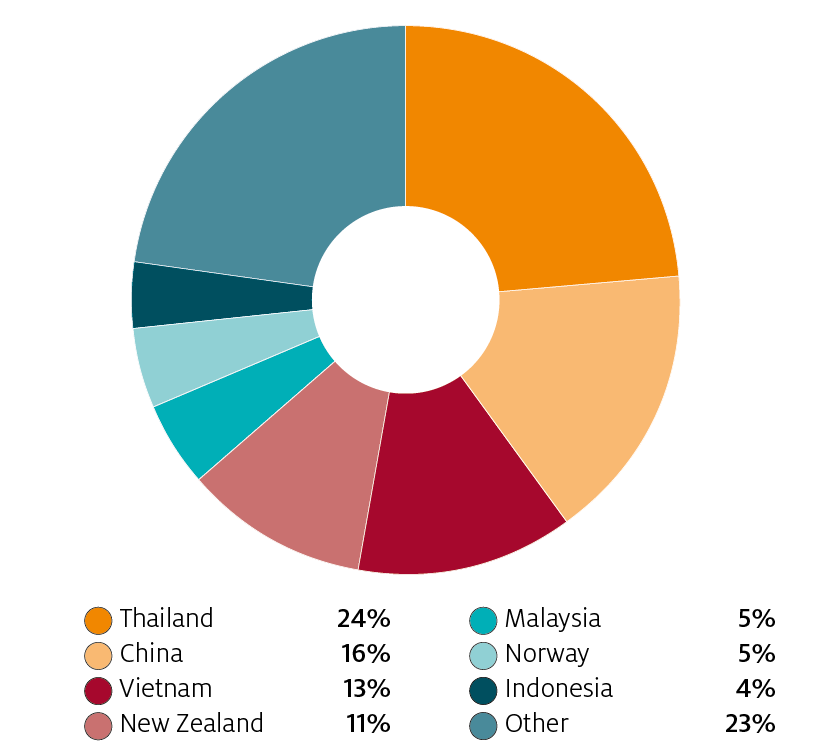
- The main sources of seafood imports are Thailand, China, Vietnam and New Zealand.
Figure 8 Australian fisheries and aquaculture product imports
Source: ABARES; ABS, Information Consultancy Services, 2007, cat. no. 9920.0, Canberra
Source: ABARES; ABS, Information Consultancy Services, 2007, cat. no. 9920.0, Canberra
Australia's consumption of seafood
Australia’s apparent consumption of seafood increased from an estimated 248,403 tonnes in 2001–02 to 341,092 tonnes in 2016–17. Imports of seafood increased to fill the gap between seafood consumption and local seafood supply. Imports of seafood into Australia increased from 146,054 tonnes in 2001–02 to a peak of 237,511 tonnes in 2013–14. In 2016–17 Australia imported 226,386 tonnes of seafood.
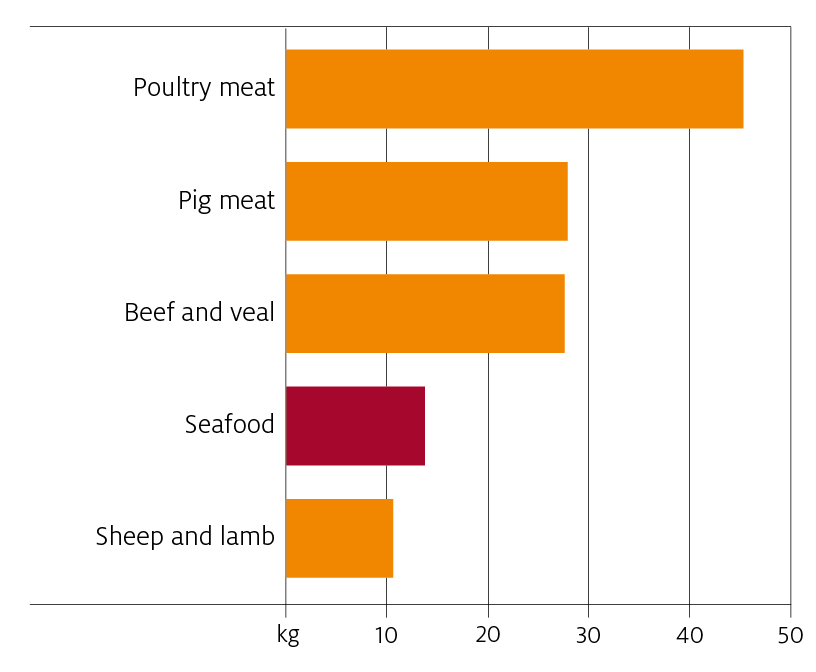
- Per person seafood consumption was 13.9 kilograms in 2016–17.
- Between 2001–02 and 2016–17 the share of imports in Australian seafood consumption increased from 59 per cent to 66 per cent, largely reflecting a rise in the volume of seafood imports.
- On a volume basis, per person consumption of seafood ranks behind beef, chicken and pork, but is above lamb and sheep meat.
Contrasting against a slightly declining trend in per person seafood consumption in Australia since 2003–04, salmonid consumption has trended upwards. Consumption has largely been met by an increase in domestic production, but has been supplemented by a significant volumes of imported salmonids (largely in a prepared and preserved form).
Source: ABARES
Sustainability of Australian Fish stocks
The Status of key Australian fish stocks reports 2016 on the biological status of fish stocks (Stewardson et al. 2016). The report examines whether the abundance of fish (or biomass) and the level of harvest from the stock were sustainable. The reports provide stock status assessments for 83 wild-caught species or species-complexes that contribute more than 80 per cent of the catch volume of Australian wild-catch fisheries in 2014–15.
Of the 294 stocks assessed in the reports, 175 were classified as sustainable; these contribute 85 per cent of the total catch of the 83 species. Nine stocks were classified as transitional/recovering, 26 as transitional/depleting, 5 stocks as environmentally limited and 17 as overfished. The status of 49 stocks was classified as undefined; these stocks contribute 4 per cent of the total catch of the 83 species. The undefined stock classification indicates limited or conflicting information was available to undertake the assessment.
| Stock status | Total stocks | Volume ('000 tonnes) |
|---|---|---|
| Sustainable stock | 175 | 115 |
| Transitional-depleting | 26 | 4 |
| Transitional-recovering | 9 | 1 |
| Overfished | 17 | 9 |
| Environmentally limited | 5 | 0 |
| Undefined | 49 | 6 |
| Negligible | 13 | 0 |
Note: The total does not include international catches (that is, catch taken outside Australian waters by countries other than Australia) of the four tuna and billfish species.
Source: Stewardson et al. 2016
Innovation increases the competitiveness of Australian fisheries and aquaculture sector
Expanding the production base of Australia’s fisheries and aquaculture sector is challenging. Many of Australia’s wild-caught fisheries, including those producing rock lobster, tuna, prawns, shark and finfish species groups are fully developed and are managed under strict controls on outputs (catch), inputs (such as equipment restrictions, seasonal or spatial closures), or both.
These controls are designed to limit catches to volumes that are economically and biologically sustainable and to allow any overfished stocks to rebuild. Aquaculture producers face challenges in identifying suitable sites for aquaculture enterprises and in meeting planning requirements.
Many Australian fishing and aquaculture enterprises have adopted innovative solutions that add value to their products. These solutions help maintain profitability in the face of changing factors beyond the control of fishers, such as exchange rates and fuel prices. For aquaculture enterprises, innovation is the key to developing farming solutions that limit the impact on the broader environment.
Some examples of innovation in the Australian fisheries and aquaculture sectors include the development of infrastructure to supply foreign markets (for example, live export of rock lobster) and technologies such as ranching of tuna to maximise the return generated from fisheries resources.
References
Mobsby, D 2018, Australian fisheries and aquaculture statistics 2017, Fisheries Research and Development Corporation project 2018-134, ABARES, Canberra, December. CC BY 4.0.
FAO 2018a The state of world fisheries and aquaculture 2018—opportunities and challenges, Food and Agriculture Organization of the United Nations, Rome.
—— 2018b, Statistics—introduction, Fisheries and Aquaculture Department, Food and Agriculture Organization of the United Nations, Rome.
Patterson, H, Larcombe, J, Nicol, S and Curtotti, R 2018, Fishery status reports 2018, Australian Bureau of Agricultural and Resource Economics and Sciences, Canberra. CC BY 4.0
Geoscience Australia 2018, Maritime Boundary Definitions, Geoscience Australia, Canberra.
Stewardson C, Andrews J, Ashby C, Haddon M, Hartmann K, Hone P, Horvat P, Mayfield S, Roelofs A, Sainsbury K, Saunders T, Stewart J, Stobutzki I and Wise B (eds) 2016, Status of Australian fish stocks reports 2016, Fisheries Research and Development
Corporation, Canberra.
Download this Insights paper
ABARES Insights: Snapshot of Australia's commercial fisheries and aquaculture