
Key issues
- For the week ending 24 November 2021, low-pressure troughs brought significant rainfall to much of Australia, especially in the east and south. A tropical low-pressure system off Western Australia developed into Tropical Cyclone Paddy, the first cyclone for the 2021-22 season.
- A second week of substantial rainfall and cool temperatures across northern New South Wales has caused further delays to harvesting activities. The wet conditions are also likely to cause quality downgrades due to fungal staining and sprouting of grain. Localised flooding has also been reported across numerous areas. The cool, wet conditions are also likely to negatively impact summer planting activity, as well as the germination and establishment of crops.
- The El Niño-Southern Oscillation (ENSO) is currently in a La Niña phase that is forecast to persist until late summer or early autumn. La Niña events are associated with above-average rainfall for northern and eastern Australia during summer. The Madden-Julian Oscillation is currently at weak to moderate strength and also expected to bring above-average rainfall to north-east Australia.
- The outlook for December 2021 to February 2022 suggests there is a 75% chance of rainfall totals between 50 and 200 millimetres across much of New South Wales, Queensland, Victoria, the Northern Territory and Tasmania, as well as northern and central Western Australia. Rainfall totals exceeding 300 millimetres are likely in northern coastal regions of New South Wales, in the north of Queensland, Northern Territory and Western Australia, and in western Tasmania.
- Over the 8-days to 2 December 2021 a trough of low-pressure systems are expected to dominate eastern and northern Australia, drawing down moist, tropical air and resulting in storms and substantial rainfall. However, high pressure systems to the south-west are forecast to bring clear, dry conditions to much of South Australia, Western Australia and central Australia over the next 8-days. For areas with wet conditions the harvesting of winter crops and planting of summer crops are likely to be stalled. The wet conditions are also likely to severely impact mature winter crops due to flooding, lodging, grain sprouting and fungal staining issues. For summer crops, the wet conditions could negatively affect their germination and establishment, as well as impeding nutrient availability.
- Water storage in the Murray–Darling Basin (MDB) increased by 56 gigalitres (GL) between 17 November 2021 and 24 November 2021. The current volume of water held in storage is 22,528 GL, which represents 89% of total capacity. This is 45% or 6,976 GL more than at the same time last year.
- Allocation prices in the Victorian Murray below the Barmah Choke decreased from $104 per ML on 12 November 2021 to $98 per ML on 19 November 2021. Prices are lower in the Goulburn-Broken, Murrumbidgee, and regions above the Barmah Choke due to the binding of the Goulburn intervalley trade limit, Murrumbidgee export limit, and Barmah Choke trade constraint.
Climate
For the week ending 24 November 2021, low-pressure troughs brought significant rainfall to much of Australia, especially in the east and south. A tropical low-pressure system off Western Australia developed into Tropical Cyclone Paddy, the first cyclone for the 2021-22 season.
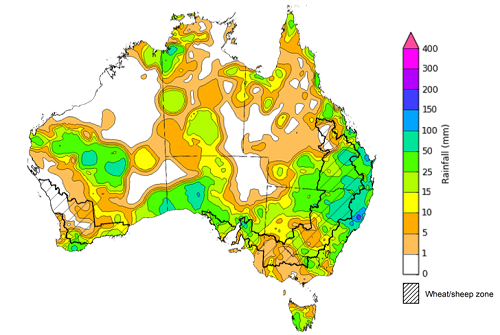
Rainfall totals of between 10 and 50 millimetres were recorded across much of New South Wales, southern Queensland, parts of southwest Victoria, southern and central parts of South Australia and Western Australia, isolated parts of the Northern Territory and southern Tasmania. Rainfall totals in excess of 50 millimetres were recorded across north-eastern New South Wales, south-eastern Queensland, as well as isolated parts of southern South Australia, central Western Australia and the far north of the Northern Territory.
In cropping regions, rainfall totals of between 10 and 50 millimetres were recorded in the far south and north of New South Wales, southern and central Queensland, central and western parts of South Australia and southern parts of Western Australia. Little to no rainfall was recorded across cropping regions of Victoria and most of Western Australia. Relatively dry conditions across cropping regions of Victoria and the central and south of Western Australia will support the maturing of crops as harvesting approaches.
A second week of substantial rainfall and cool temperatures across northern New South Wales has caused further delays to harvesting activities. The wet conditions are also likely to cause quality downgrades due to fungal staining and sprouting of grain. Localised flooding has also been reported across numerous areas. The cool, wet conditions are also likely to negatively impact summer planting activity, as well as the germination and establishment of crops. It should be noted however, that there is plenty of time for planting activities to take place, and the heavy rainfall is expected to boost soil moisture levels as Australia heads into the warmer months.
Rainfall for the week ending 24 November 2021
Note: The rainfall analyses and associated maps utilise data contained in the Bureau of Meteorology climate database, the Australian Data Archive for Meteorology (ADAM). The analyses are initially produced automatically from real-time data with limited quality control. They are intended to provide a general overview of rainfall across Australia as quickly as possible after the observations are received. For further information go to http://www.bom.gov.au/climate/rainfall/
Throughout summer the climate drivers with the largest potential impact on Australia’s climate patterns are the El Niño–Southern Oscillation (ENSO), the Madden-Julian Oscillation (MJO) and the Southern Annular Mode (SAM). These climate drivers will likely influence the final yield prospects and grain quality for Australia’s winter cropping season, pasture growth rates during this peak growth period, and planting and growing conditions for summer crops.
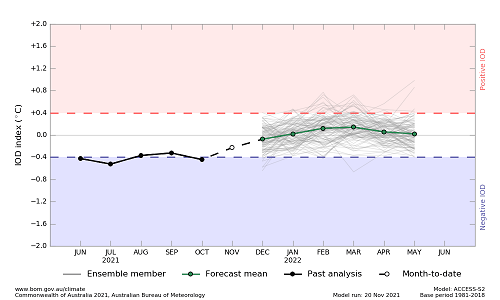
ENSO conditions are currently in a La Niña phase, which is associated with above-average rainfall for most of northern and eastern Australia during summer. The Bureau of Meteorology predicts the La Niña event will be short-lived and persist only until February-March 2022. The value of the Indian Ocean Dipole (IOD) index has recently transitioned from below the negative threshold (−0.4 °C) to the neutral range and is expected to remain there for the coming months. However, some negative IOD influences remain in the cloud and wind patterns. The MJO is currently at weak to moderate strength and is forecast to move over the Western Pacific in the coming fortnight, bringing above-average rainfall to north-east Australia and the Maritime Continent. The SAM is currently positive which is typically associated with increased rainfall in eastern Australia but decreased rainfall for western Tasmania.
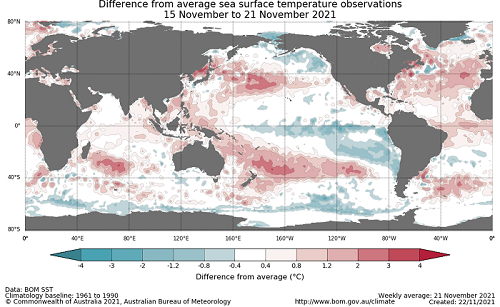
Sea surface temperatures (SST) for the Pacific Ocean have cooled along the equator, particularly in the eastern equatorial Pacific, while above-average anomalies have persisted in the Western Pacific Ocean and the Maritime Continent. Over recent weeks, a positive feedback loop has been observed between atmospheric and oceanic conditions in the Pacific that will likely feed sea surface temperature trends and maintain La Niña conditions into autumn.
Difference from average sea surface temperature observations 15 November to 21 November 2021
International climate model outlooks for the NINO 3.4 region in March 2022
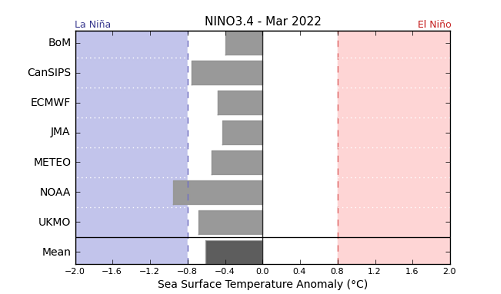
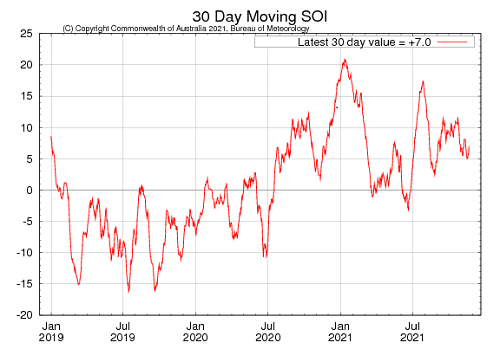
All international models surveyed anticipated future cooling of the tropical Pacific. Monthly sea surface temperature anomalies are forecast to remain under the La Niña threshold (-0.8 °C) during December 2021 and January 2022 before returning to neutral values by March 2022. Trade winds have also strengthened in the western tropical Pacific Ocean and there is below average cloudiness near the Date Line. For the period ending 21 November the 30‑day Southern Oscillation Index (SOI) value was 7.0 and the 90‑day value was 8.6, both of which are equal to or above the La Niña threshold of +7.
30-day Southern Oscillation Index (SOI) values ending 21 November 2021
As of 21 November, the IOD weekly value was -0.34°C, which is within neutral bounds. A negative IOD event occurred during October and the return to neutral conditions in November is consistent with the typical lifecycle of IOD events, which dissipate in late spring to early summer. Weak warm SST anomalies and associated atmospheric patterns are still present in the west Indian Ocean basin and will continue to bring persistent cloudiness to Indonesian and north-west Australian coastal regions. Above average sea surface temperatures in the eastern Indian Ocean are likely to persist and may continue to influence Australian rainfall patterns and temperature.
Monthly sea surface temperature anomalies for IOD region
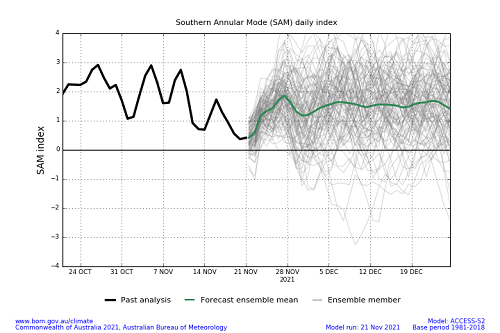
The SAM is currently positive and expected to remain positive for the remainder of the year. The SAM refers to the north-south shift of the band of rain-bearing westerly winds and weather systems in the Southern Ocean compared to the usual position. A positive SAM during summer is associated with increased rainfall in eastern Australia but decreased rainfall for western Tasmania.
Southern Annular Mode (SAM) daily index
These climate outlooks are generated by ACCESS–S (Australian Community Climate Earth-System Simulator–Seasonal). ACCESS–S is the Bureau of Meteorology's dynamical (physics-based) weather and climate model used for monthly, seasonal, and longer-lead climate outlooks.
For further information, go to http://www.bom.gov.au/climate/ahead/about/
The Bureau of Meteorology’s latest rainfall outlook indicated average to above average rainfall conditions for much of eastern Australia from December 2021 – February 2022, which is consistent with the onset of a La Niña event in the central Pacific. Below average rainfall is expected for central Western Australia, far southwestern Tasmania, and some areas in the north of the Northern Territory. The wetter than average conditions expected for eastern cropping regions will support the establishment of summer crops but may interrupt harvesting of winter crops. The ACCESS-S climate model suggests there is a 75% chance of exceeding median summer rainfall totals in areas of northern Queensland and a greater than 60% chance along the rest of the east coast.
The outlook for December 2021 indicates that there is a 75% chance of rainfall totals between 10 and 100 millimetres across eastern and northern Australia. Rainfall totals exceeding 100 millimetres are expected in the far north of Queensland and the Northern Territory, and the west coast of Tasmania.
Across cropping regions there is a 75% chance of rainfall totals of between 5 and 10 millimetres in South Australia, north-western Victoria and Western Australia. There is a 75% chance of rainfall totals between 10 and 100 millimetres for cropping regions in Queensland, New South Wales and the remaining parts of Victoria.
The dryer than average conditions expected in South Australian and Western Australian cropping regions will allow harvesting of winter crops to progress largely without delay. Meanwhile, the wetter than average conditions in eastern states may restrict access to fields and delay the harvesting of winter crops. The wet conditions will provide a boost to soil moisture levels and pasture growth rates, and support the growth of early sown summer crops.
Rainfall totals that have a 75% chance of occurring December 2021
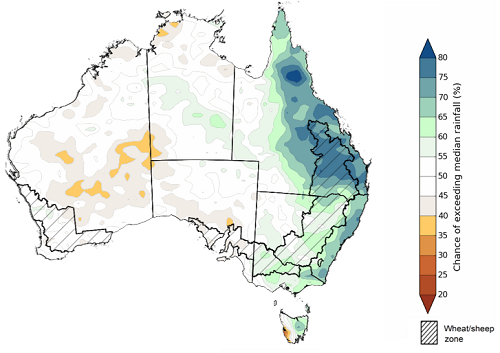
The rainfall outlook for December to February suggests there is a greater than 70% chance of exceeding median rainfall in coastal New South Wales and eastern Queensland. There is less than a 40% chance of exceeding average rainfall in south-western Tasmania and some parts of central Western Australia, but no strong tendency toward above or below average rainfall across the remainder of Western Australia, South Australia, and the Northern Territory (Bureau of Meteorology ‘National Climate Outlook’, 18 November 2021).
Bureau of Meteorology rainfall outlooks for December to February have greater than 50% past accuracy across most of Australia. Outlook accuracy is greater than 55% for much of the eastern Queensland and New South Wales, northern South Australia and Northern Territory, and the majority of Western Australia and Victoria. On the other hand, there is low past accuracy across much of the southeast of the Northern Territory, western Queensland and most of Tasmania.
Chance of exceeding the median rainfall December 2021 to February 2022
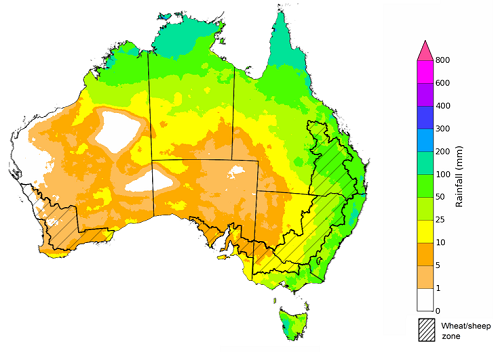
The rainfall totals outlook for December to February suggests there is a 75% chance of rainfall between 50 and 200 millimetres across most of New South Wales, Queensland, Victoria, the Northern Territory and Tasmania, as well as northern and central Western Australia. Rainfall totals exceeding 300 millimetres are likely in northern coastal regions of New South Wales, and in the north of Queensland, Northern Territory and Western Australia, and western Tasmania.
Across cropping regions, there is a 75% chance of receiving between 50 and 200 millimetres in New South Wales, southern Queensland, and central Victoria. Rainfall totals exceeding 200 millimetres are forecast for northern cropping regions in Queensland. Totals of less than 50 millimetres are expected across South Australia, as well as cropping areas of Western Australia.
These rainfall totals are slightly below average for this three-month period across some South Australian, Western Australian and Victorian cropping regions, and average to above average for cropping regions of New South Wales and Queensland. The expected conditions for eastern states may limit field access and slowdown the winter crop harvest in December, as well as increasing the potential of grain quality issues. Summer crops, on the other hand, will benefit from above average rainfalls in northern cropping regions, supporting average to above average production potential through to harvest during late-summer to early -autumn.
Rainfall totals that have a 75% chance of occurring December 2021 to February 2022
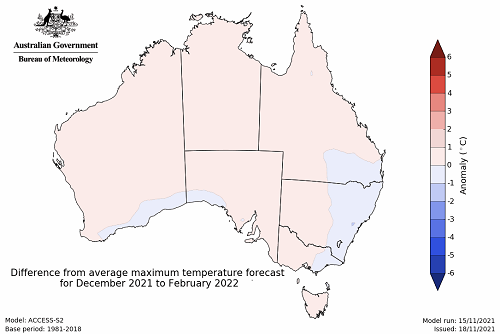
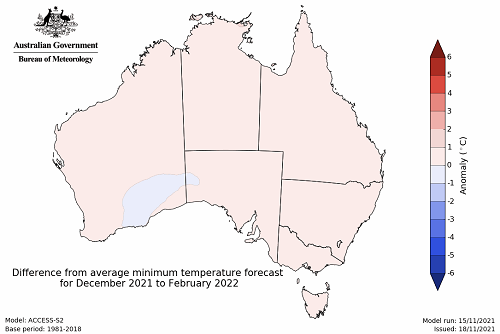
The temperature outlook for December to February indicates that maximum and minimum temperatures across most of Australia are likely to be close to the 1990-2012 average (- 1°C to 1°C) (Bureau of Meteorology ‘National Climate Outlook’, 21 October 2021).
Predicted maximum temperature anomaly for December 2021 to February 2022
Predicted minimum temperature anomaly for December 2021 to February 2022
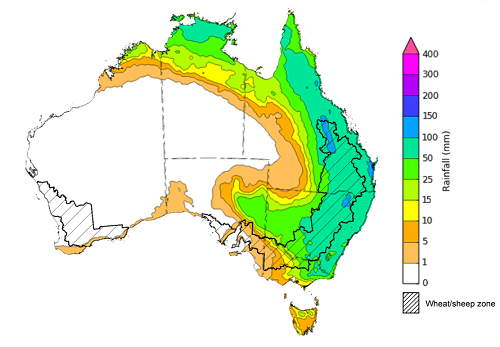
Over the 8-days to 2 December 2021 a trough of low-pressure systems are expected to dominate eastern and northern Australia, drawing down moist, tropical air and resulting in storms and substantial rainfall. However, high pressure systems to the south-west are forecast to bring clear, dry conditions to much of South Australia, Western Australia and central Australia over the next 8-days.
Rainfall totals of between 10 and 100 millimetres are forecast for most of New South Wales, eastern Queensland and Victoria, the east of South Australia, as well as northern parts of Western Australia and the Northern Territory. Rainfall in excess of 100 millimetres is expected in isolated parts of northern New South Wales and eastern Queensland.
In Australian cropping regions, rainfall totals of between 10 and 100 millimetres are expected across much of central and northern New South Wales, Queensland and central and eastern Victoria. Rainfall totals in excess of 100 millimetres is expected in some cropping regions in north-eastern New South Wales and northern Queensland. Little to no rainfall is forecast for cropping regions in western Victoria, South Australia and Western Australia during the next 8-days.
The rainfall expected across New South Wales and Queensland follows two weeks of substantial rainfall and already saturated soil profiles. As a consequence, harvesting of winter crops and planting of summer crops are likely to be stalled. The wet conditions are also likely to severely impact mature winter crops due to flooding, lodging, grain sprouting and fungal staining issues. The unfortunate timing of the expected heavy falls is likely to cause significant winter crop quality downgrades. However, the dry conditions in western Victoria, South Australia and Western Australia will allow winter crops to continue maturing in the led up to harvesting.
For summer crops, the wet conditions could negatively affect their germination and establishment, as well as impeding nutrient availability. Given that soil profiles are already largely saturated, the expected rainfall is unlikely to provide additional soil moisture for later in the season.
Total forecast rainfall (mm) for the period 25 November to 2 December 2021
Note: This rainfall forecast is produced from computer models. As the model outputs are not altered by weather forecasters, it is important to check local forecasts and warnings issued by the Bureau of Meteorology.
Water
Water storages, water markets and water allocations - current week
The Tableau dashboard may not meet accessibility requirements. For information about the contents of these dashboards contact ABARES.

Commodities
Information on weekly price changes in agricultural commodities is now available at the Weekly commodity price update.