
Key issues
- During the week ending 27 October 2021, a cold front and associated cloud band brought rainfall to southern Australia, while low-pressure troughs brought rainfall to scattered areas of northern and eastern Australia.
- The relatively dry conditions across southern Queensland and northern New South Wales cropping regions have likely allowed harvesting activities to continue uninterrupted, following some heavy rainfall the previous weeks. The rainfall in south-western cropping regions will be a welcome top up to soil moisture levels and will support yield potentials through grain filling.
- The El Niño-Southern Oscillation (ENSO) conditions currently remain neutral. However, all international models surveyed predict the formation of a La Niña event in November 2021. La Niña events are associated with above-average rainfall for northern and eastern Australia during spring and summer. The value of the Indian Ocean Dipole (IOD) index returned below the negative threshold (−0.4 °C) following a brief period of neutral values. The decline in the IOD value reflects warmer than average sea surface temperatures in the eastern Indian Ocean. A negative IOD is associated with increased spring rainfall in parts of southern Australia.
- The outlook for November 2021 to January 2022 suggests there is a 75% chance of rainfall totals between 50 and 200 millimetres across much of New South Wales, Queensland, Victoria, the Northern Territory and Tasmania, as well as parts of South Australia and Western Australia. Rainfall totals in excess of 300 millimetres are likely across parts of alpine and coastal regions of New South Wales and Victoria, as well as northern Queensland, the north of the Northern Territory and Western Australia, and western Tasmania.
- Over the 8-days to 4 November 2021 a series of troughs, low-pressure systems and cold fronts are expected to bring showers and storms to large area of northern, central and eastern Australia. Meanwhile, high pressure systems are expected to bring dry weather conditions to much of Western Australia over the next 8 days.
- Water storage in the Murray–Darling Basin (MDB) increased by 85 gigalitres (GL) between 20 October 2021 and 27 October 2021. The current volume of water held in storage is 22,108 GL, which represents 87% of total capacity. This is 43% or 6,669 GL more than at the same time last year.
- Allocation prices in the Victorian Murray below the Barmah Choke decreased from $119 per ML on 15 October 2021 to $114 per ML on 22 October 2021. Prices are lower in the Goulburn-Broken, Murrumbidgee, and regions above the Barmah choke due to the binding of the Goulburn intervalley trade limit, Murrumbidgee export limit, and Barmah choke trade constraint.
Climate
During the week ending 27 October 2021, a cold front and associated cloud band brought rainfall to southern Australia, while low-pressure troughs brought rainfall to scattered areas of northern and eastern Australia.
Rainfall totals of between 10 and 50 millimetres were recorded along the east coast of New South Wales, parts of eastern, central and northern Queensland, southern Victoria, the south-west and far north of Western Australia and the north of the Northern Territory. Rainfall totals in excess of 50 millimetres were recorded in across scattered areas of Queensland and much of Tasmania.
In cropping regions, rainfall totals of between 10 and 50 millimetres were recorded in northern Queensland and across much of Western Australia. Little to no rainfall was recorded across remaining cropping regions.
The relatively dry conditions across southern Queensland and northern New South Wales cropping regions have likely allowed harvesting activities to continue uninterrupted, following some heavy rainfall the previous weeks. Likewise, summer planting in Queensland and northern New South Wales is well underway, encouraged by above average soil moisture levels in parts. The rainfall in south-western cropping regions will be a welcome top up to soil moisture levels and will support yield potentials through grain filling. While little to no rainfall was recorded across much New South Wales, Victoria and South Australia these dry conditions will have provide ideal condition for fodder conservation and pre-harvest field work such as windrowing of Canola.
Rainfall for the week ending 27 October 2021
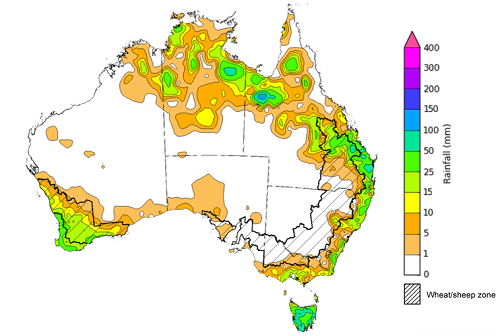
Note: The rainfall analyses and associated maps utilise data contained in the Bureau of Meteorology climate database, the Australian Data Archive for Meteorology (ADAM). The analyses are initially produced automatically from real-time data with limited quality control. They are intended to provide a general overview of rainfall across Australia as quickly as possible after the observations are received. For further information go to http://www.bom.gov.au/climate/rainfall/
Throughout late spring and early summer the climate drivers with the largest potential impact on Australia’s climate patterns are the El Niño–Southern Oscillation (ENSO), the Indian Ocean Dipole (IOD) and the Southern Annular Mode (SAM). These climate drivers will likely influence the final yield prospects for Australia’s winter cropping season, pasture growth rates during this peak growth period and planting conditions for summer crops.
ENSO conditions currently remain neutral. However, several indicators and all international climate models surveyed suggest the likely formation of a La Niña event in the coming months. The Bureau of Meteorology predicts a 70% likelihood of an event forming. La Niña events are associated with above-average rainfall for northern and eastern Australia during spring and summer.
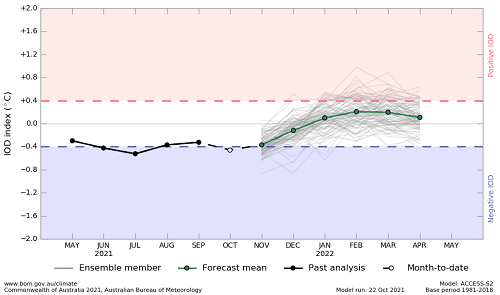
The value of the IOD index remains below the negative threshold (−0.4 °C), with warmer than average sea surface temperatures across the eastern Indian Ocean. A negative IOD, and warmer sea surface temperatures in the eastern Indian Ocean, is associated with above average rainfall for much of southern Australia in spring. However, the negative IOD event is expected to dissipate with the onset of the northern monsoon in late spring to early summer, with the southward shift of the monsoon trough. The SAM is currently positive which is typically associated with increased rainfall in eastern Australia but decreased rainfall for western Tasmania.
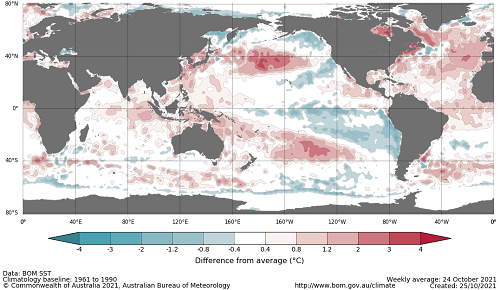
Below average sea surface temperature anomalies have continued to strengthen in the central and eastern tropical Pacific Ocean over the past week. Despite these temperature anomalies remaining within the neutral ENSO range, a continued cooling is anticipated across the equatorial Pacific, contributing to the development of a La Niña event in the coming months. Meanwhile, above average anomalies in the western Pacific Ocean and Maritime Continent have continued. Warm anomalies have strengthened in water close to Australia but eased slightly in the Maritime Continent.
Difference from average sea surface temperature observations 18 October to 24 October 2021
International climate model outlooks for the NINO 3.4 region in November 2021
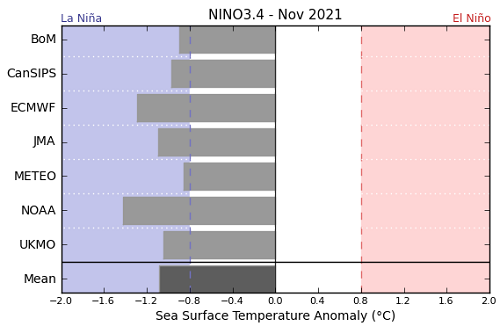
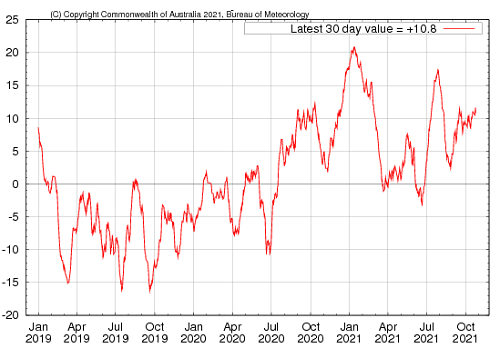
All international models surveyed predict the formation of a La Niña event in November 2021, which is underpinned by atmospheric and oceanic indicators. Monthly sea surface temperatures remain within the neural range but have continued to decline towards the La Niña threshold (-0.8 °C). Below average sea surface temperature anomalies in the central and eastern Pacific Ocean have strengthen and become more widespread over the past two weeks. There has also been a strengthening of trade winds in the western Pacific Ocean and below average cloudiness near the Date Line. For the period ending 24 October the 30‑day Southern Oscillation Index (SOI) value was 11.6 and the 90‑day value was 7.5, both of which are above the La Niña threshold of +7.
30-day Southern Oscillation Index (SOI) values ending 24 October 2021
As at 24 October, the Indian Ocean Dipole (IOD) weekly value was -0.57°C, which is below the negative threshold of -0.4°C. Despite the persistence of the negative IOD event, the majority of international climate models surveyed by the Bureau of Meteorology expect the IOD to return to neutral values over the coming weeks. The return to neutral conditions is consistent with the typical lifecycle of IOD events, which dissipate in late spring to early summer. Above average sea surface temperatures in the eastern Indian Ocean are likely to persist and will continue to influence Australian rainfall patterns.
Monthly sea surface temperature anomalies for IOD region
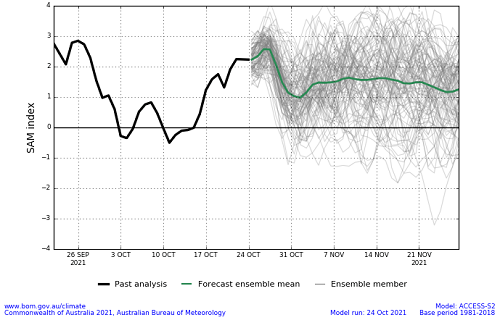
The Southern Annular Mode (SAM) is currently positive and expected to remain positive for the remainder of the year. The SAM refers to the north-south shift of the band of rain-bearing westerly winds and weather systems in the Southern Ocean compared to the usual position. A positive SAM in spring is associated with increased rainfall in eastern Australia but decreased rainfall for western Tasmania.
Southern Annular Mode (SAM) daily index
These climate outlooks are generated by ACCESS–S (Australian Community Climate Earth-System Simulator–Seasonal). ACCESS–S is the Bureau of Meteorology's dynamical (physics-based) weather and climate model used for monthly, seasonal and longer-lead climate outlooks.
For further information, go to http://www.bom.gov.au/climate/ahead/about/
The Bureau of Meteorology’s latest rainfall outlook indicated average to above average rainfall conditions are expected for much of Australia and below average rainfall is expected for the far south-west of Western Australia and western Tasmania during November. The wetter than average conditions expected for eastern cropping regions will support the establishment of summer crops but may interrupt harvesting of winter crops. The ACCESS-S climate model suggests there is close to a 65% chance of exceeding median November rainfall totals across much of eastern Australia.
The outlook for November 2021 indicates that there is a 75% chance of rainfall totals between 10 and 100 millimetres across eastern, central, northern and far southern Australia. Rainfall totals in excess of 100 millimetres are expected in isolated parts of eastern New South Wales, the north of the Northern Territory and the west coast of Tasmania.
Across cropping regions there is a 75% chance of rainfall totals of between 5 and 10 millimetres in the far west of South Australia and the north and centre of Western Australia. There is a 75% chance of rainfall totals between 10 and 100 millimetres for New South Wales, Queensland, Victoria, much of South Australia and remaining parts of Western Australia.
The dryer than average conditions expected in South Australian and Western Australian cropping regions will allow harvesting of winter crops to progress largely without delay. Meanwhile, the wetter than average conditions in eastern states may restrict access to fields and delay the harvesting of winter crops. Th wet conditions will provide a boost to soil moisture levels and pasture growth rates, and support summer crops through establishment.
Rainfall totals that have a 75% chance of occurring November 2021
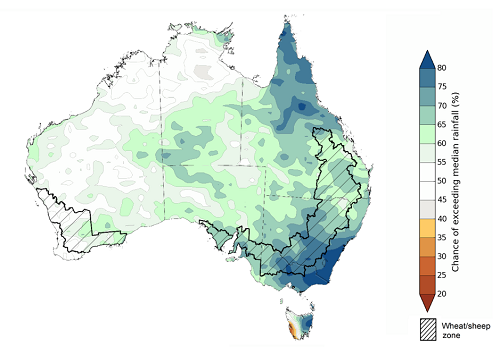
The rainfall outlook for November to January suggests there is a greater than 75% chance of exceeding median rainfall across central and southern New South Wales, northern Queensland, much of Victoria and eastern Tasmania. There is less than a 40% chance of exceeding average rainfall in south-western Tasmania, but no strong tendency toward above or below average rainfall across the much of Western Australia and the north of the Northern Territory (Bureau of Meteorology ‘National Climate Outlook’, 21 October 2021).
Bureau of Meteorology rainfall outlooks for November to January have greater than 55% past accuracy across most of Australia. Outlook accuracy is greater than 65% for much of Queensland, as well as parts of South Australia and Western Australia. On the other hand, there is low past accuracy across much of the Northern Territory and parts of South Australia.
Chance of exceeding the median rainfall November 2021 to January 2022
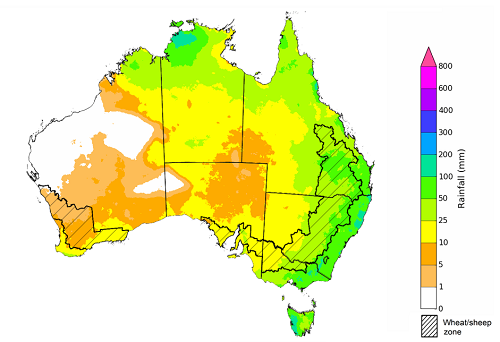
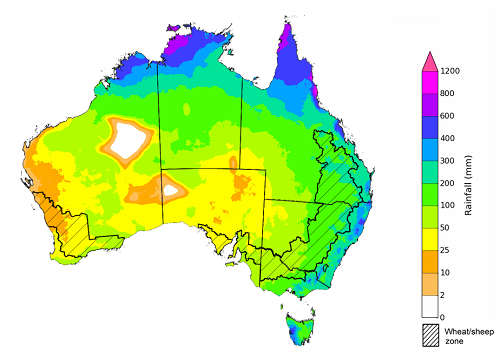
The outlook for November to January suggests there is a 75% chance of rainfall totals between 50 and 200 millimetres across most of New South Wales, Queensland, Victoria, the Northern Territory and Tasmania, as well as parts of South Australia and Western Australia. Rainfall totals in excess of 300 millimetres are likely across parts of alpine and coastal regions of New South Wales and Victoria, as well as northern Queensland, the north of the Northern Territory and Western Australia, and western Tasmania.
Across cropping regions, there is a 75% chance of receiving between 50 and 200 millimetres in New South Wales, Queensland, Victoria, as well as parts of South Australia and Western Australia. Rainfall totals in excess of 200 millimetres are forecast for parts of central Queensland and north-eastern New South Wales cropping regions. Totals of less than 50 millimetres are expected across the west of South Australia, as well as central and northern cropping areas of Western Australia.
These rainfall totals are slightly below average for this three-month period across some South Australian and Western Australian cropping regions, and average to above average for cropping regions of New South Wales, Queensland and Victoria. The expected conditions for eastern states may limit field access and slowdown the winter crop harvest in November and December, as well as increasing the potential of grain quality issues. Summer crops, on the other hand, will benefit from above average rainfalls in northern cropping regions, supporting them through vegetative growth stages.
Rainfall totals that have a 75% chance of occurring November 2021 to January 2022
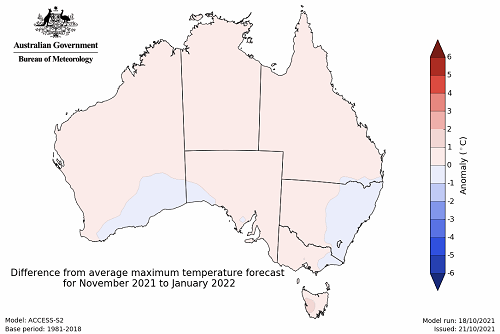
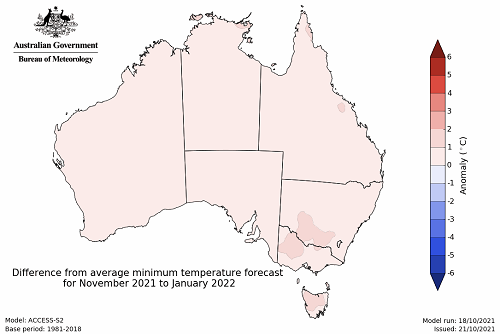
The temperature outlook for November to January indicates that maximum temperatures across most of Australia are likely to be close to the 1990-2012 average (- 1°C to 1°C). Minimum temperatures are expected to be slightly above average for parts of southern New South Wales, western Victoria and northern Tasmania (Bureau of Meteorology ‘National Climate Outlook’, 21 October 2021).
Predicted maximum temperature anomaly for November 2021 to January 2022
Predicted minimum temperature anomaly for November 2021 to January 2022
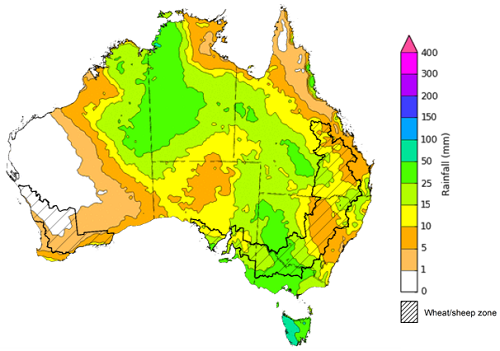
Over the 8-days to 4 November 2021 a series of troughs, low-pressure systems and cold fronts are expected to bring showers and storms to large area of northern, central and eastern Australia. Meanwhile, high pressure systems are expected to bring dry weather conditions to much of Western Australia over the next 8 days.
Rainfall totals of between 10 and 50 millimetres are forecast for north-eastern, western and southern New South Wales, south-eastern, central and western Queensland, Victoria, the north-east of Western Australia, much of South Australia and the Northern Territory, and Tasmania. Rainfall in excess of 50 millimetres is expected in western Tasmania.
In Australian cropping regions, rainfall totals of between 10 and 50 millimetres are expected across much of Queensland, southern and north-eastern New South Wales, Victoria and South Australia. Little to no rainfall is forecast for cropping regions in central New South Wales and Western Australia during the next 8-days.
The rainfall expected in northern and eastern Queensland will likely boost soil moisture levels, which are currently average to below average in parts, and assist the germination and establishment of early sown summer crops. The rainfall forecast for southern Queensland and northern New South Wales are likely to delay some harvest activities of winter crops. Soil moisture levels remain average to above average across central and southern New South Wales, Victorian, most South Australian and Western Australian cropping regions for this time of year. As a result, yield potentials remain strong as crops continue through grain filling.
Total forecast rainfall (mm) for the period 28 October to 4 November 2021
Note: This rainfall forecast is produced from computer models. As the model outputs are not altered by weather forecasters, it is important to check local forecasts and warnings issued by the Bureau of Meteorology.
Water
Water storages, water markets and water allocations - current week
The Tableau dashboard may not meet accessibility requirements. For information about the contents of these dashboards contact ABARES.
