
Key issues
- In the week ending 6 November 2024, low-pressure systems and troughs brought rainfall to northern and eastern parts of the country.
- Across cropping regions, little to no rainfall was recorded across most areas this week. Rainfall totals of between 5 and 50 millimetres were recorded across parts of northern and central Queensland.
- Over coming days, low-pressure systems are expected to bring showers over parts of northern, central and eastern Australia. High-pressure systems are expected to keep remaining areas largely dry.
- Across cropping regions, some rainfall is expected across north-eastern growing regions. If realised, high rainfall totals in the east could interrupt the harvest of winter crops.
- Little to no rainfall forecast across southern Australia will provide for an uninterrupted harvest of winter crops for grain and hay where harvest has commenced. Areas which did not receive rainfall last week may see further declines in grain yields for later sown crops and farmers will be making decisions on whether to cut these crops for hay or turn them over for livestock grazing as grain yield and relative returns for grain compared to hay continue to decline.
- Nationally, October rainfall was well above average in the west and north, with much of the remainder of the country recording average to below average rainfall.
- For the 3 months to October 2024, above average rainfall totals resulted in average to extremely high pasture production across large parts of eastern, western, and central Australia. Below average to extremely low pasture growth was recorded in some southern areas and isolated regions in the east.
- Soil moisture models continue to indicate low soil moisture levels in southern Australia, with above average soil moisture modelled in eastern Queensland, northern New South Wales, and large parts of Western Australia and the Northern Territory.
- Water storage levels in the Murray-Darling Basin (MDB) decreased between 31 October 2024 and 07 November 2024 by 282 gigalitres (GL). Current volume of water held in storage is 16 677 GL, equivalent to 75% of total storage capacity. This is 15 percent or 3,341GL less than at the same time last year. Water storage data is sourced from the BOM.
- Allocation prices in the Victorian Murray below the Barmah Choke increased from $139 on 31 October 2024 to $150 on 07 November 2024. Prices are the same in the Murrumbidgee and Victorian Murray Below Choke due to IVT (intervalley trade) being permitted between the regions.
Climate
For the week ending 6 November 2024, low pressure systems brought rainfall to parts of northern and eastern Australia. Rainfall totals of up to 100 millimetres were recorded in scattered areas of northern Western Australia, Queensland, and the Northern Territory. Across the east coast parts of south-eastern Queensland and north-eastern New South Wales recorded rainfall totals of between 5 and 50 millimetres. In Tasmania, a cold front brought a maximum of 50 millimetre of rainfall to the west coast.
Across cropping regions, little to no rainfall was recorded across most areas this week. The exception being parts of northern and central Queensland, which saw isolated falls of between 5 and 50 millimetres. With the harvest of winter crops underway, wet conditions across parts of Queensland may have interrupted harvest in some areas. Little to no rainfall across southern and western cropping regions would have allowed for a largely uninterrupted harvest of winter crops.
Rainfall for the week ending 6 November 2024
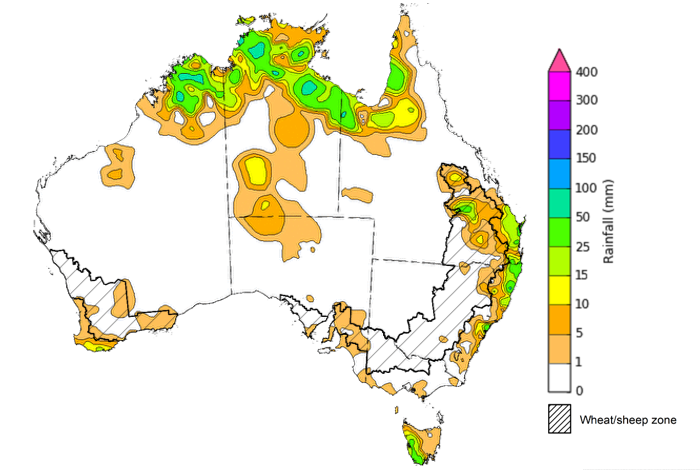
Issued: 6/11/2024
Note: The rainfall analyses and associated maps utilise data contained in the Bureau of Meteorology climate database, the Australian Data Archive for Meteorology (ADAM). The analyses are initially produced automatically from real-time data with limited quality control. They are intended to provide a general overview of rainfall across Australia as quickly as possible after the observations are received. For further information go to http://www.bom.gov.au/climate/rainfall/
Over the 8 days to 14 November 2024, low-pressure systems and troughs are expected to bring showers and storms across parts of northern Australia, extending into central and eastern parts of the country. Falls of between 5 and 50 millimetres of rainfall is forecast in eastern and southern Western Australia, the Northern Territory, South Australia and Tasmania. Lighter falls of between 5 and 25 millimetres are forecast for southern Victoria. Meanwhile, heavier falls of between 10 and 100 millimetres are forecast for the south-eastern Queensland and across eastern New South Wales. High pressure systems are expected to keep the remainder of the country largely dry.
Across cropping regions, rainfall totals are forecast to be relatively low across most southern growing regions. Much of southern New South Wales, Victoria, South Australia, and Western Australia are forecast to see rainfall totals of between 1 and 10 millimetres. In contrast, much of Queensland and northern New South Wales, are likely to see rainfall totals of between 10 and 50 millimetres.
If realised, high rainfall totals in the east could interrupt the harvest of winter crops. Little to no rainfall forecast across southern Australia will provide for an uninterrupted harvest of winter crops for grain and hay where harvest has commenced. In areas which did not receive rainfall last week, another dry week may see further declines in grain yields in later sown crops and farmers will be making decisions on whether to cut these crops for hay or turn them over for livestock grazing as grain yield and relative returns for grain compared to hay continue to decline.
Total forecast rainfall for the period 7 November to 14 November 2024
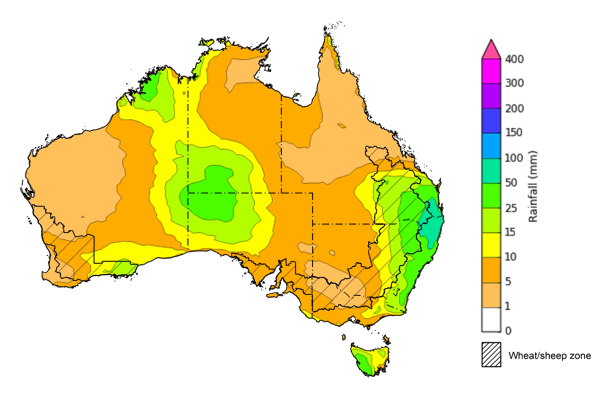
Issued 7/11/2024
Note: This rainfall forecast is produced from computer models. As the model outputs are not altered by weather forecasters, it is important to check local forecasts and warnings issued by the Bureau of Meteorology.
During October 2024, rainfall was well above average to extremely high across much of Western Australia and isolated areas of the northern tropics. Above average rainfall was also observed across scattered areas of south-eastern Australia. In contrast, large areas of southern and central saw extremely low to below average rainfall. The remainder of Australia saw generally average October rainfall.
In cropping regions, October 2024 rainfall was generally below average to average, with parts of southern Western Australia and southern New South Wales see well below average rainfall. In contrast, northern Western Australian cropping regions experienced well above average rainfall. In Queensland and New South Wales, lower rainfall totals would have supported the harvest of winter crops in the second half of the month. Following extremely low to below average rainfall in previous months across much of Victoria and South Australia, late October rainfall was likely to have been sufficient to arrest further reduction in the yield potential of winter crops.
Rainfall percentiles for October 2024
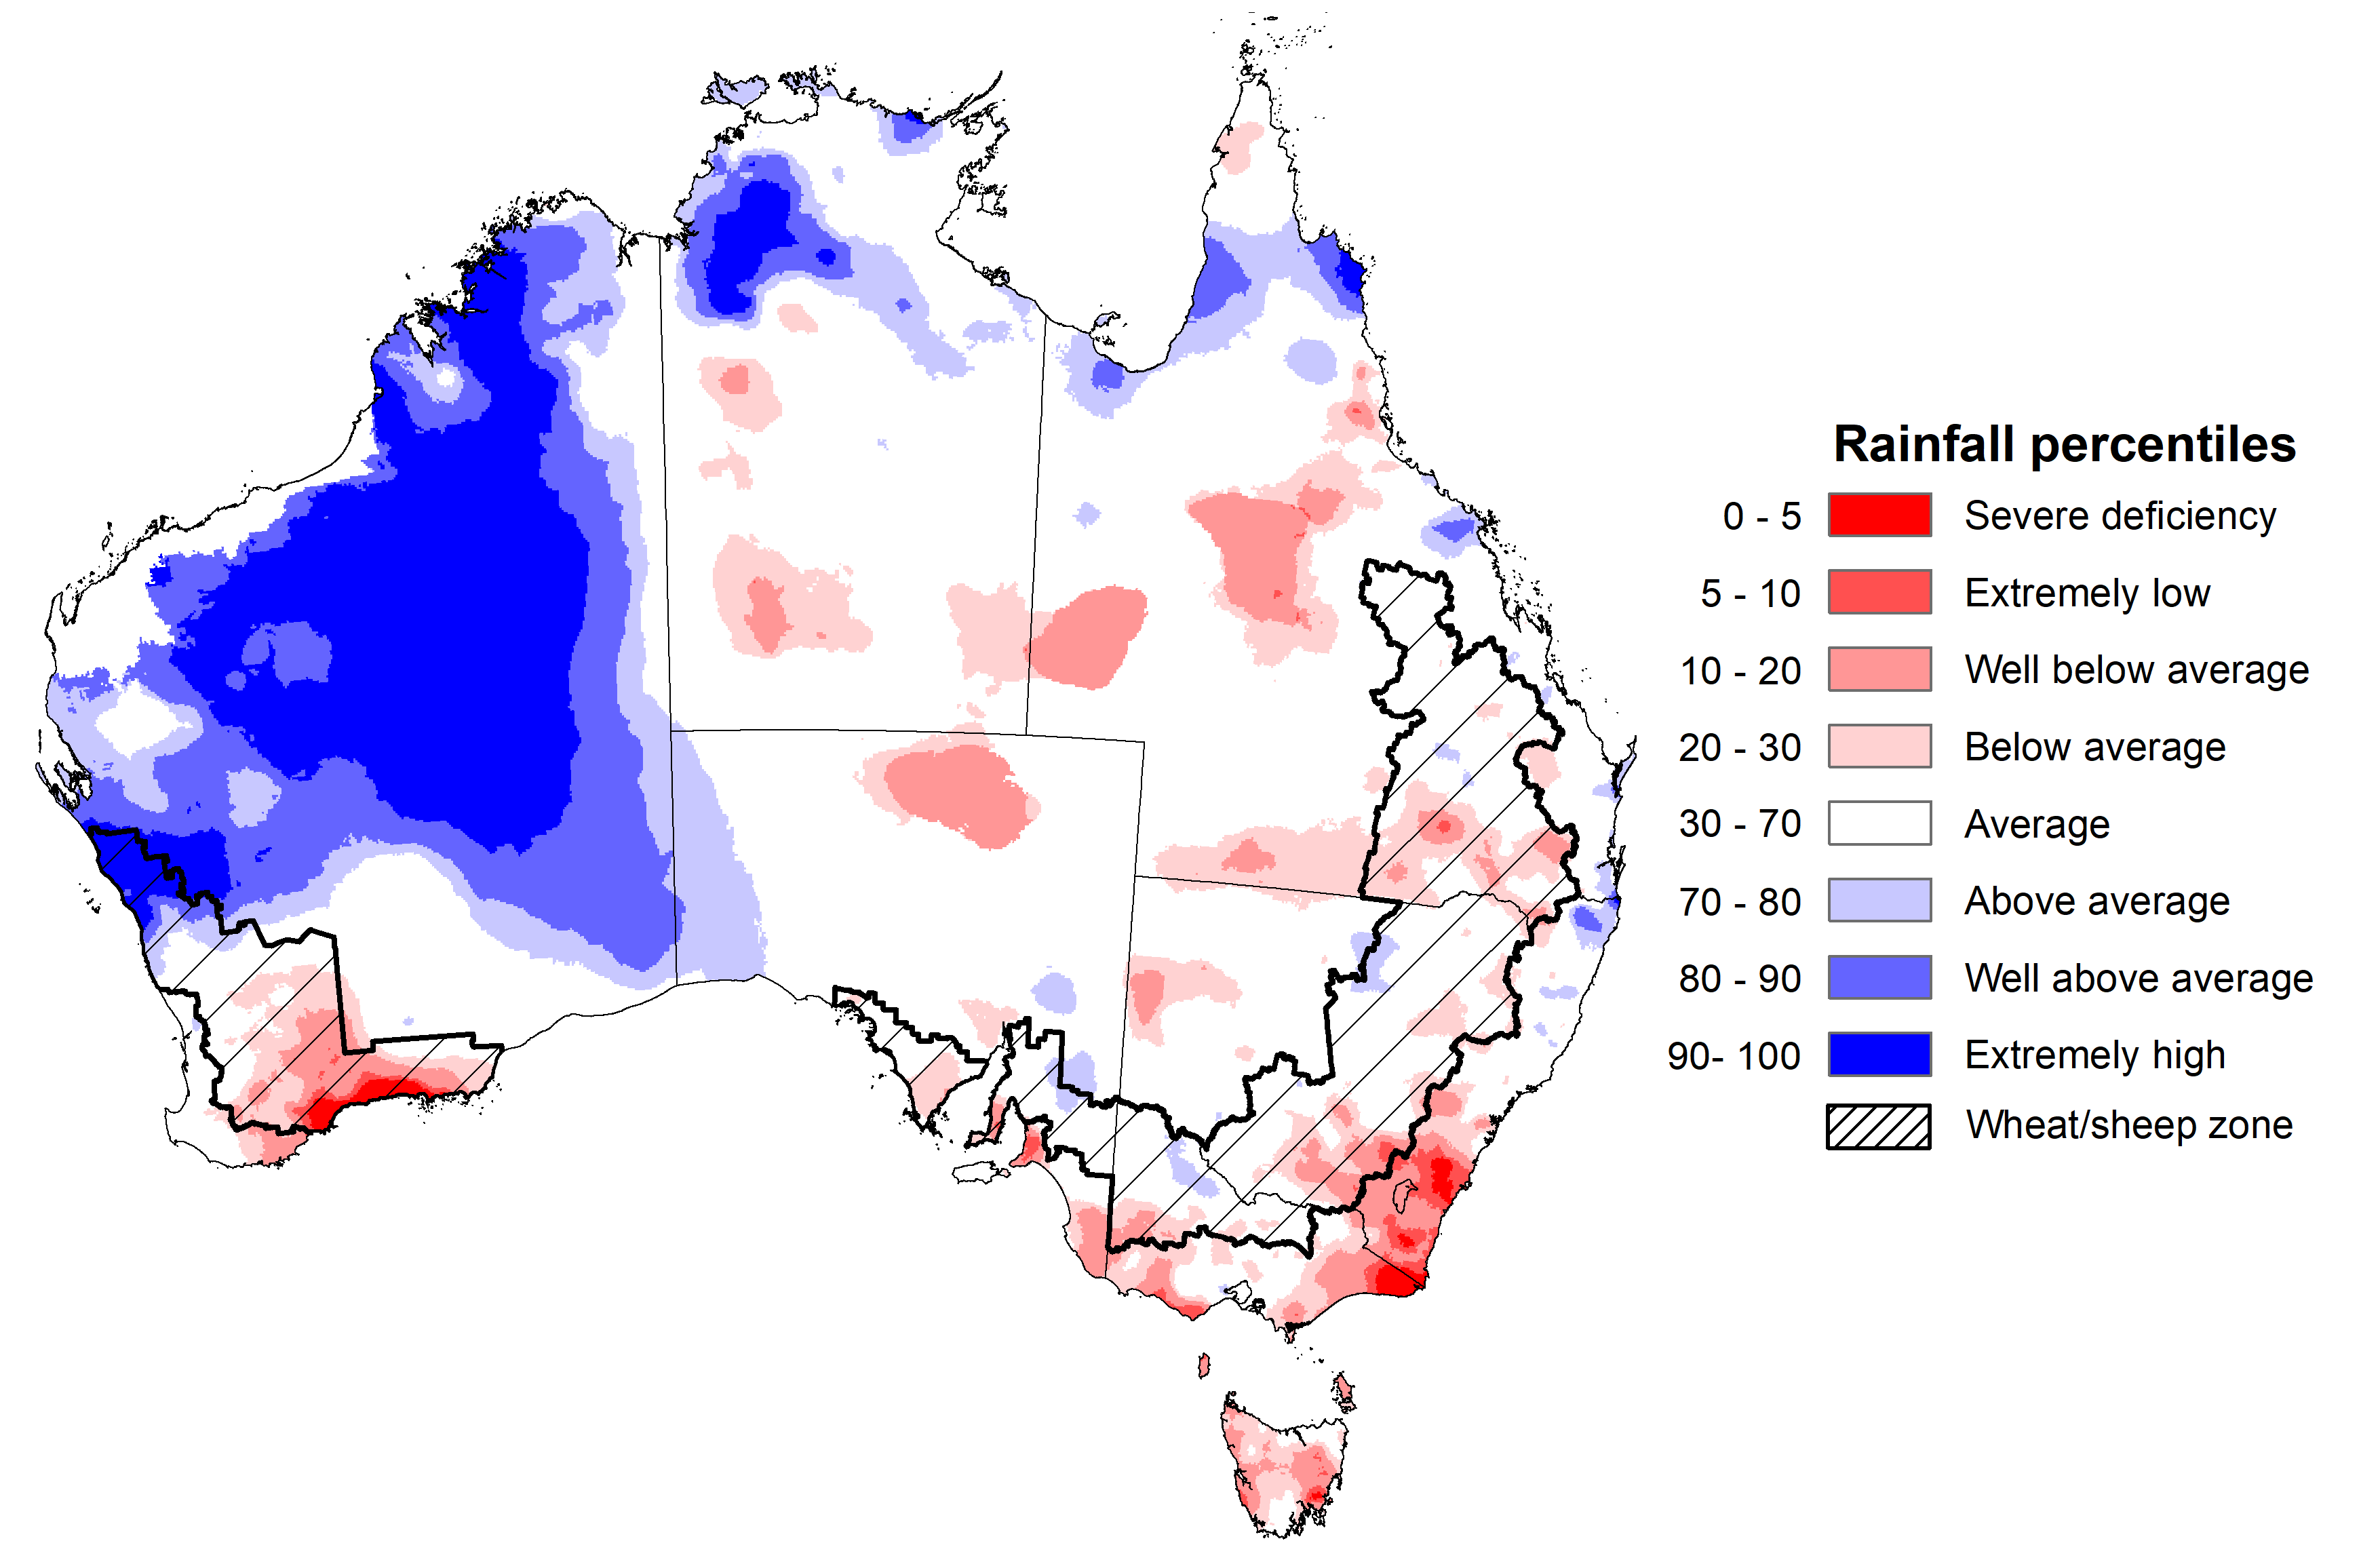
Source: Bureau of Meteorology
Modelled upper layer soil moisture varied considerably between the eastern and western parts of the country. Much of Western Australia saw very much above average soil moisture for the period, with the exception of some southern areas with below average soil moisture. Much of the eastern two-thirds of the country saw close to average upper layer soil moisture for this year. In contrast, parts of eastern Victoria, south-eastern New South Wales, Tasmania, and isolated areas of central South Australia and Queensland were modelled with below average or very much below average upper layer soil moisture.
At this time of year, upper layer soil moisture is less critical for well-established winter crops. However, upper layer soil moisture will be critical for supporting the germination and establishment of summer crops in the coming months.
Across cropping regions, upper layer soil moisture in October was modelled to be generally average across much of Queensland, New South Wales, Victoria, and South Australia. Some areas of central Queensland and northern New South Wales were modelled to have above average soil moisture. In Western Australia, upper layer soil moisture varied considerably between northern and southern cropping regions, with very much above average upper layer soil moisture modelled in the north, and very much below average in the south. Timely rainfall in the coming weeks will be critical to support the development and arrest sliding yield prospects of winter crops across southern growing regions and boost upper lower soil moisture for the planting of summer crops in northern growing regions.
Modelled upper layer soil moisture for October 2024
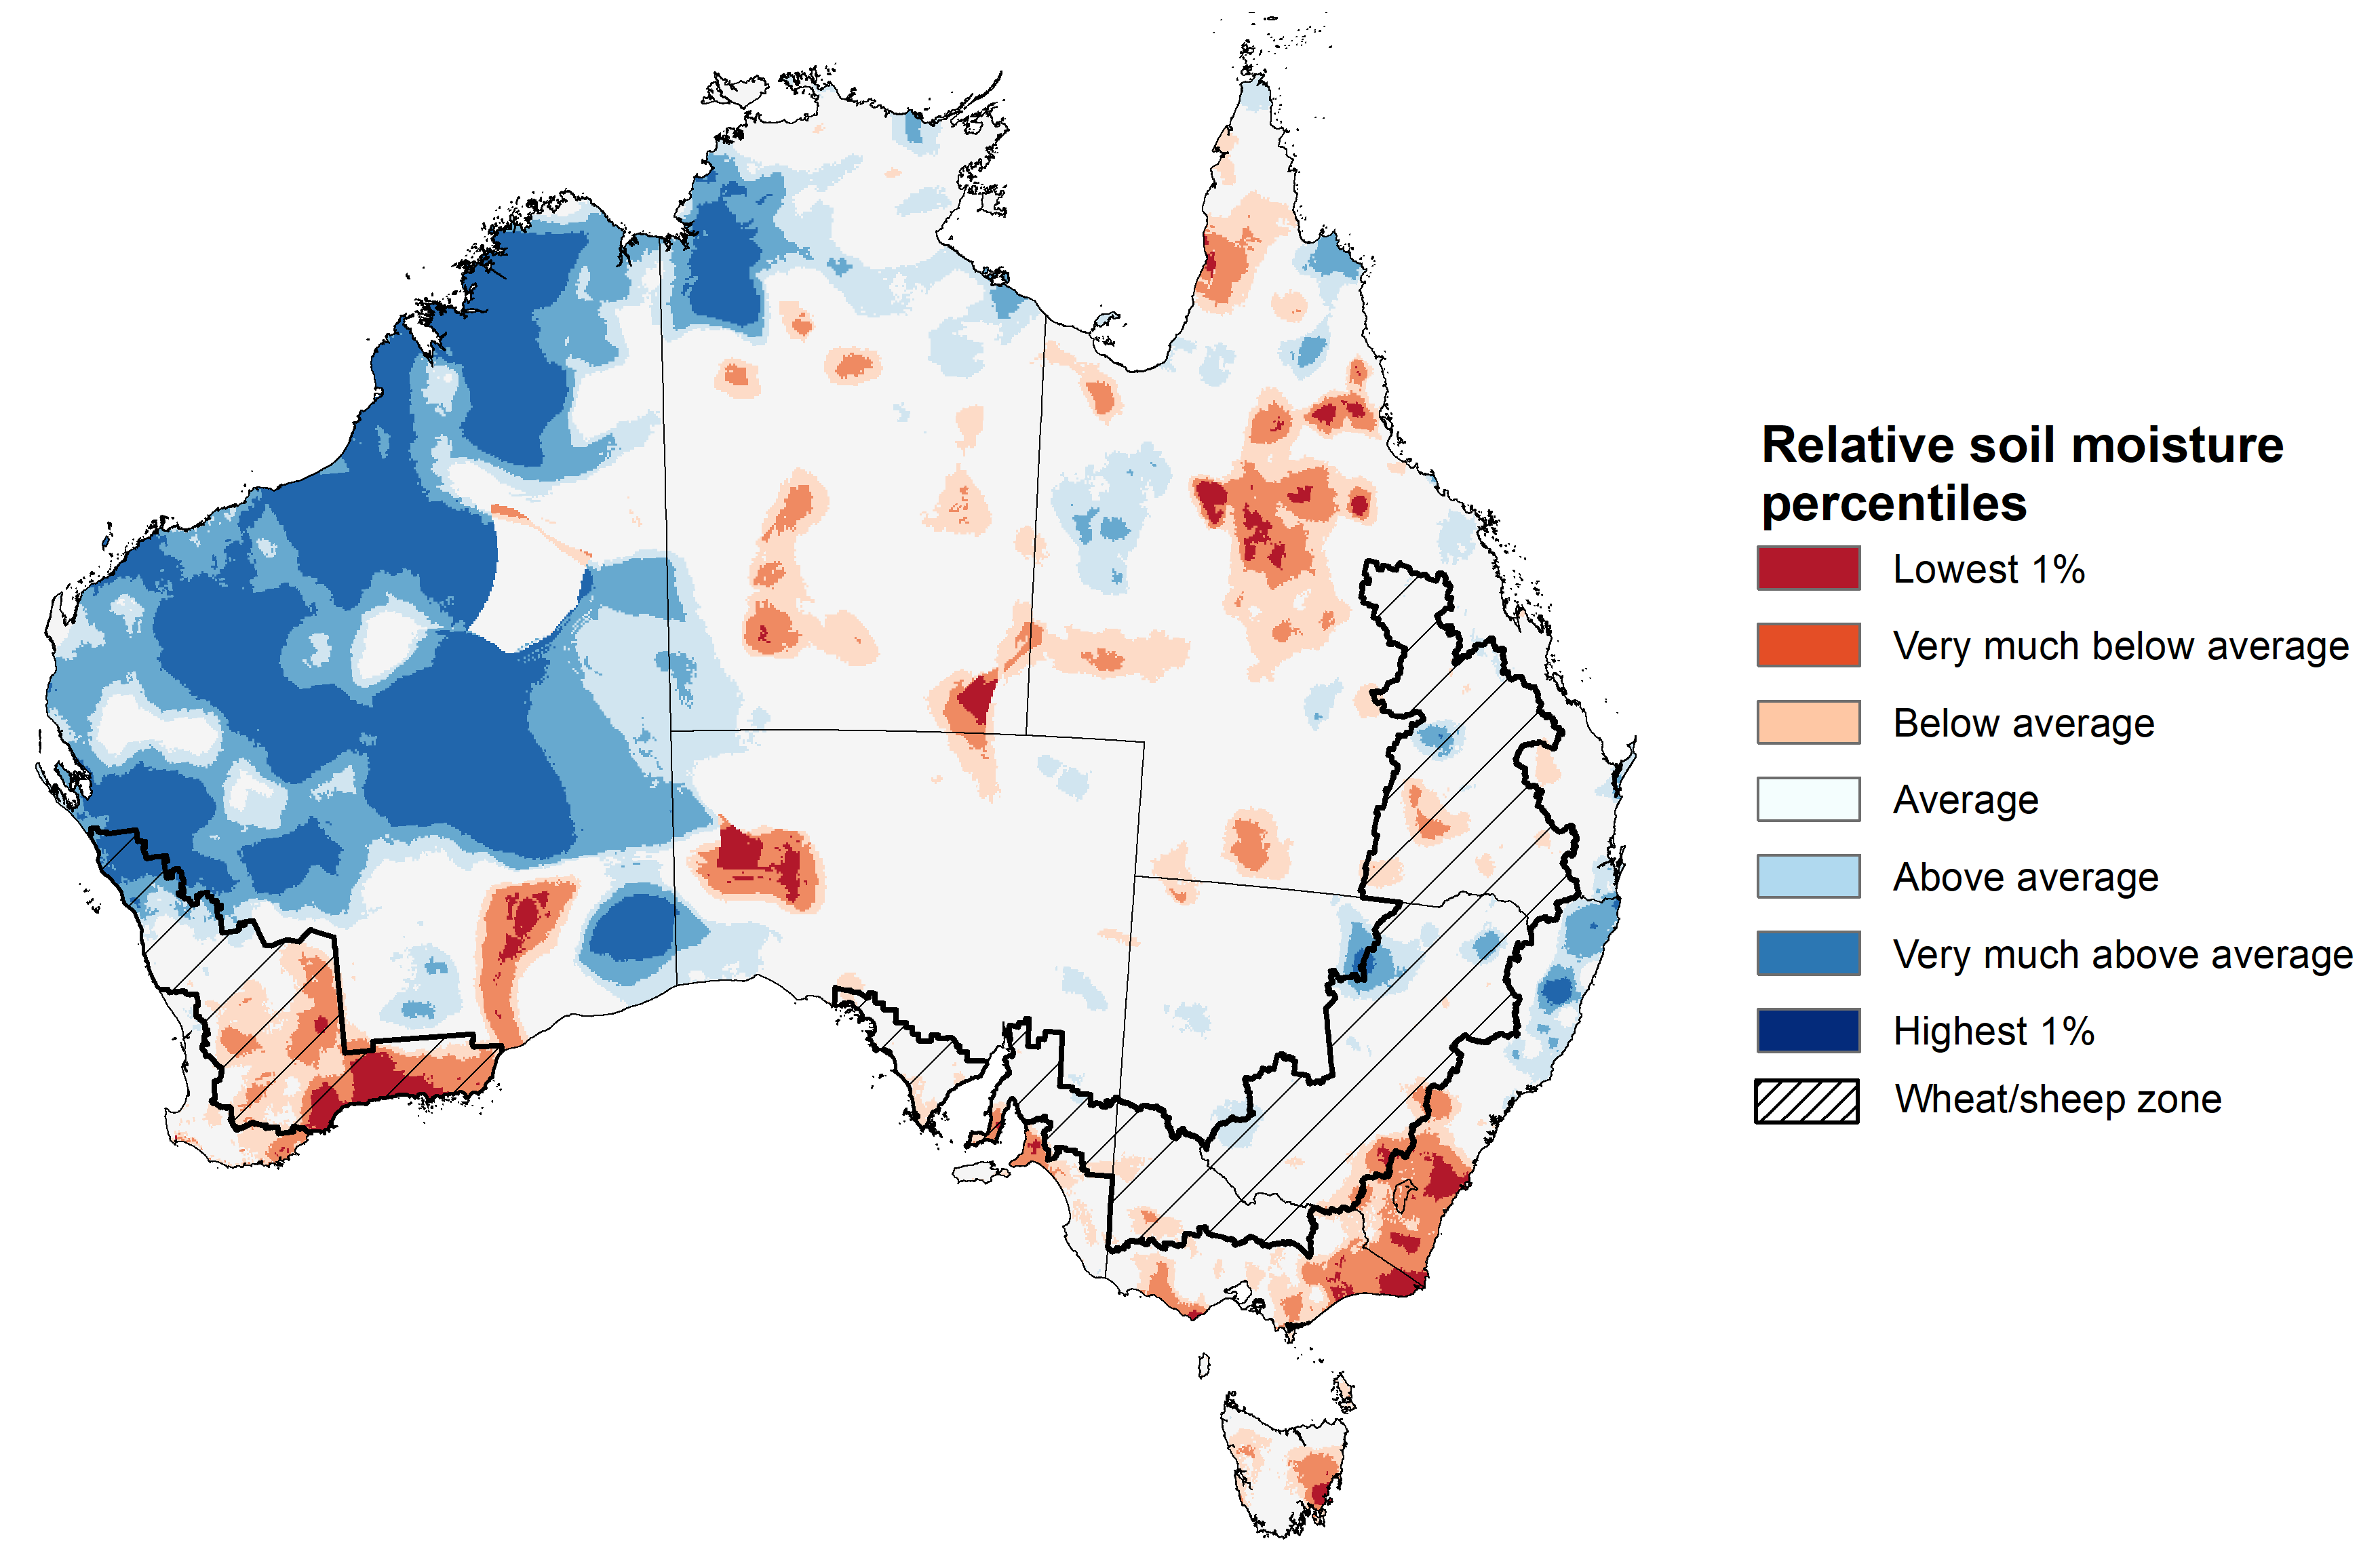
Source: Bureau of Meteorology (https://awo.bom.gov.au/about/overview)
Across northern and central Australia, lower layer soil moisture was average to very much above average, with northern Western Australia, western Northern Territory and scattered parts of eastern Queensland seeing very high soil moisture levels for this time of year. In contrast, large areas of southern Australia and central Queensland were modelled to have extremely low to below average lower layer soil moisture.
Lower layer soil moisture plays a pivotal role in sustaining the growth of winter crops and pasture during their critical development stages.
Across cropping regions, lower layer soil moisture was generally average in Queensland and much of New South Wales, northern Victoria and eastern South Australia. In Western Australia, lower layer soil moisture varied between northern and southern cropping regions, with very much above average upper layer soil moisture modelled in the north, and very much below average in the south. In western South Australia, southern Victoria, and southern New South Wales, October lower layer soil moisture was modelled to be extremely low to below average for this time of year. Cropping regions in far southern Australia with extremely low levels of stored soil moisture will require sufficient and timely rainfall for the remainder of spring to arrest declining levels of crop and pasture production.
Modelled lower layer soil moisture for October 2024
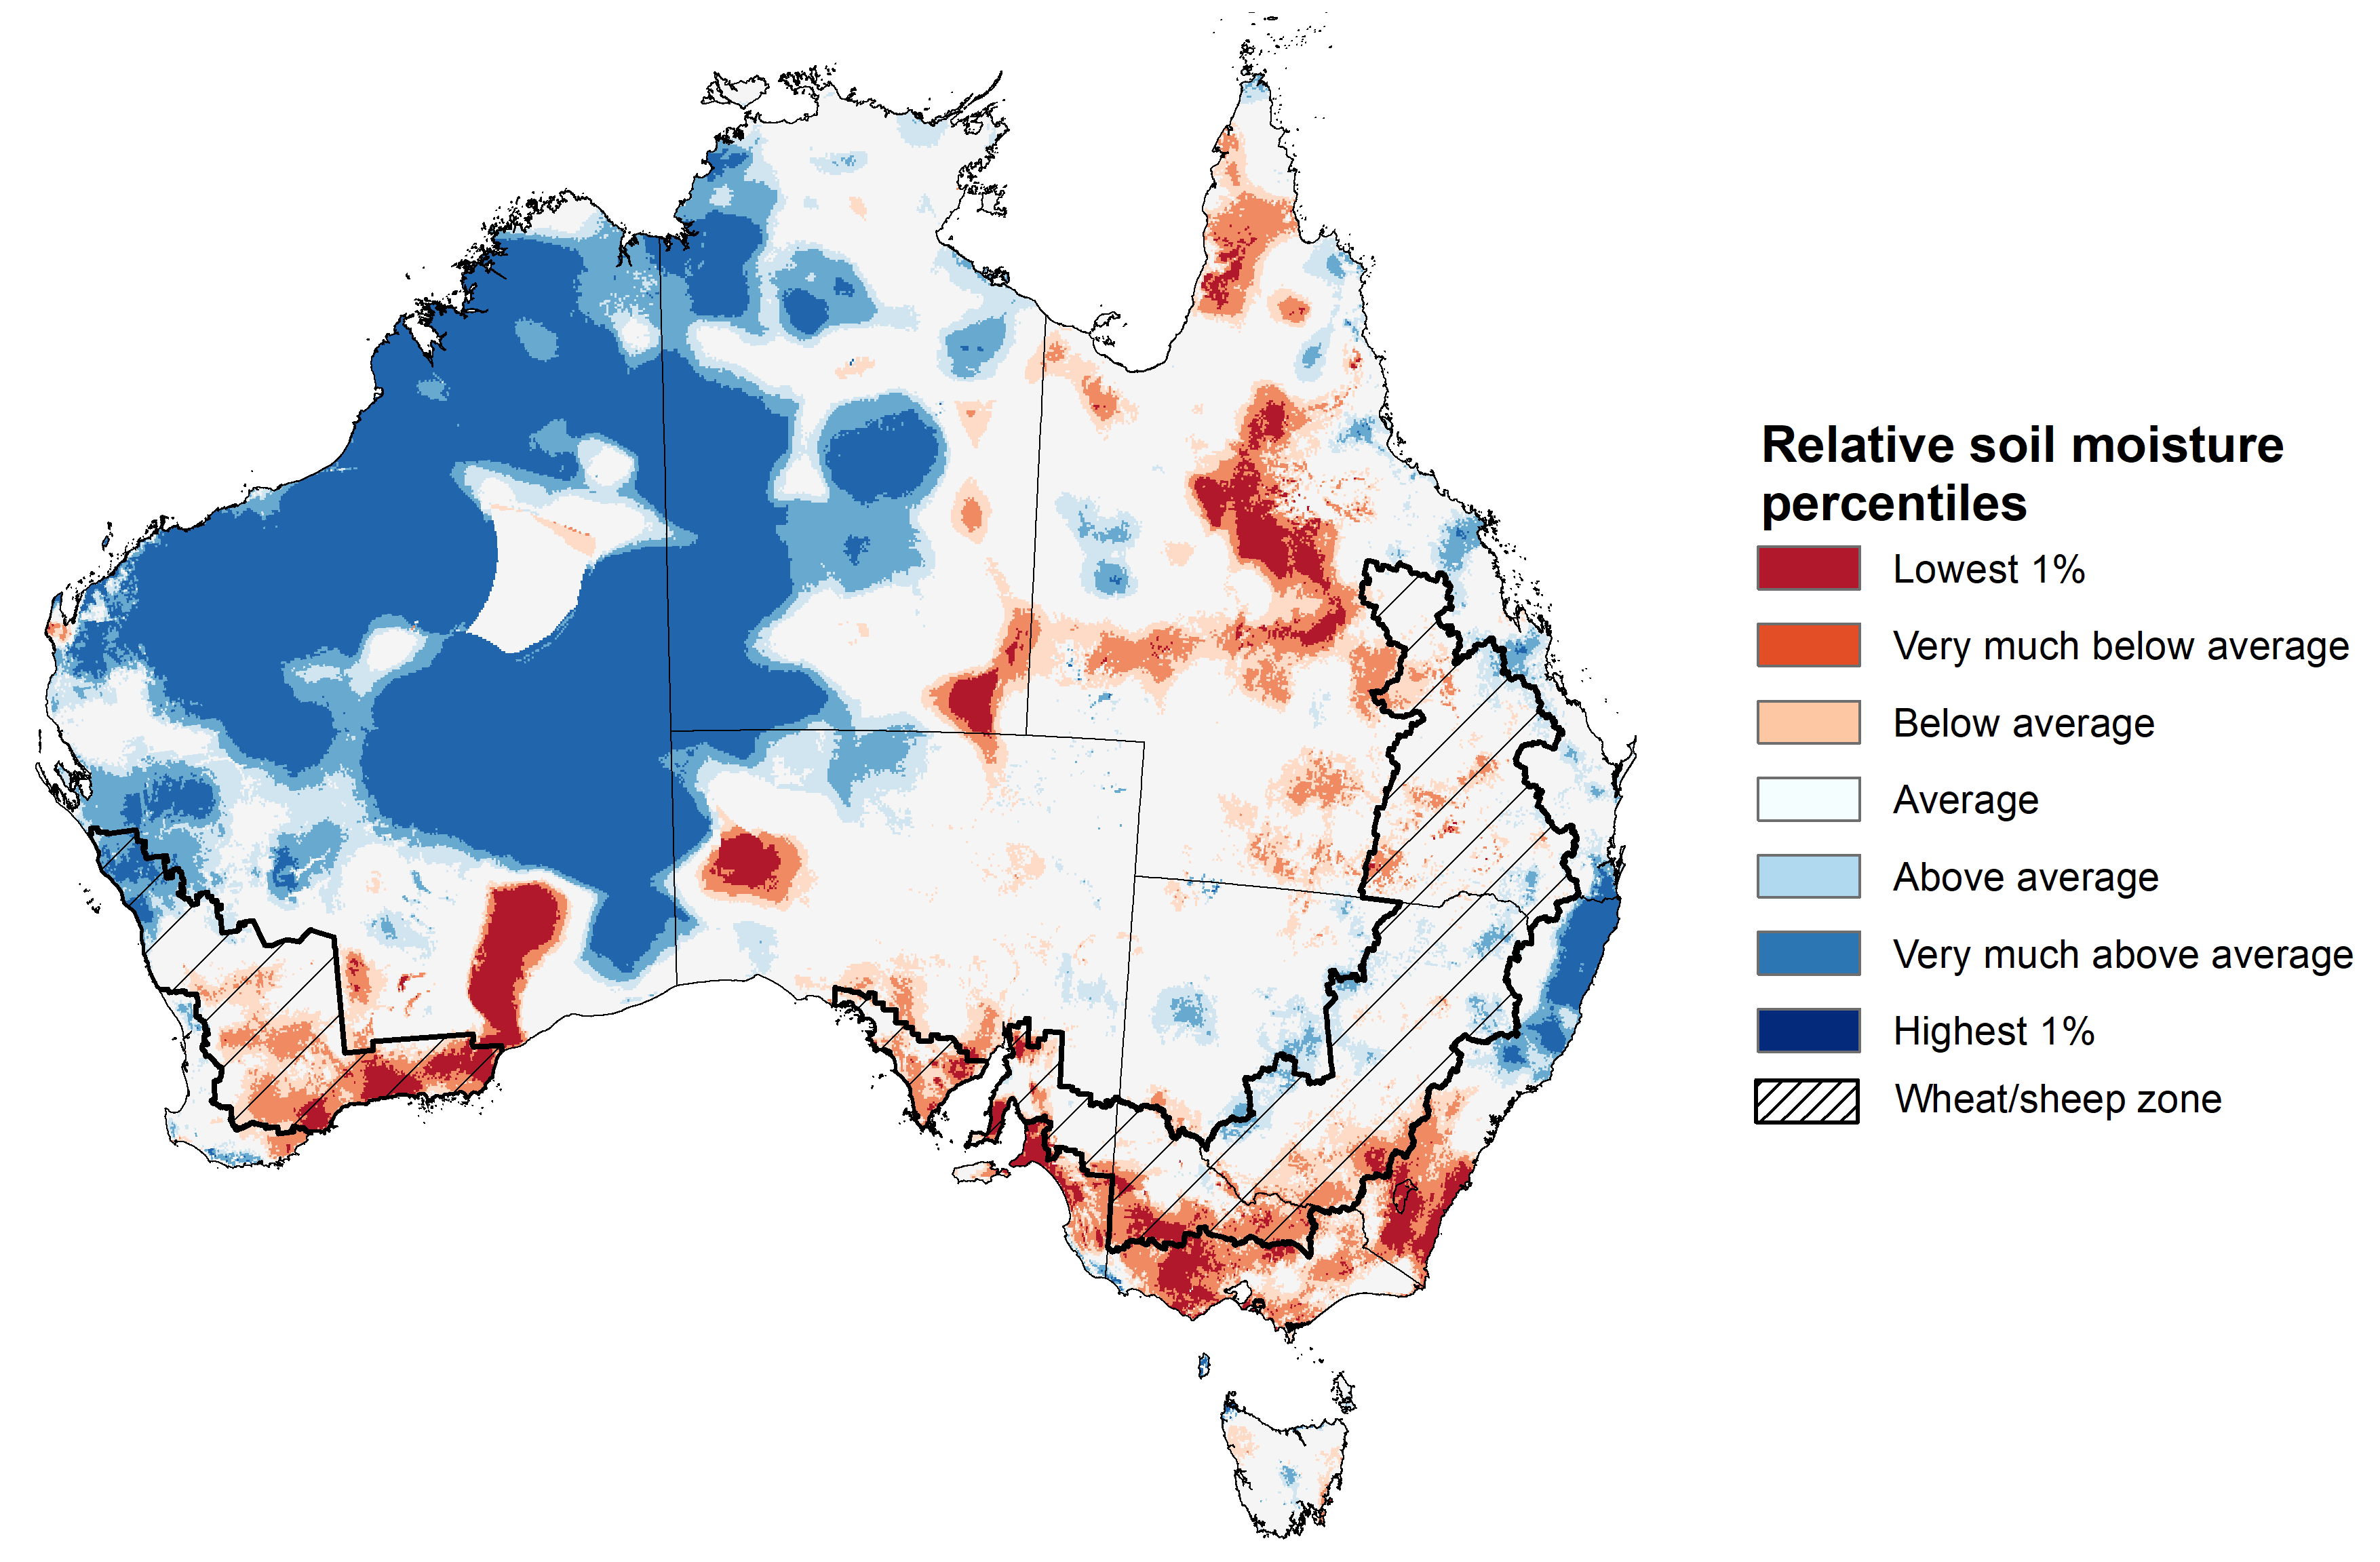
Source: Bureau of Meteorology (https://awo.bom.gov.au/about/overview)
October typically sees the transition from the northern Australia dry season (May to September) to the wet season, with the northern rainfall onset occurring in several regions already. Pasture growth in the dry season typically declines significantly due to the reduction in water availability, with livestock relying on pasture grown throughout the previous wet season. Across southern Australia, July to September pasture growth influences the number of livestock than can be supported without supplementary feeding over winter and the level of reliance on hay and grain during this period. Pasture availability during this period influences the growth and branding and marking rates of lambs and calves, livestock turnoff and the production of meat, milk, and wool.
For the 3 months to October 2024, average to extremely high pasture growth relative to this time of year was modelled across much of north-eastern New South Wales, eastern Queensland, southern Victoria, the far south of South Australia, isolated areas of the central and north Northern Territory and much of south-west Western Australia. This growth is likely to enable farmers to continue to maintain stock numbers and provide opportunities to build standing dry matter availability and replenish fodder supplies during spring.
In contrast, below average to extremely low pasture growth rates were recorded across large areas of the south and east of the country. Large areas of southern South Australia and northern Victoria, central parts of Queensland, central New South Wales and parts of south-eastern Western Australia, all saw below average to well below average pasture growth. Graziers in regions where below average pasture growth was recorded will be more reliant on supplemental feed to maintain current stocking rates and production.
Relative pasture growth for 3-months ending October 2024 (1 August to 31 October 2024)
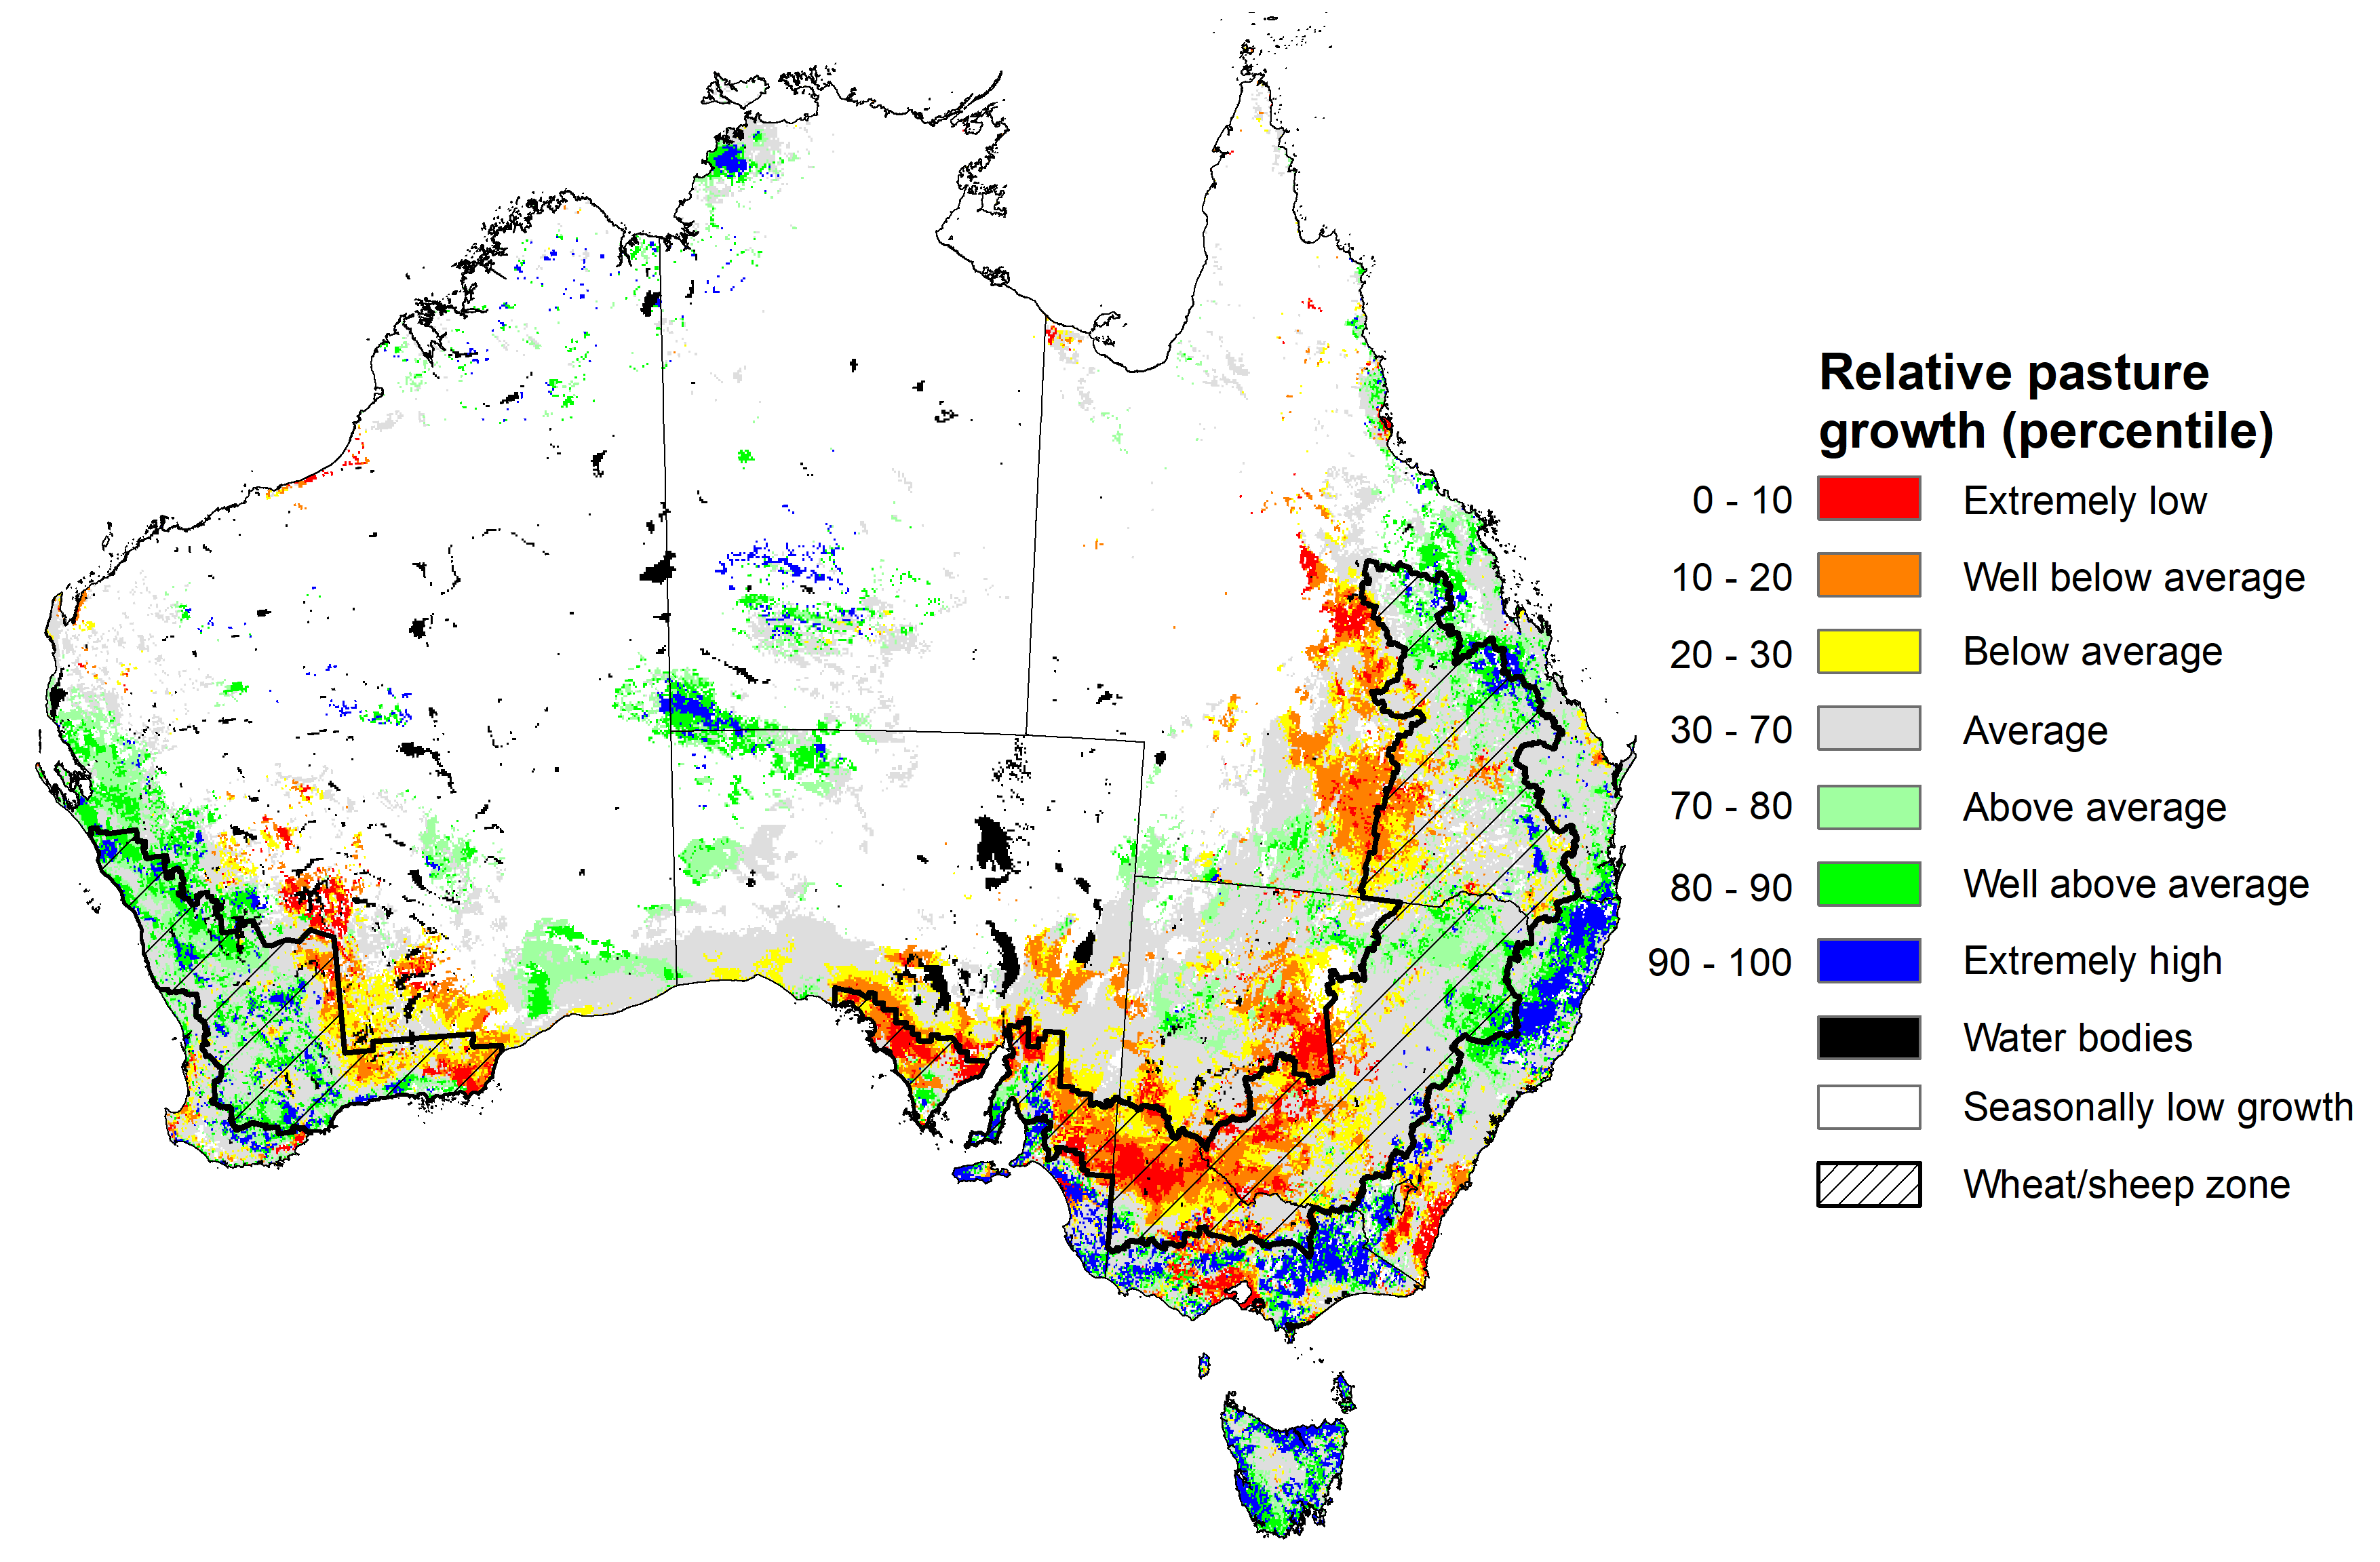
Source: Department of Environment, Science and Innovation
Water
Water storages, water markets and water allocations - current week
The Tableau dashboard may not meet accessibility requirements. For information about the contents of these dashboards contact ABARES.

Commodities
Information on weekly price changes in agricultural commodities is now available at the Weekly commodity price update.