
This section presents socio-economic indicators for the forestry sector drawn from the ABS 2011 and 2016 Census of Population and Housing. These build on the indicators presented in the AFWPS September and December quarters 2012 (ABARES 2012) PDF ![]() [2.01 MB, 11 pages], which reported data from the 2006 and 2011 Censuses. For background to the indicator framework and calculations, see previous ABARES reports (Binks, Schirmer & Kancans 2014; Schirmer et al. 2013).
[2.01 MB, 11 pages], which reported data from the 2006 and 2011 Censuses. For background to the indicator framework and calculations, see previous ABARES reports (Binks, Schirmer & Kancans 2014; Schirmer et al. 2013).
The five-yearly ABS Census is a key source of information on the socio-economic characteristics of employees in the forestry sector and the communities in which they live. National and regional-scale data provide a basis for the community, government and industry to understand, monitor and manage the implications of changes in the forestry sector.
[expand all]
Employment trends
Forestry sector employment is a key contribution to the community, providing economic activity and skills development and contributing to broader community wellbeing. Total national direct employment in the forestry sector was estimated at 51,983 persons in 2016, down by 24 per cent from 68,596 persons in 2011. This decrease continues the previous trend of declining total direct employment in the five years prior to 2011. In 2016 total direct forestry sector employment fell in all states and territories except the Northern Territory, where it increased by 15 per cent. Indirect (or flow-on) employment in other industries generated from activities in the forestry sector is an important contribution but robust estimates of indirect employment are not currently available.
Total direct employment in the forestry sector falls into four subsectors: forestry and logging; forestry support services; wood product manufacturing; and pulp and paper product manufacturing. Employment is highest in the wood product manufacturing subsector (29,035 persons in 2016), and the pulp and paper product manufacturing subsector (13,962 persons in 2016). Between 2011 and 2016 employment decreased in both these subsectors (by 30 per cent in wood product manufacturing and 28 per cent in pulp and paper product manufacturing). Over the same period, employment increased in the forestry and logging subsector (by 12 per cent to 6,027 persons), and the forestry support services subsector (by 36 per cent to 2,957 persons) (Figure 8). Changes in employment levels in recent years have been influenced by multiple factors that are observed nationally but can vary at the regional scale. These factors include increased harvesting of plantation hardwood logs (ABARES 2018)—although this does not necessarily flow to more employment activity in the manufacturing sectors if products are exported as woodchips—and a trend in manufacturing sectors to consolidate to larger processing facilities with higher labour efficiencies (Schirmer et al. 2018).
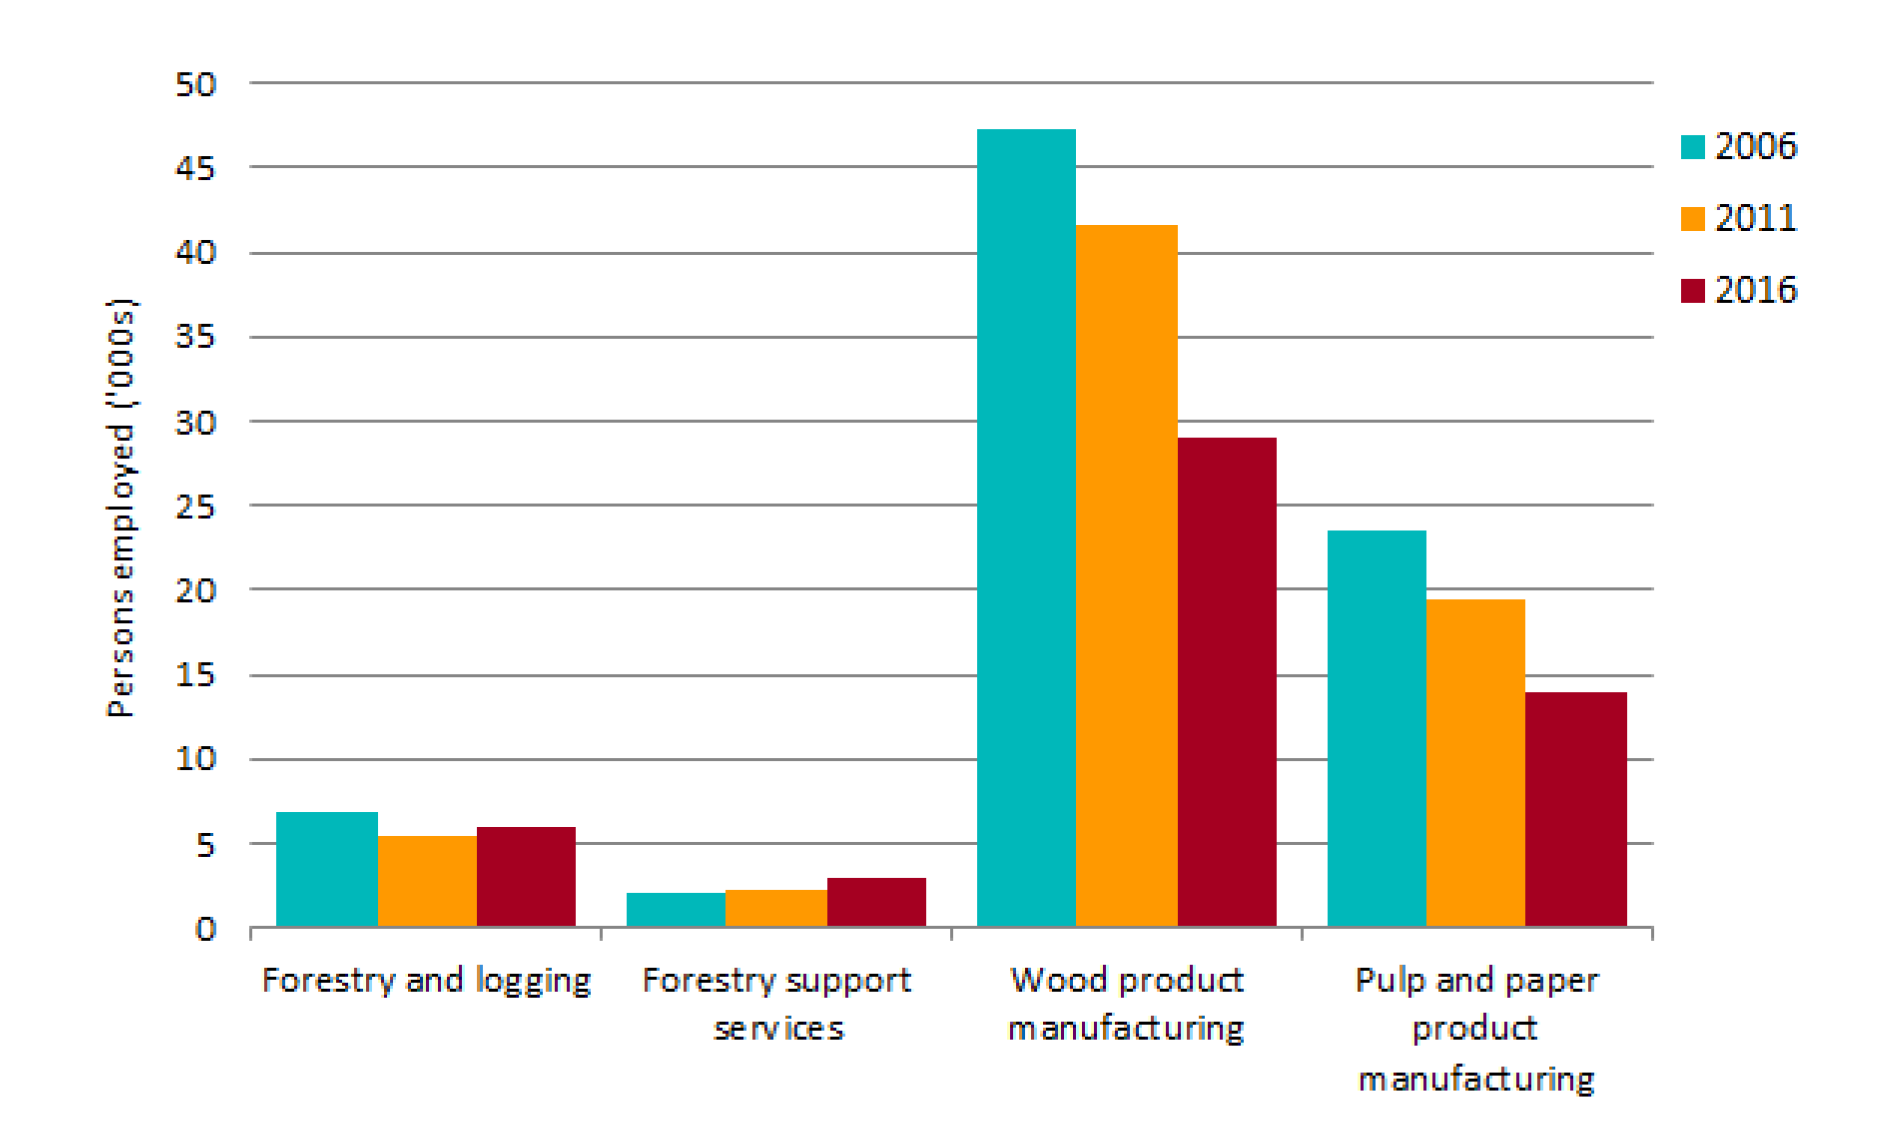
Increased employment in the forestry and logging subsector between 2011 and 2016 was due mostly to higher employment in the subsector in South Australia and Victoria—particularly in the Green Triangle region, where initial harvesting and re-establishment of hardwood plantations has driven jobs growth (Schirmer et al. 2017).
The number of persons employed in the forestry support services subsector in 2016 increased in most reporting regions—by more than 60 per cent in the regions of Central Victoria–Murray, South West and Central West NSW, South West Western Australia and Northern Australia.
The majority of employment in the pulp and paper product manufacturing subsector and to a lesser extent the wood product manufacturing subsector is in capital city regions. Between 2011 and 2016 total employment in these subsectors decreased more in capital city regions (compared with regional areas) and in all states and territories. In the wood product manufacturing subsector, employment decreased significantly in Tasmania (around 700 less persons employed) and in Western Australia (around 1,000 less persons employed in Perth). In the pulp and paper product manufacturing subsector, employment decreased by over 2,500 persons in Victoria, mostly in Melbourne.
Community dependence on the forestry sector
The percentage of the total workforce directly employed in the forestry sector in a given area indicates that community’s employment dependence on the forestry sector at a point in time. Changes in dependence may be caused by broader change in economic diversity or total employment, or a change in employment in a specific sector.
Between 2011 and 2016 forestry sector employment dependence decreased from 0.7 per cent to 0.5 per cent. This decrease was due to higher total employment across Australia and lower total employment in the forestry sector over the same period. Tasmania had the highest forestry sector employment dependence in 2016 (at 1.2 per cent), followed by South Australia (0.7 per cent) and Victoria (0.6 per cent).
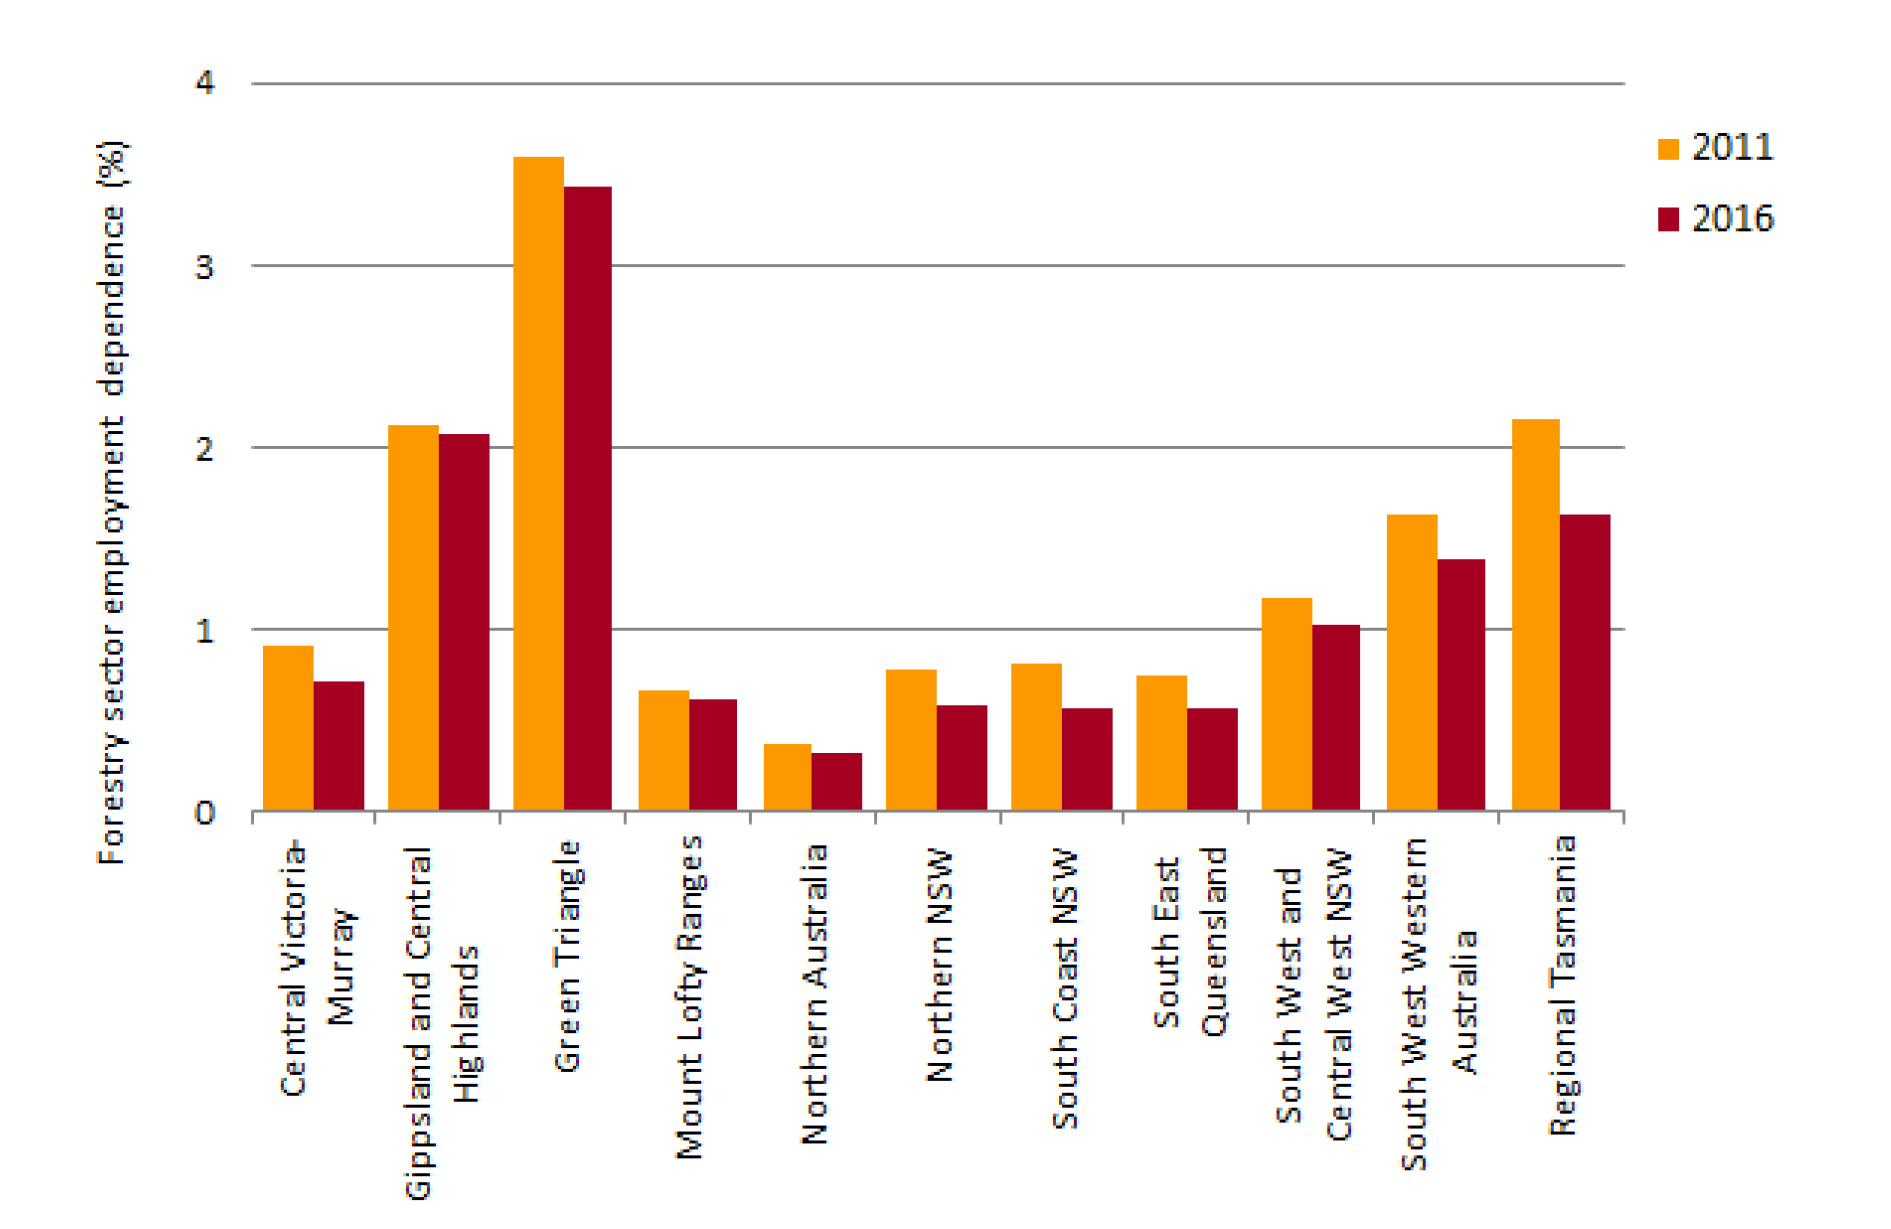
At a regional scale, the Green Triangle region had the highest forestry sector employment dependence of 3.4 per cent in 2016, down from 3.6 per cent in 2011. Regional Tasmania had the largest fall in employment dependence (from 2.1 per cent to 1.6 per cent), followed by the South Coast of NSW (from 0.8 per cent to 0.6 per cent) (Figure 9). Three local government areas with large forestry sector workforces had forestry sector dependence levels above 10 per cent in 2016—Mt Gambier (Green Triangle), Snowy Valleys and Oberon (South West and Central West NSW). In capital cities, where forestry sector dependence levels are lower due to greater industry diversity, dependence levels decreased in Hobart (down to 0.6 per cent) and Melbourne (down to 0.5 per cent).
Communities undergoing structural change and employment changes are likely to be better positioned to respond if they have a range of industries that can provide alternative opportunities. The economic diversity index provides a comparison of the overall industry diversity in each local government area in forestry reporting regions, relative to the Australian economy (Tables 70 to 91 in this issue).
Contribution of industry to community
Community participation in volunteering, community events and other community-based activities can influence the wellbeing of the community, through strengthening the social networks that can help hold communities together. The extent that people work long hours, and the stability of the workforce, are other factors that may potentially influence their ability to take part in community activities and thereby contribute to its social and economic viability (Schirmer et al. 2013). Comparing community participation indicators for workers in the forestry sector and the total workforce can assist in understanding the relative contribution of the sector to communities over time and across different regions.
Nationally, rates for workers in the forestry sector increased between 2011 and 2016, although remained lower than for members of the total Australian workforce (Figure 10). In 2016, 16.9 per cent of forestry sector workers volunteered in the 12 months before the 2016 Census, compared with 21.5 per cent of persons in the total national workforce. Hobart and the Green Triangle were the reporting regions with the highest forestry workforce volunteering rates (at around 24 per cent). Hobart was the only region where forestry sector workers made a greater contribution to the community through volunteering involvement than persons in the total national workforce.
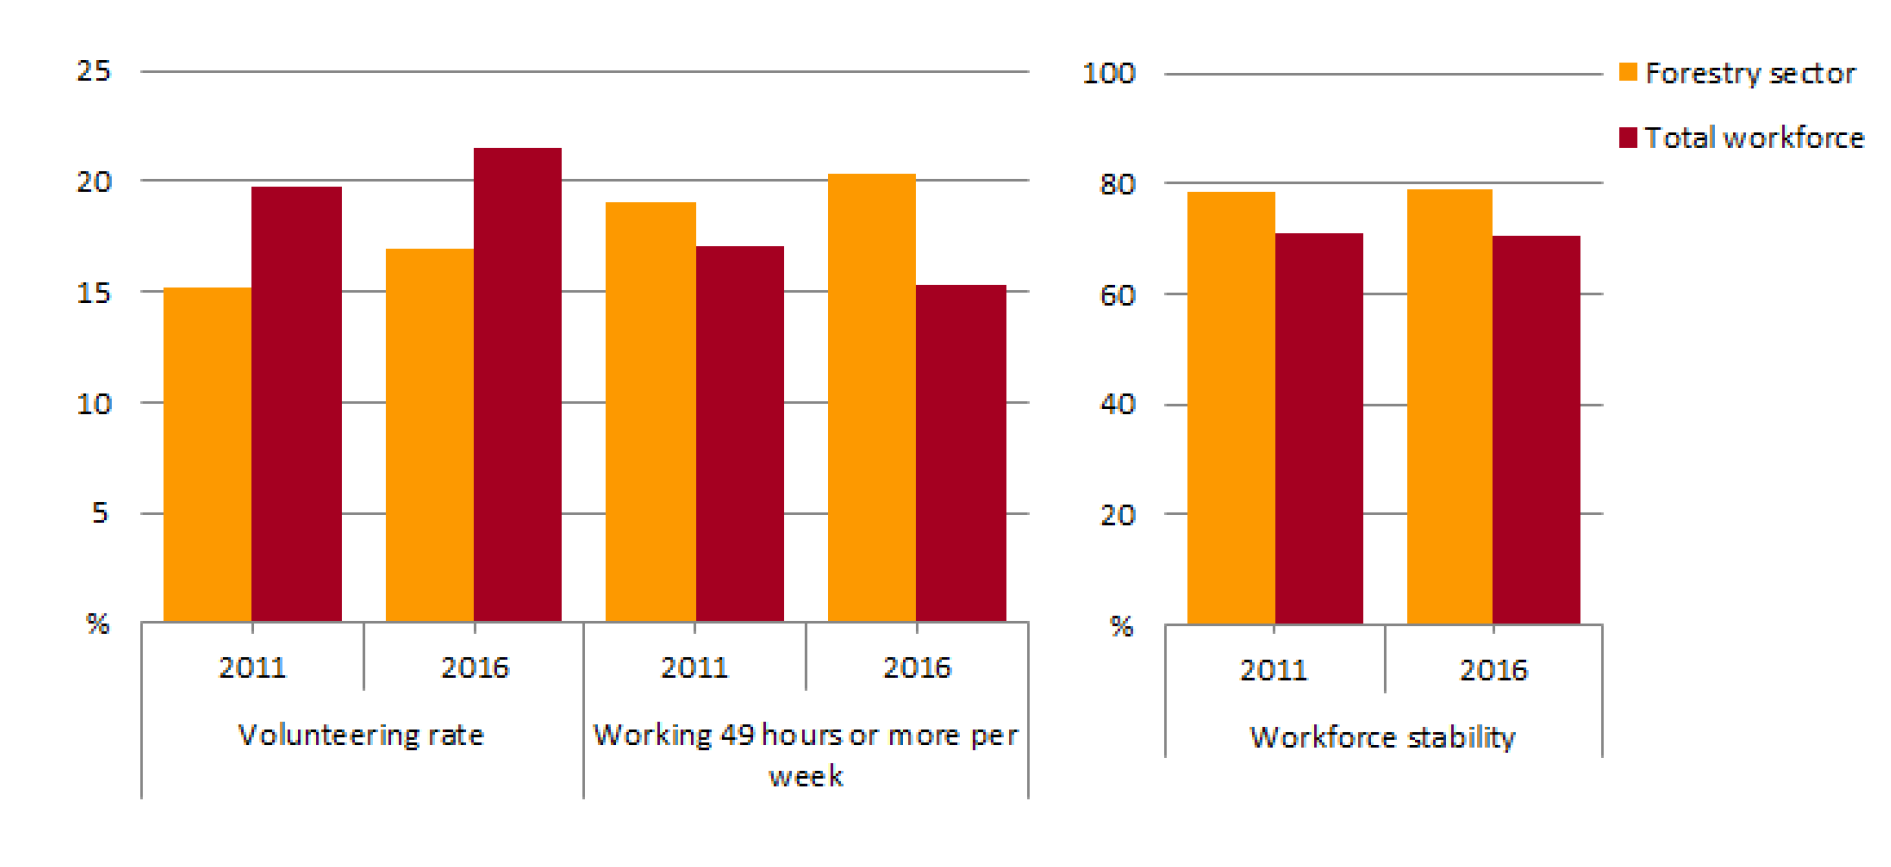
Forestry sector workers appear more likely to work long hours (49 hours or more per week) than persons in the total national workforce. Between 2011 and 2016 the percentage of forestry sector workers working long hours increased (from 19.0 per cent to 20.3 per cent) and the percentage of the total national workforce working long hours decreased (from 17.1 per cent to 15.4 per cent) (Figure 10). This suggests that forestry workers may have become relatively less able over this period to contribute time to their community. While working long hours may be a factor that can limit a person’s ability to take part in community activities, many other factors are involved including personal motivation and family commitments. Some people working long hours actively participate in their community.
Workforce stability in the forestry sector increased slightly between 2011 and 2016 and continued to be higher than in the total national workforce (Figure 10). In 2016, 79 per cent of forestry sector workers lived in the same local government area as five years before, compared with 71 per cent of persons in the total national workforce. At the regional scale, in 2016 the highest forestry workforce stability was 88 per cent in the Gippsland and Central Highlands region of Victoria. Levels of forestry workforce stability were relatively low in Darwin, Perth and the Mount Lofty Ranges region—indicating that a larger proportion of forestry sector workers had moved into those areas in the past five years, compared with forestry sector workers in other regions.
Workers’ wellbeing
Wellbeing can be measured by a person’s life satisfaction. Perceived quality of life, income, education and working hours have been found to be useful wellbeing predictors associated with self-reported life satisfaction and health measures (Binks, Schirmer & Kancans 2014). To represent the concept of wellbeing, this AFWPS issue includes data on individual and household income levels, long working hours (full time) and educational attainment. Monitoring wellbeing indicators and comparing the forestry sector to the broader workforce can be useful in identifying potential issues associated with high staff turnover and the loss of skilled workers.
Forestry sector workers are less likely to earn a higher individual income ($1,250 or more per week) than those in the total national workforce. However, between 2011 and 2016 the proportion of forestry sector workers earning high incomes increased by 12.0 per cent, compared with a 10.4 per cent increase for the total national workforce (Figure 11).
Equivalised total household income is a useful indicator of the economic resources available to a household, allowing for comparison of standards of living between households. In 2016 a smaller proportion of forestry worker households earned below $800 a week compared with the households in the total national workforce. This suggests that forestry worker households were able to cover their living costs more easily than those in the total national workforce. This contrasts with 2011 when forestry worker households earned on average less income than households in the total national workforce. These trends were similar at the regional scale in 2016—except in Northern NSW, Perth and Sydney, where a greater proportion of forestry sector households than total national workforce households earned below $800 per week.
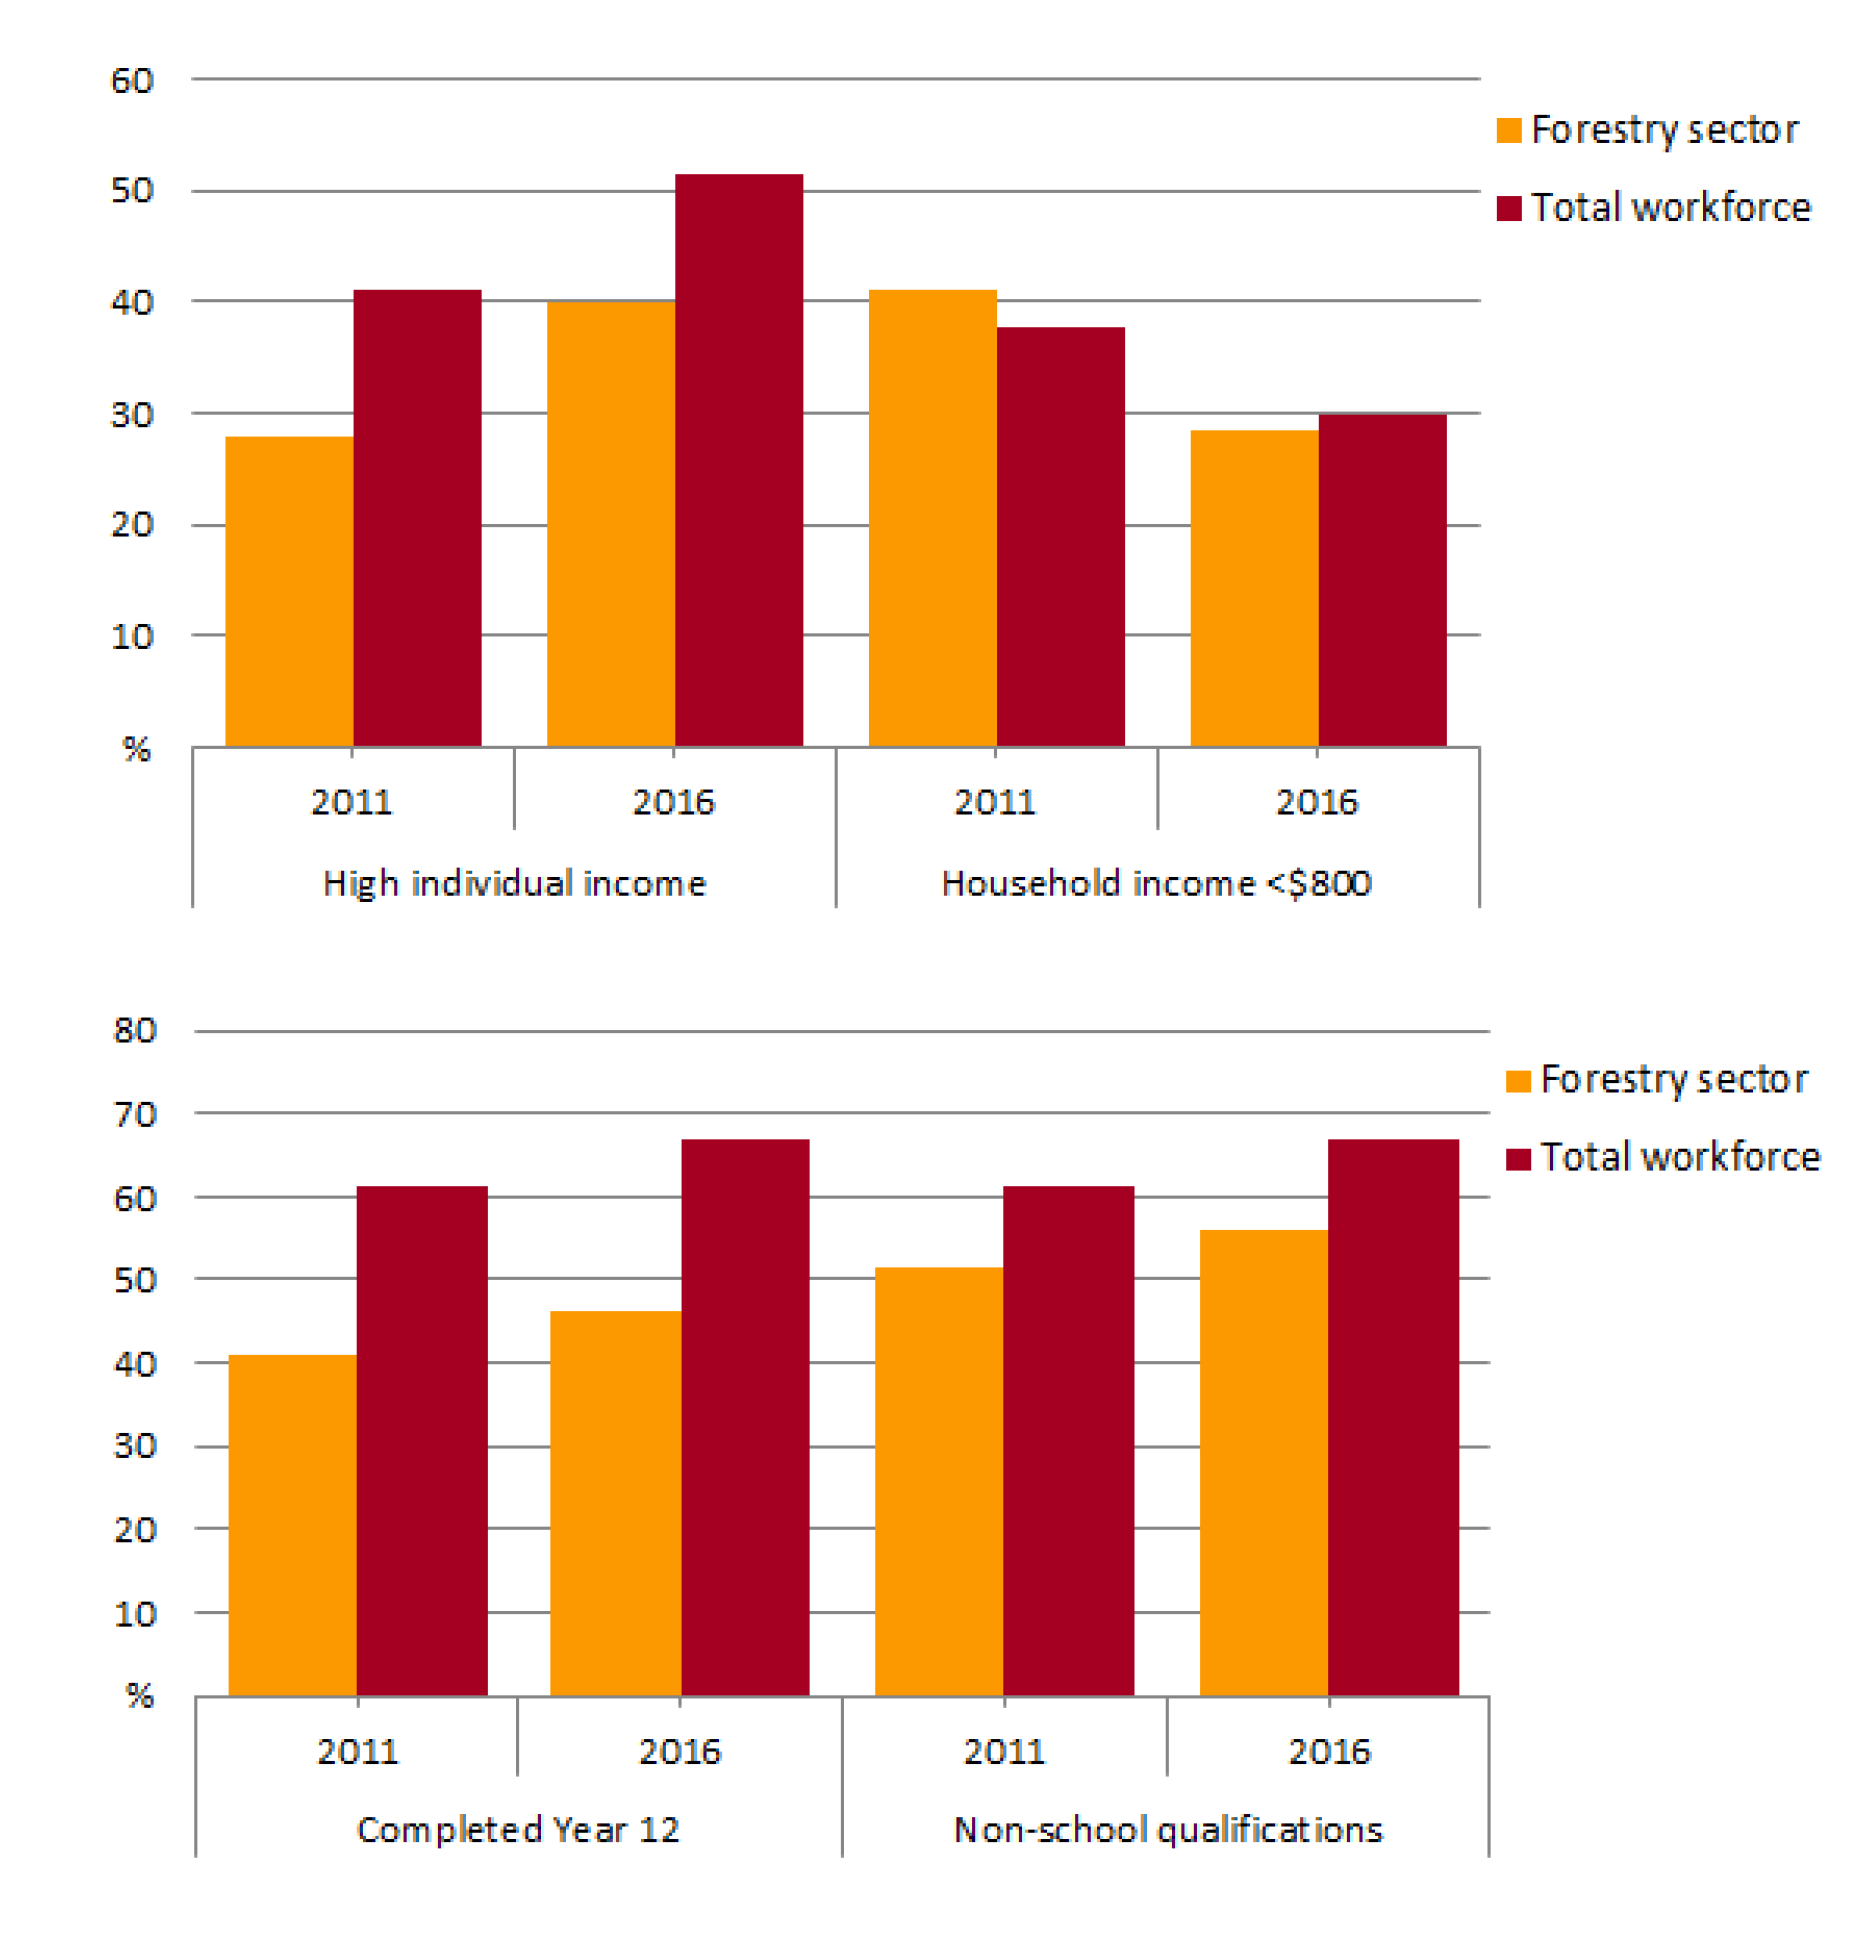
Education attainment is another factor that can influence wellbeing and achievement, and can provide workers with different employment opportunities. In 2016 workers in the forestry workforce were more likely to have completed year 12 and hold non-school qualifications than in 2011. However, the rates of these indicators remained lower than for persons in the total national workforce (Figure 11). In 2016, 56 per cent of forestry sector workers held a non‑school qualification (from certificate level up to postgraduate degree), compared with 67 per cent of persons in the total national workforce. Levels of educational attainment, most particularly year 12 completion, are generally higher in capital cities than in regional areas. This pattern is observed across all industry workforce sectors. Forest sector workers in Darwin and Hobart had the highest rates of non‑school qualifications in 2016.
Workforce diversity
A high level of diversity in an industry or organisation’s workplace acknowledges difference between individuals, can assist to adapt work practices to take account of the individuality of employees and can provide a supportive work environment that fosters innovative ideas and promotes values of respect and inclusion. The concept of workplace diversity can cover, for example, gender, age, language, ethnicity, cultural background, disability and religious belief. Workplace diversity can also refer to differences in socio-economic background, educational level, family responsibilities, working style and life experience.
Tracking workforce diversity gives insights into whether businesses are successfully recruiting workers from all parts of the available labour force, as well as whether the industry provides opportunities for some groups who typically have greater difficulty accessing the workforce. Indicators used in this framework for the forestry sector include age profile of workers and the extent that women, Indigenous people and people with a disability are represented.
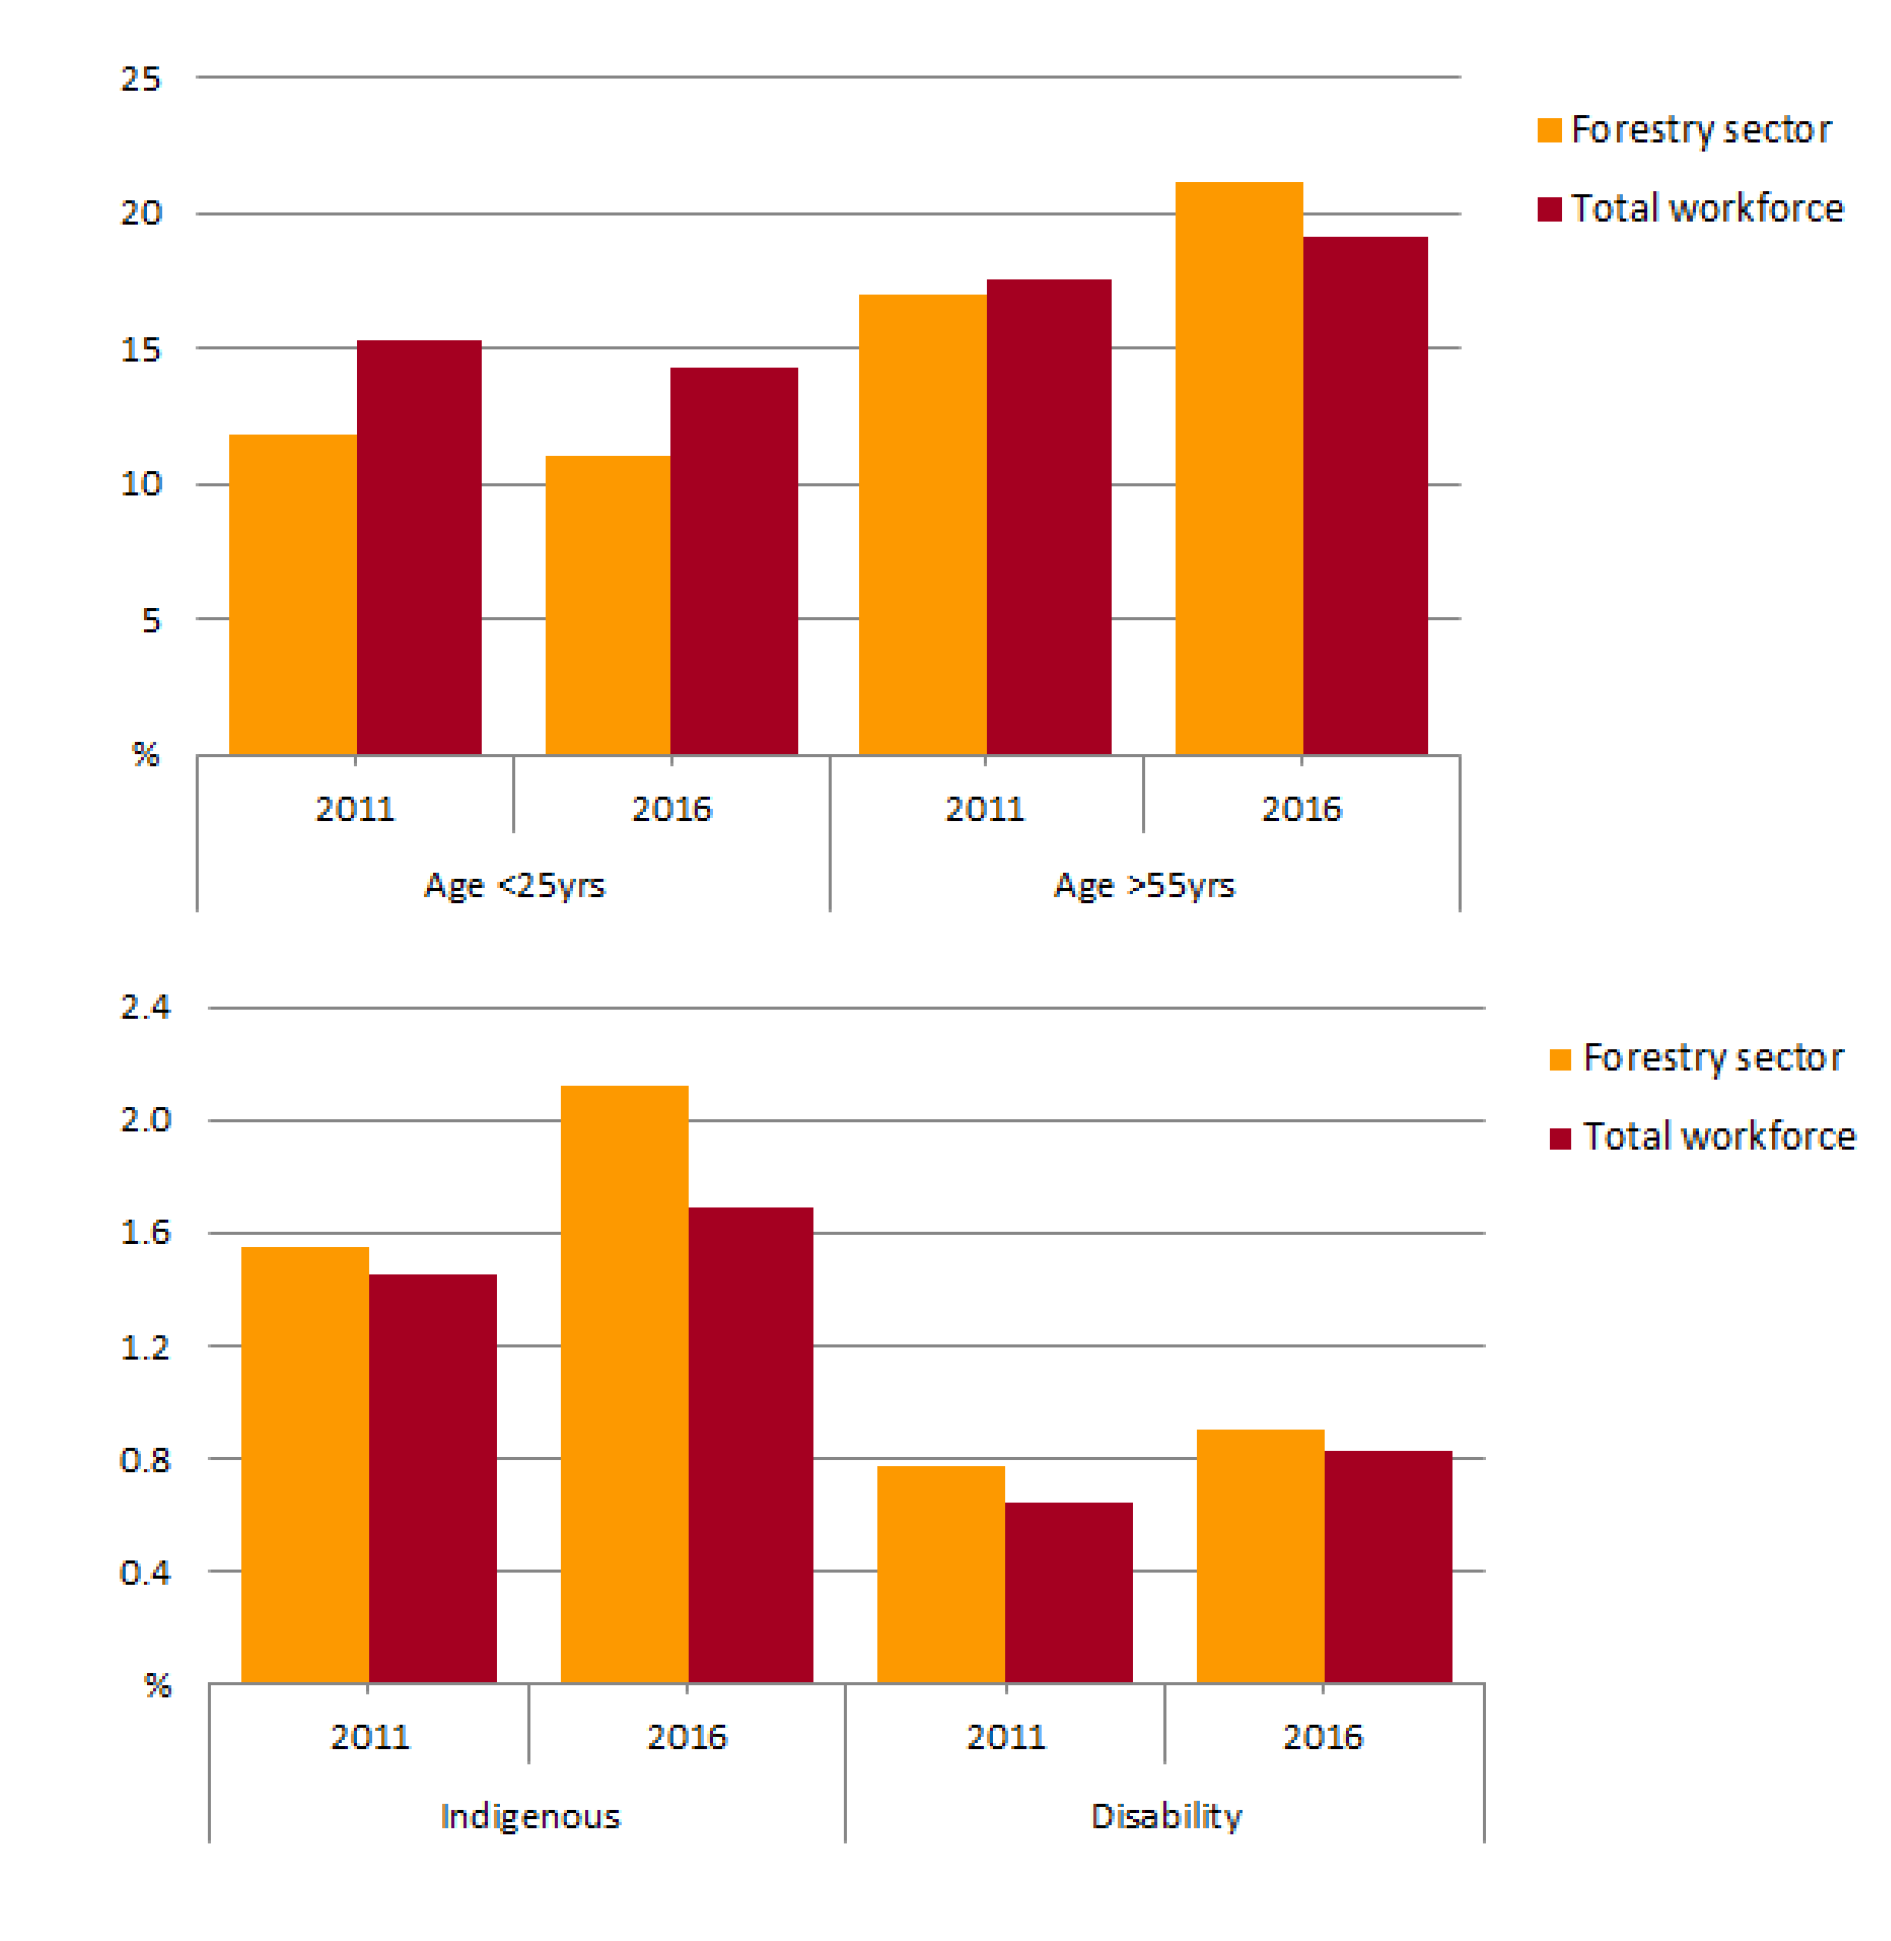
The trend of an ageing workforce continues in the forestry sector compared with the total national workforce (Figure 12). In 2016 the South East Queensland and Northern Australia regions had relatively younger workers, and the Gippsland and Central Highlands and South West Western Australia had relatively older workers. Workforce age profile may help indicate industry attractiveness or highlight potential issues with succession of retiring workers or development needs for younger workers.
Between 2011 and 2016 the proportion of persons who identified as Indigenous (Aboriginal, Torres Strait Islander or both) increased in the forestry sector workforce and in the total national workforce (Figure 12). Nationally, 2.1 per cent of the forestry sector workforce identified as Indigenous in 2016, compared with 1.7 per cent of the total national workforce. This may reflect growing opportunities for Indigenous workers in the forestry sector, including where their cultural knowledge can support forestry operations and management (such as cultural burning and heritage assessments). In 2016, 26 per cent of Indigenous forestry sector workers were employed in the forestry support services subsector, compared with 6 per cent of workers in the total forestry sector (ABS 2016). Large regional differences exist in Indigenous employment in the forestry sector. In 2016 rates of Indigenous employment in Northern Australia (12.5 per cent) and regional Tasmania (5.2 per cent) were well above the national average (2.1 per cent).
Representation of persons with a disability (who stated they need assistance with everyday activities) remains higher in the forestry sector than the total national workforce (Figure 12). In 2016, 0.9 per cent of forestry sector workers had a disability (up from 0.8 per cent in 2011), compared with 0.8 per cent of persons in the total national workforce (up from 0.6 per cent in 2011).
Participation of women in the forestry sector remains lower than in the total Australian workforce and declined slightly between 2011 and 2016, to 18.2 per cent nationally. During the same period, female employees as a percentage of the total national workforce increased to 48 per cent. In 2016 female participation in the forestry sector was relatively higher in larger capital cities and in Northern Australia.
References
ABS 2016, Census of Population and Housing, TableBuilder, Australian Bureau of Statistics.
ABARES 2012, Australian forest and wood products statistics, March and June quarters 2012, Australian Bureau of Agricultural and Resource Economics and Sciences, Canberra, November.
ABARES 2018, Australian forest and wood products statistics, September and December quarters 2017, Australian Bureau of Agricultural and Resource Economics and Sciences, Canberra, May.
Binks, B, Schirmer, J & Kancans, R 2014, Regional socio-economic profiling of the forestry industry—Recommendations report, ABARES report to client prepared for Forest and Wood Products Australia, Canberra, November.
Schirmer, J, Binks, B, Kancans, R & Stenekes, N 2013, Social indicators for Australia’s forest and wood products industries, ABARES, Canberra, November.
Schirmer, J, Mylek, M, Magnusson, A, Yabsley, B & Morison, J 2017, Socio-economic impacts of the forestry industry, Green Triangle, University of Canberra and EconSearch, November.
Schirmer, J, Mylek, M, Magnusson, A, Peel, D & Morison, J 2018, Socio-economic impacts of the forestry industry, Queensland, University of Canberra and EconSearch, May.