
Overview
Australian plantation statistics is published every year. It supports strategic forest industry planning and decision-making by presenting information on total plantation area, new planting and ownership.
The plantation areas are presented by jurisdiction and National Plantation Inventory regions for softwood and hardwood plantation types, and species, based on data collected from private growers and grower representatives and public state and territory agencies.
In this report, 2024–25 data are compared with data from the 2004–05, 2009–10, 2014–15 and 2019–20 spatial plantation reports (5 yearly) and 2023–24 annual plantation update.
A high resolution version of the Australian Plantation statistics 2024-25 - Infographic is available in the download section below.
If you have difficulty accessing this file, contact ABARES.
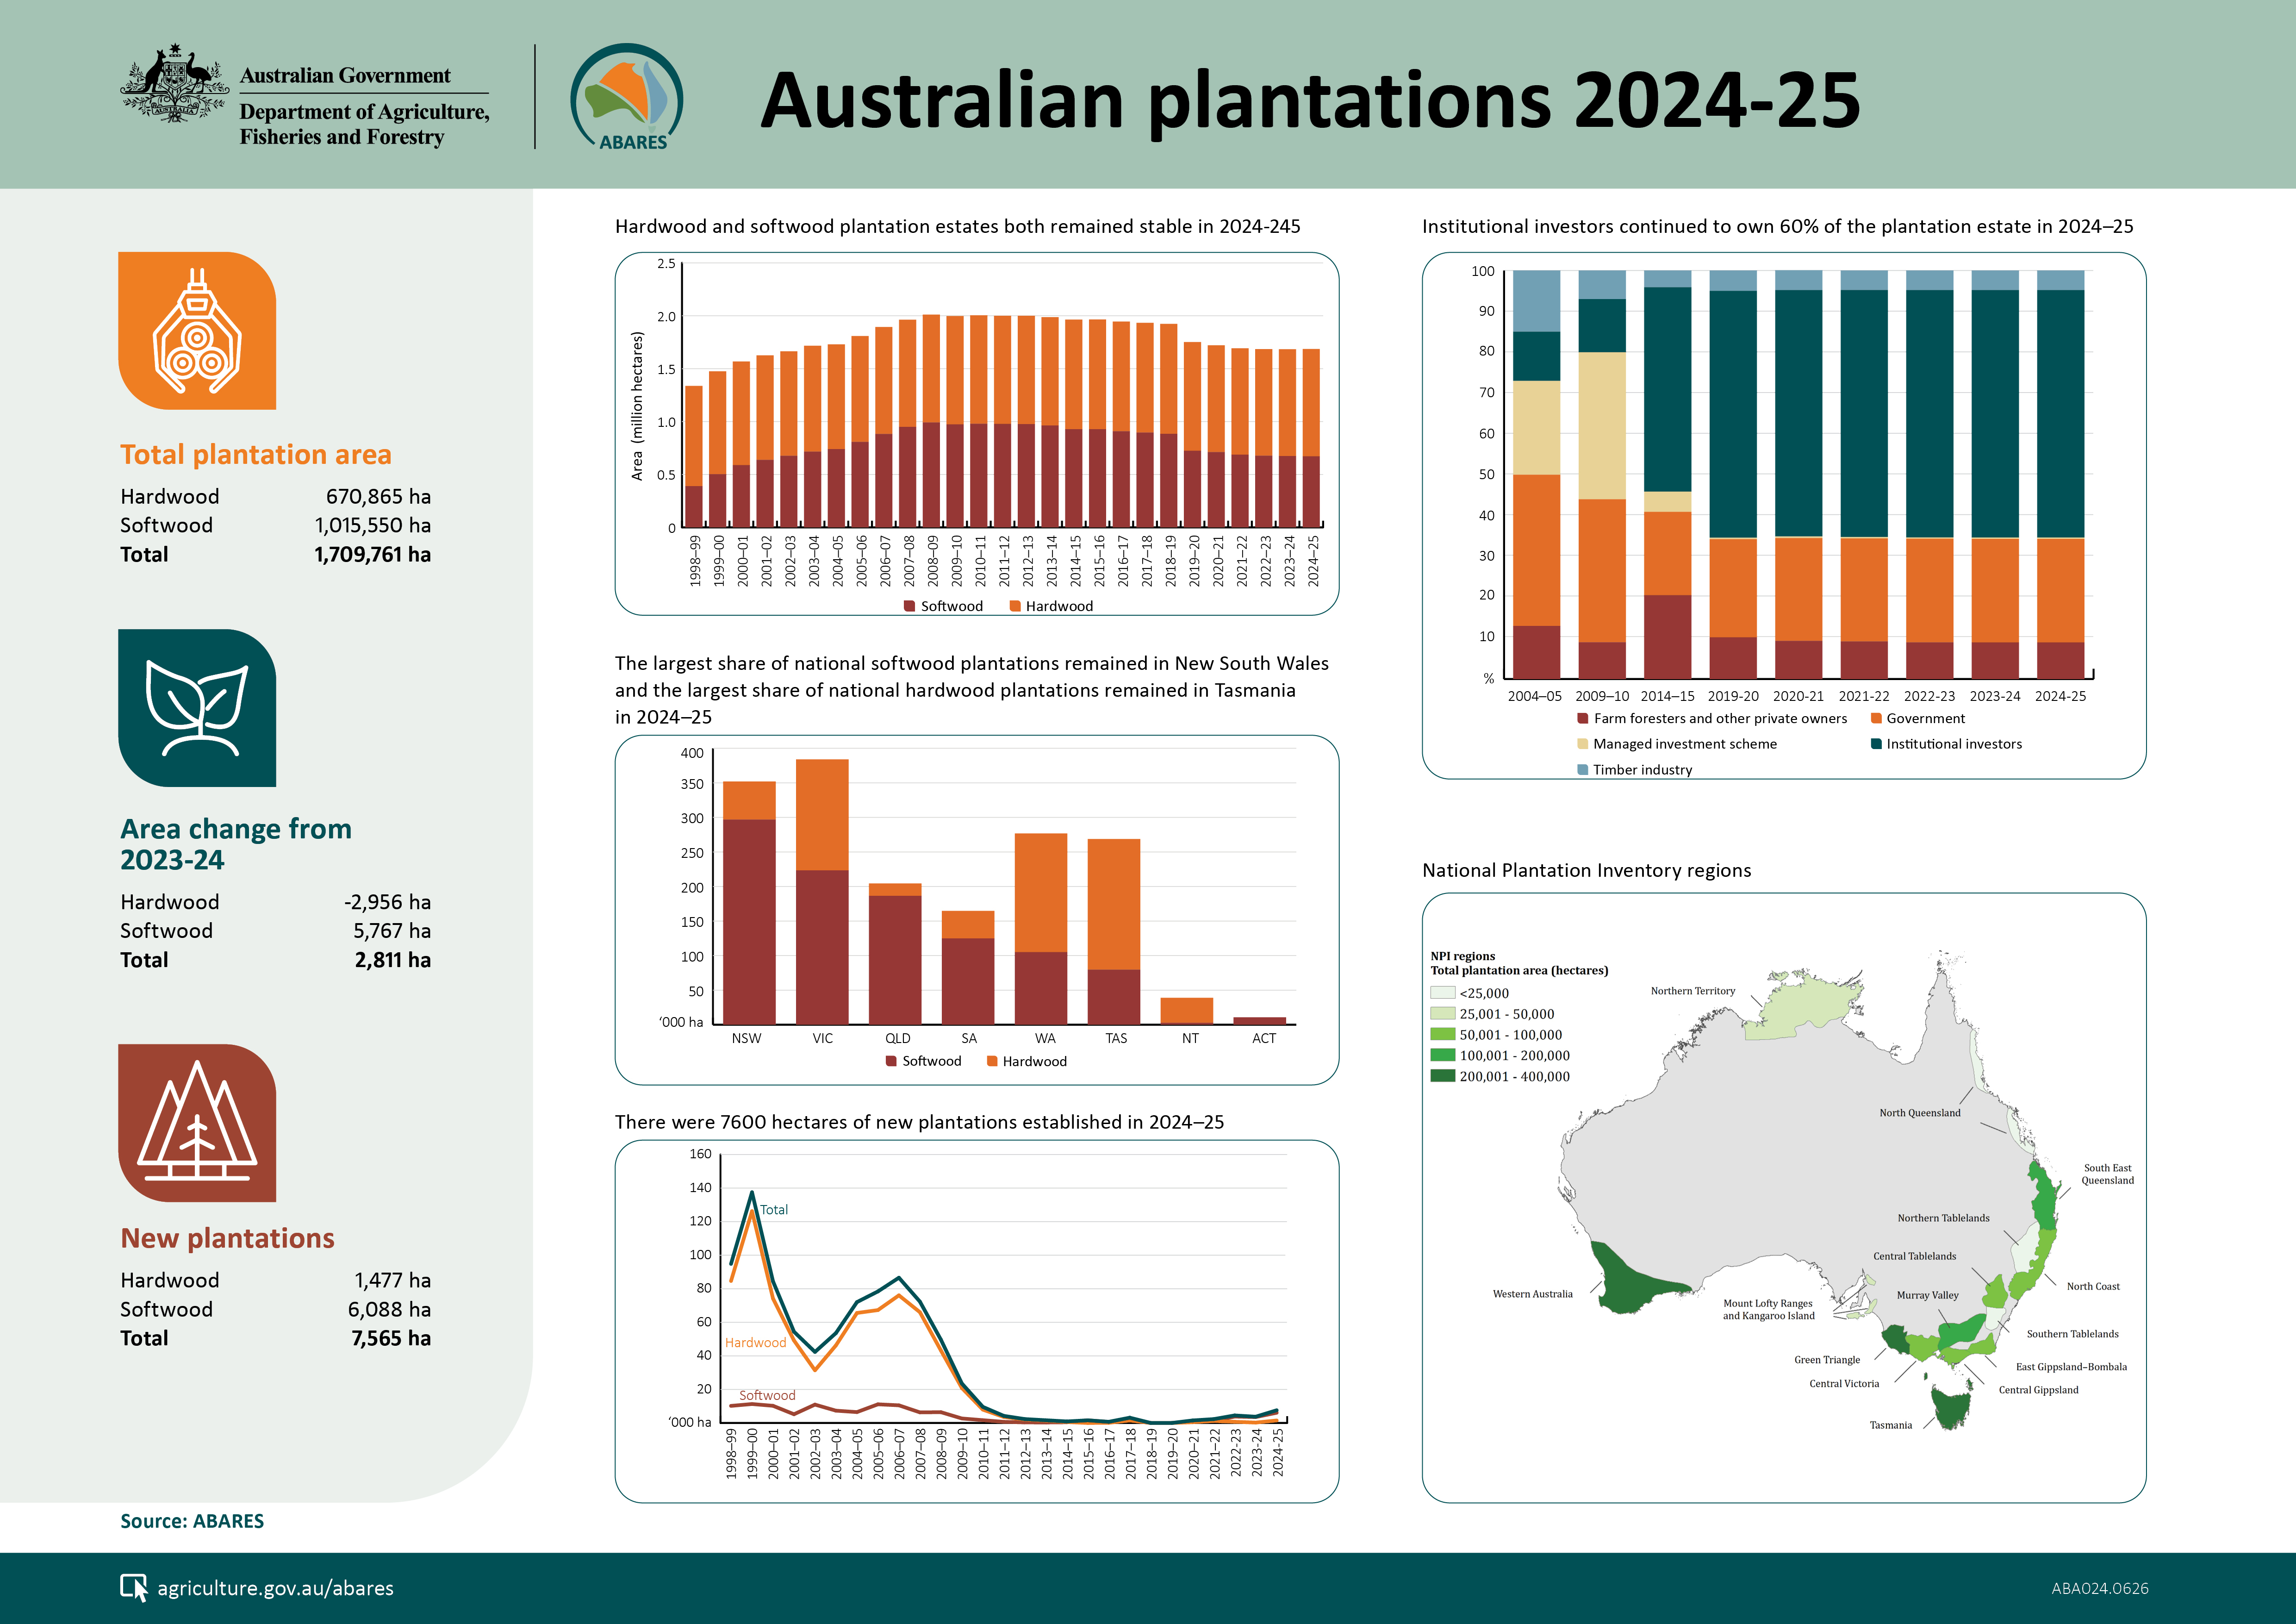
Total plantation area remained steady in 2024–25
| State/Territory | 2004–05 | 2009–10 | 2014–15 | 2019–20 | 2023–24 | 2024–25 | Change |
|---|---|---|---|---|---|---|---|
(’000 ha) | (’000 ha) | (’000 ha) | (’000 ha) | (’000 ha) | (’000 ha) | (%) | |
| New South Wales | 331.6 | 391.3 | 393 | 360.1 | 351.6 | 352.3 | 0.2% |
| Victoria | 384.6 | 430.5 | 423 | 386.6 | 380.7 | 382.1 | 0.4% |
| Queensland | 225.6 | 230.6 | 230.4 | 205.4 | 205.0 | 205.0 | 0.0% |
| South Australia | 167 | 188.3 | 178.8 | 172.3 | 163.5 | 162.9 | –0.4% |
| Western Australia | 377.6 | 413.3 | 383.4 | 309.8 | 289.3 | 290.9 | 0.6% |
| Tasmania | 227.2 | 309.1 | 309.8 | 282.5 | 271.2 | 271.0 | –0.1% |
| Northern Territory | 16.3 | 38.1 | 47.6 | 49.3 | 37.1 | 36.9 | –0.6% |
| Aust. Capital Territory | 9.5 | 7.7 | 7.4 | 8.7 | 8.6 | 8.6 | 0.0% |
| Australia | 1,739.4 | 2,008.9 | 1,973.4 | 1,774.7 | 1,706.9 | 1709.8 | 0.16% |
Note: Note: 2004–05, 2009–10, 2014–15 and 2019–20 are 5 yearly spatial figures, while 2023–24 and 2024–25 figures are based on tabular surveys.
Source: ABARES
New plantation establishment in 2024–25 showed strong uptick in Western Australian softwood and Victorian hardwood
2023–24 | 2024–25 | |||||
|---|---|---|---|---|---|---|
| State/Territory | Softwood | Hardwood | Total | Softwood | Hardwood | Total |
| New South Wales | 1.9 | 0.0 | 1.9 | 0.7 | 0.1 | 0.7 |
| Victoria | 0.0 | 0.0 | 0.0 | 0.2 | 1.4 | 1.6 |
| Queensland | 0.0 | 0.0 | 0.0 | 0.0 | 0.0 | 0.0 |
| South Australia | 0.0 | 0.0 | 0.0 | 0.0 | 0.0 | 0.0 |
| Western Australia | 1.6 | 0.2 | 1.8 | 4.8 | 0.0 | 4.8 |
| Tasmania | 0.0 | 0.0 | 0.0 | 0.4 | 0.0 | 0.4 |
| Northern Territory | 0.0 | 0.0 | 0.0 | 0.0 | 0.0 | 0.0 |
| Aust. Capital Territory | 0.0 | 0.0 | 0.0 | 0.0 | 0.0 | 0.0 |
| Australia | 3.5 | 0.2 | 3.7 | 6.1 | 1.5 | 7.6 |
Source: ABARES
- Australian plantation statistics 2024-25 (PDF 643 KB)
- Australian plantation statistics 2024-25 (DOCX 1.25 MB)
- Australian plantation statistics 2024-25 infographic (PDF 601 KB)
- Supporting data tables (XLSX 118 KB)
- Australia’s plantations Spatial Layer 2020-21 (ZIP 5.9 MB)
If you have difficulty accessing these files, contact ABARES.
- Australian plantation statistics update 2023-24 (PDF 536 KB)
- Australian plantation statistics update 2023-24 (DOCX 1.25 MB)
- Australian Plantation statistics infographic (PDF 597 KB)
- Supporting data tables (XLSX 110 KB)
- Australian plantation statistics update 2022-23 (PDF 594 KB)
- Australian plantation statistics update 2022-23 (DOCX 1.25 MB)
- Australian Plantation statistics infographic (PDF 601 KB)
- Supporting data tables (XLSX 111 KB)
- Australian plantation statistics 2023 update (PDF 523 KB)
- Australian plantation statistics 2023 update (DOCX 1.20 MB)
- Australian Plantation statistics 2023 - Infographic (PDF 692 KB)
- Supporting data tables (XLSX 102 KB)
- Australian plantation statistics 2022 update (PDF 1.47 MB)
- Australian plantation statistics 2022 update (DOCX 2.21 MB)
- Australian Plantation statistics 2022 - infographic (PDF 880 KB)
- Supporting data tables (XLSX 69 KB)
- Australian plantation statistics 2020 update (PDF 1.71 MB)
- Australian plantation statistics 2020 update( DOCX 3.28 MB)
- Australian plantation statistics 2018 update (PDF 3.51 MB)
- Australian plantation statistics 2016 (PDF 23.5 MB)
If you have difficulty accessing these files, contact ABARES.