
2022–23 to 2024–25
Download full report and data
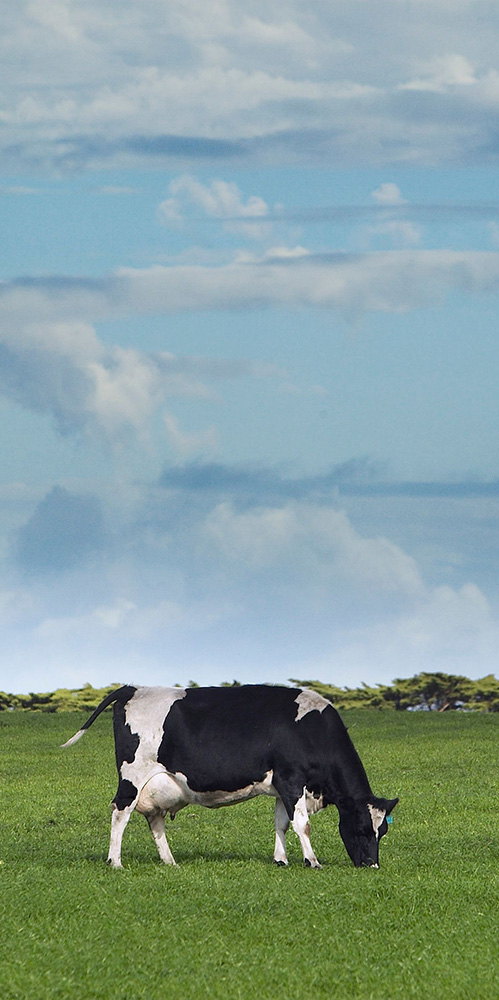
This report provides detailed economic analysis of dairy farm financial performance during the 2023–24 financial year. It examines the impact of seasonal conditions and price changes and provides longer-term context for current farm performance.
Recent farm performance
- The profitability of dairy farming in Australia fell in 2023–24, albeit from record high levels in the previous two years. The average farm cash income of dairy farms was estimated to have been $369,700 per farm in 2023–24.
- Average total cash receipts on dairy farms increased by 2% in 2023–24, with higher receipts from milk sales more than offsetting lower farmgate milk prices. An increase in the average number of cows milked per farm and higher average milk yield per cow also contributed to the increase in cash receipts.
- In 2023–24, average farm business profit fell by 24%, but remained well above the longer-term average.
- The profitability of dairy farming is expected to decline further in 2024–25 due to lower farmgate prices for milk. Average farm cash income is forecast to be around $297,000 per farm in 2024–25.
The Power BI dashboard may not meet accessibility requirements. For information about the content of this dashboard contact ABARES.
p Preliminary estimate. y Provisional estimate. a Excluding capital appreciation. na Not available. All values are expressed in 2024–25 dollars (see methodology).
Previous reports
Previous versions of this and related reports.
Farm surveys definitions and methods
Further information about our survey definitions and methods.
Farm data portal
The Farm Data Portal is an interactive tool containing all data from ABARES surveys of broadacre and dairy farms, and outputs from those surveys, all in the one location.