
Authors: Dale Ashton and Jay Gomboso
The Murray–Darling Basin accounts for around 80 per cent of Australia’s total irrigated grape production (MDBA 2016). More than 60 per cent of Australia’s total grapevine area is in the Basin, and grapes contributed an estimated 11 per cent of the total gross value of irrigated agricultural production (GVIAP) in the Basin in 2014–15 (ABS 2016, 2017).
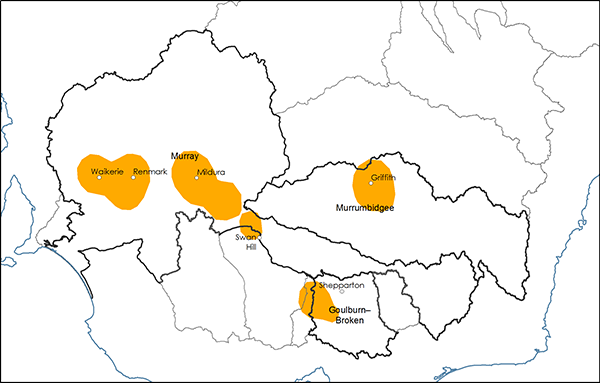
Grape growing occurs in many areas in the Murray–Darling Basin but production is concentrated in southern Basin areas along the Murray River in New South Wales, Victoria and South Australia and in the Murrumbidgee region of New South Wales (Map 1). Around 90 per cent of grapes grown in the Basin are used for making wine but dried and table grapes are important crops on some farms.
[expand all]
Grape production in the Murray–Darling Basin
Griffith, Mildura and Loxton–Waikerie are important grape-growing centres in the region. Grape production, wine making and wine tourism generate significant income and employment opportunities in regional economies throughout the Basin (Department of Agriculture 2015).
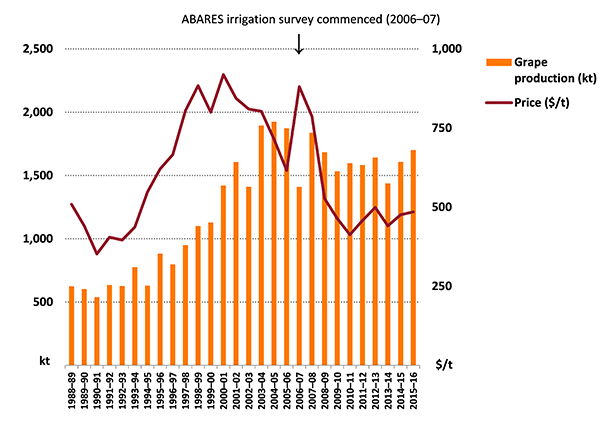
Wine grape production in Australia increased rapidly between 1992–93 and 2004–05 (Figure 1) primarily driven by strong demand for Australian wine in export markets. Production peaked in 2004–05 at 1.9 million tonnes (Caboche et al. 2013). However, since 2001 wine grape prices have been generally trending downwards as a result of increased competition in export markets and reduced demand for Australian wine (AGWA 2015; Caboche et al. 2013).
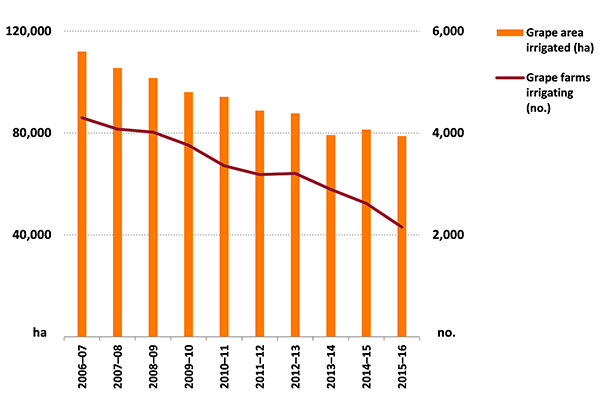
Between 2006–07 and 2015–16 the number of irrigated grape farm businesses in the Basin declined by around 50 per cent (Figure 2). Many farmers that exited the industry were those with less than 20 hectares of grapevines. Total irrigated grapevine area fell by around 30 per cent (ABS 2017), resulting in an increase in the average grapevine area per farm.
ABARES first surveyed irrigation farms in the Murray–Darling Basin in 2006–07, a year of relatively high wine grape prices and low grape production (Figure 1). Australian grape production had fallen by almost a quarter from the previous year, which was attributed to a combination of drought, frosts and bushfire smoke taint (WFA 2007). It was also the sixth consecutive year of extreme drought, particularly in the southern Basin (MDBC 2007). In 2006–07 total inflows to the Murray system fell to a record low and subsequently water allocations also fell to record lows (MDBC 2007).
Wine grape prices fell each year from 2006–07 to 2010–11 then fluctuated at only moderately improved levels. Drought and associated low water allocations continued until seasonal conditions generally improved across the Basin in 2009–10. Seasonal conditions remained mostly favourable until 2012–13, when a return to drier conditions resulted in most of the Basin receiving below average rainfall. A moderate improvement in seasonal conditions in 2013–14 was followed by drier conditions again in 2014–15 and 2015–16 in the southern Basin.
Australian wine producing areas are often categorised as either warm or cool climate zones. Wine Australia (2015) use geographical indications (GI) to classify wine zones—GIs identify wines as originating in a region or locality. Most wine grape production in the Basin occurs in warm zones, with the three largest zones (Wine Australia’s GI zones of Big Rivers, North West Victoria and Lower Murray) accounting for 67 per cent of Australia’s total wine grape production in 2011–12 (Caboche et al. 2013).
The ABARES survey regions for grape growers (Murrumbidgee, Murray and Goulburn–Broken) mostly fall within the GI zones of Big Rivers, North West Victoria and Lower Murray. Grape production in these regions relies heavily on availability of irrigation water.
Crop and livestock enterprise mix
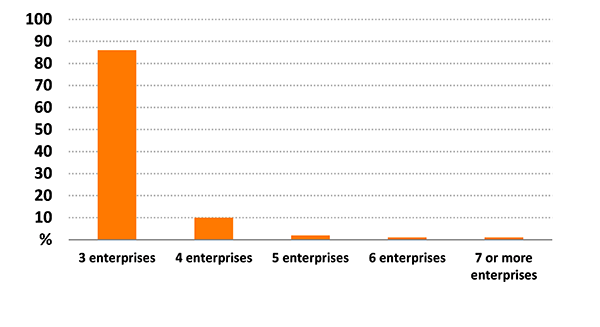
One way irrigators manage changes in their farm operating environment is by adjusting the mix (or diversity) of agricultural enterprises each year. Such changes are most common on farms that have annual crops such as rice or cotton but less common on grape-growing farms.
Grape-growing farms are the least diversified of all irrigated industries covered by the ABARES irrigation survey. In 2014–15 an estimated 86 per cent of grape-growing farms had 3 different crops (most commonly wine grapes, citrus and another horticulture crop) (Figure 3).
percent of farms
Grape growers’ intentions
As part of the ABARES survey of irrigation farms in the Murray–Darling Basin irrigators were asked to describe what they expected to be doing in 3 years. These results indicate future intentions and can also be interpreted as an indicator of sentiment or industry confidence at the time of the survey.
At the time of the survey in early 2016, an estimated 64 per cent of grape growers indicated that their farming operations would not change in the next 3 years. This proportion increased over the period of the survey—in 2006–07 51 per cent of grape growers indicated no intention to change their farming operations.
Around 30 per cent of grape growers indicated an intention to sell their farm over the next 3 years and a further 5 per cent intended to retire. The remaining farms indicated a range of intentions including changing farm enterprises and spending more time generating non-agricultural income.
Over the period 2006–07 to 2015–16 the grape growers that were intending to retire or sell their farm operated smaller farms than the average with poorer farm financial performance. Those intending no change to their farming operations operated farms that were larger than the average (Table 1).
Note: Average per farm over the period 2006–07 to 2015–16. The results for ‘all other farms’ includes farms not included in the other two groups shown in the table.
Source: ABARES Murray–Darling Basin Irrigation Survey
Farm performance and investment
Farm performance
Farm financial performance is a key driver of change in the grape-growing industry. Two measures of farm financial performance used in this report are farm cash income and rate of return.
Farm cash income is defined as total cash receipts minus total cash costs. It is a short-term measure of the cash surplus available to a farm business to reinvest or draw family income after costs have been taken into account.
Total cash receipts are the cash revenues received by a grape-growing farm business. In most cases, the largest receipt items are sales of grapes and other horticultural crops. Other (usually minor) items include allocation water sales, contracting and government assistance payments.
Total cash costs are payments made for materials and services and include administration costs, crop-related expenses, interest and permanent and casual labour. Capital and household expenditures are not included in total cash costs.
Average farm cash income for grape-growing farms over the period 2006–07 to 2014–15 was around $69,000 per farm (in 2015–16 dollars) (Figure 4). In 2015–16 average farm cash income was estimated to have been around $77,000 per farm.
average per farm
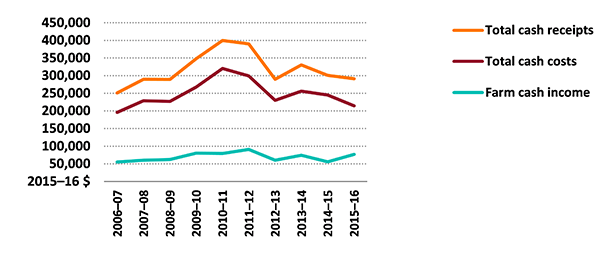
Source: ABARES Murray–Darling Basin Irrigation Survey
Components of receipts
When expressed as an average of all survey years, grape growers received 93 per cent of average total cash receipts from perennial horticulture crops, with most (around 70 per cent) generated from wine grapes (Figure 5). Other receipt items such as off-farm contracting and temporary water sales made up the remaining contribution to average total cash receipts.
average per farm
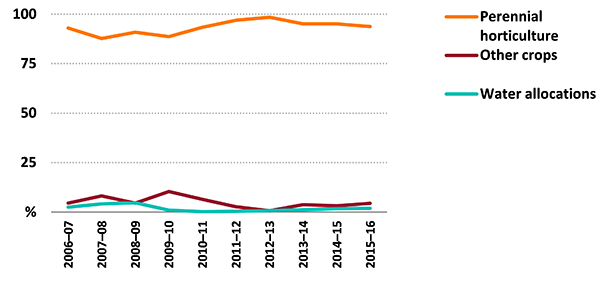
Source: ABARES Murray–Darling Basin Irrigation Survey
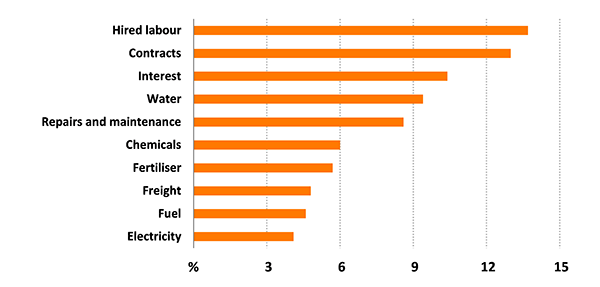
Components of costs
Total cash costs for hired labour and contracts averaged 13 per cent each over the survey period (Figure 6). Interest, repairs and maintenance and water costs (including bulk water charges and temporary water purchases) together contributed a further 28 per cent to total average cash costs over the survey period.
average per farm
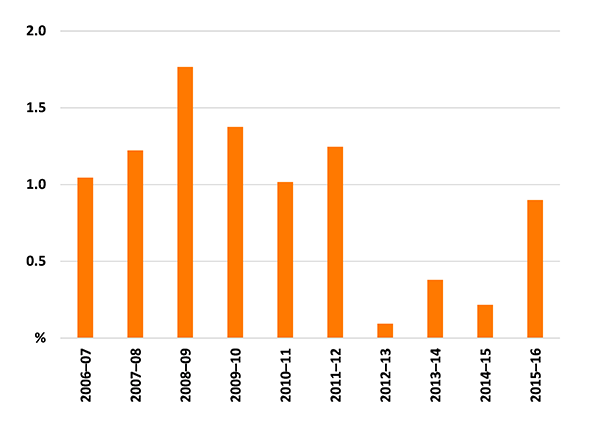
Rate of return
Figure 7 shows average rate of return to capital (excluding capital appreciation) for grape growers. Rate of return is a measure of the annual profit generated by a business expressed as a percentage of the value of the capital used to generate that profit. Rate of return for grape-growing farms can be compared with other investments or potential uses of farm capital (for example, other farm types, superannuation schemes or bank deposits) because it is expressed as a ratio. Average rates of return to capital for grape growers in the Basin have been modest since 2006–07. The average rate of return for all survey years was 0.9 per cent. In 2015–16 the average rate of return for grape-growing farms was also estimated to have been 0.9 per cent.
average per farm
Source: ABARES Murray–Darling Basin Irrigation Survey
Farm investment
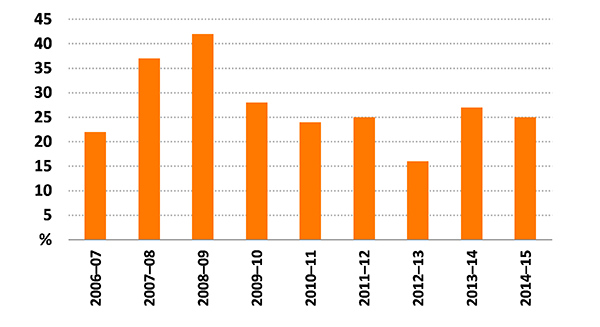
Around 27 per cent of grape growers each year, on average, made new capital investments over the period 2006–07 to 2014–15, ranging from a low of 16 per cent in 2012–13 to a high of 42 per cent in 2008–09 (Figure 8).
In 2014–15 average total capital additions was around $120,000 per farm for those grape growers making additions. Additions to plant and equipment (including irrigation infrastructure) accounted for around 39 per cent of capital additions in 2014–15, land accounted for 56 per cent and buildings and structures accounted for the remaining 5 per cent.
average per farm
Water use and irrigation technology
Grape growers in the Murray–Darling Basin usually rely on irrigation water to supplement rainfall. The average volume of water used by grape growers in an irrigation season depends on allocations, price of water on the temporary market and seasonal conditions (that is, evapotranspiration and rainfall).
Prevailing seasonal conditions and market prices over summer can significantly influence grape growers’ total water use because the November to January period is critical for grape production in the Basin. Rainfall was extremely low from 2006–07 to 2009–10 and resulted in low inflows to water storages and, consequently, lower water allocations. As the drought worsened, many grape growers purchased temporary allocation water to maintain production or keep grapevines alive.
From 2006–07 to 2014–15 the average volume of irrigation water used by grape growers mostly increased while average water application rates per hectare followed a relatively flat trend (Figure 9).
average per farm
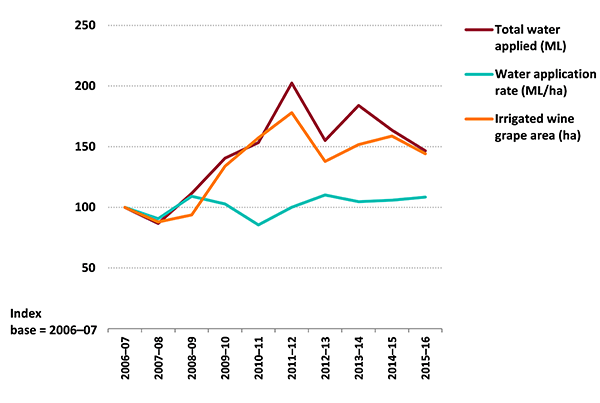
Source: ABARES Murray–Darling Basin Irrigation Survey
Drip/trickle systems were the most common method of applying irrigation water to grapevines (Figure 10). The proportion of wine grape farms using drip/trickle systems mostly trended upwards over the survey period.
proportion of farms
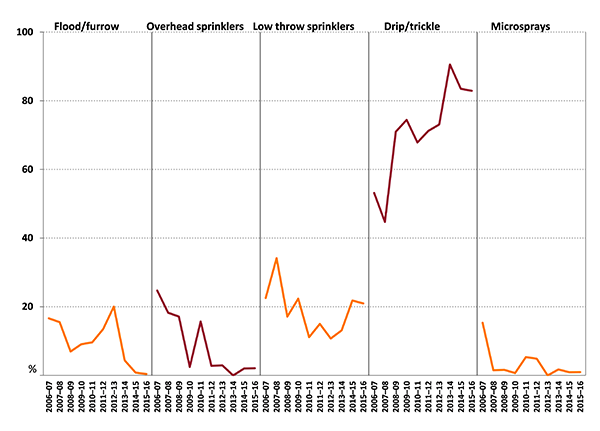
Source: ABARES Murray–Darling Basin Irrigation Survey
Water trading
The proportion of grape growers trading water allocations varied from year to year from 2006–07 to 2014–15 (Figure 11). In 2007–08 and 2008–09—years severely affected by drought—around 60 per cent of grape growers were net buyers of water allocations. During the wetter years from 2010–11 to 2012–13 the majority of grape growers did not trade allocations. In 2013–14 the proportion of grape growers that were net sellers of water allocations increased substantially.
per cent of farms
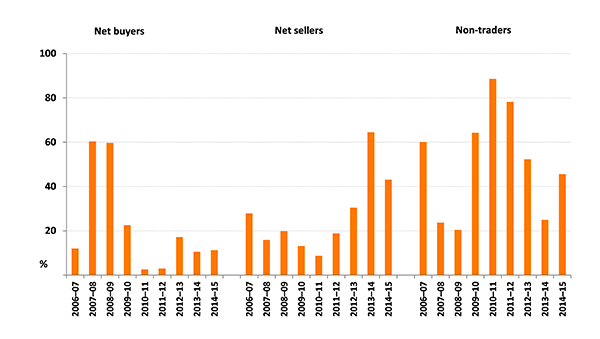
Source: ABARES Murray–Darling Basin Irrigation Survey
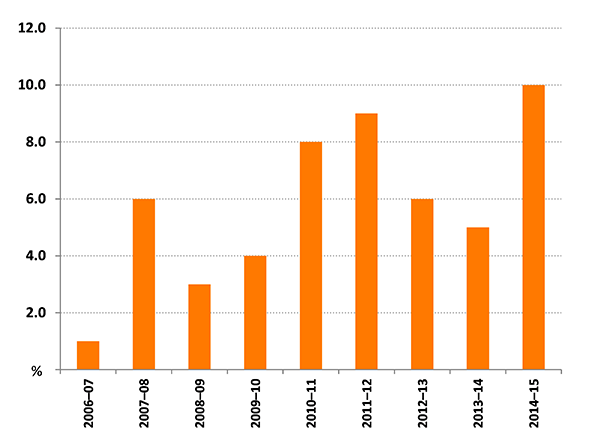
The market for permanent water access entitlements has also provided irrigators with a tool for managing their farm businesses. Around 5 per cent of grape growers on average sold part or all of their permanent water access entitlements each year. This ranged from a low of 1 per cent in 2006–07 to a high of 10 per cent in 2014–15 (Figure 12).
References
ABARES 2016, Agricultural commodities: March quarter 2016, Australian Bureau of Agricultural and Resource Economics and Sciences, Canberra, March.
ABS 2016, Gross value of irrigated agricultural production, 2014–15, cat. no. 4610.0.55.008, Australian Bureau of Statistics, Canberra, September.
ABS 2017, Water use on Australian farms 2015–16, cat. no. 4618.0, Australian Bureau of Statistics, Canberra, July.
AGWA 2015, Australian grape and wine industry, submission to the Senate Rural and Regional Affairs and Transport References Committee, Australian Grape and Wine Authority, May.
Caboche, T, Shafron, W, Gunning-Trant, C, Lubulwa, M & Martin, P 2013, Australian wine grapes: financial and business performance of wine grape growers 2011–12, ABARES research report 13.14, Australian Bureau of Agricultural and Resource Economics and Sciences, Canberra, December.
Department of Agriculture 2015, The Australian grape and wine industry, submission to the Senate Rural and Regional Affairs and Transport References Committee, June.
MDBA 2016, The Murray–Darling Basin: at a glance, Murray–Darling Basin Authority.
MDBC 2007, Murray–Darling Basin Commission annual report 2006–07, publication no. 27/07, Murray–Darling Basin Commission, Canberra.
WFA 2007, 2007 WFA vintage report, Winemakers’ Federation of Australia, Adelaide, June.
Wine Australia 2015, Register of protected GIs and other terms, Australian Grape and Wine Authority, Adelaide, accessed September 2016.
Data and other resources
| Document | Pages | File size |
|---|---|---|
Grape farms in the Murray-Darling Basin – Figures 2017 XLSX  |
222 KB |
If you have difficulty accessing this file, visit web accessibility for assistance.
Previous reports
Wine grape farms in the Murray-Darling Basin, 2012-13 to 2014-15