The Australian vegetable–growing sector is an important source of food. It supplies most of the fresh vegetables consumed in Australia and provides inputs for the processed vegetable products consumed in Australia or exported.
Vegetables are an important part of healthy eating and provide a source of many nutrients and fibre. In 2014–15 the Australian Institute of Health and Welfare (AIHW 2018) estimated only 7% of adults and 5% of children ate sufficient serves of vegetables. The proportion of people with adequate vegetable consumption has decreased since 2004–05, despite the known benefits of vegetables.
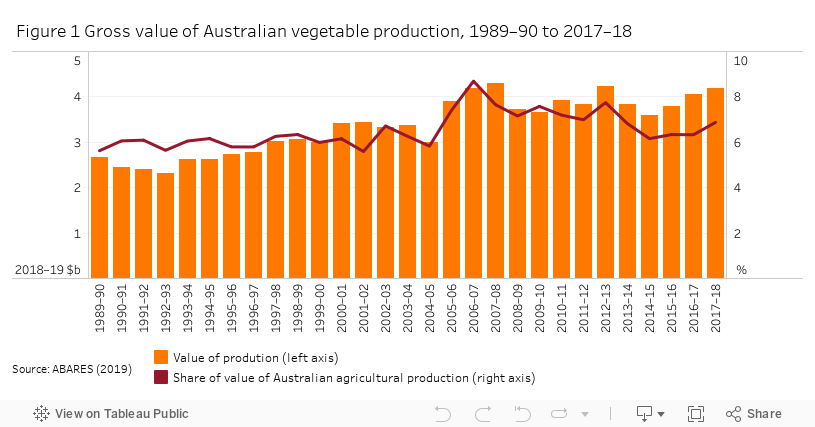
Around 4% of all Australian farms grew vegetables for human consumption in 2017–18 (ABS 2019a). Vegetable production was the sixth-highest value agricultural industry in Australia, accounting for around 7% of the gross value of agricultural production in 2017–18.
The gross value of vegetable production increased by 5% in 2017–18 to $4.1 billion, mainly driven by increases in tomatoes, potatoes and mushrooms (Figure 1). Although most production is for domestic markets, vegetable exports contributed about 1% ($385 million) of Australia’s agricultural export income in 2017–18 (ABARES 2019).
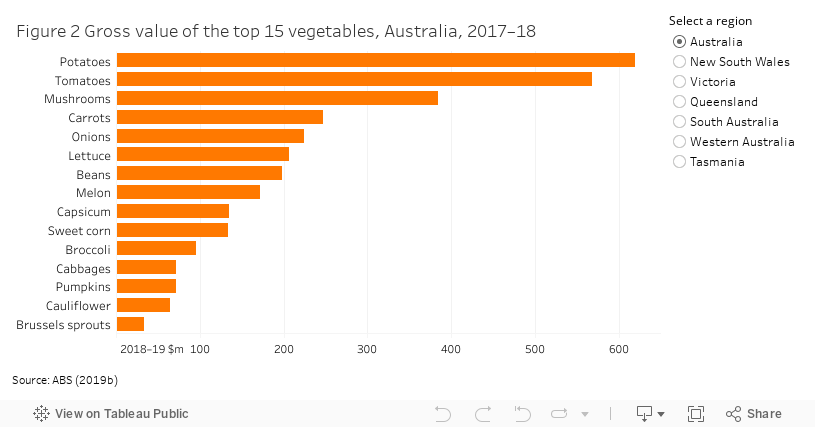
Australian vegetable-growers produce a range of vegetable crops. More than 35 individual commodities contributed to total industry production. Potatoes had the highest gross value of production, contributing $619 million (Figure 2) or 15% of the total value of vegetables, followed by tomatoes ($547 million), mushrooms ($384 million), carrots ($247 million) and onions ($224 million).
The results below are for farms included in the Australian vegetable-growing industry survey conducted annually by ABARES since 2007.
Physical characteristics
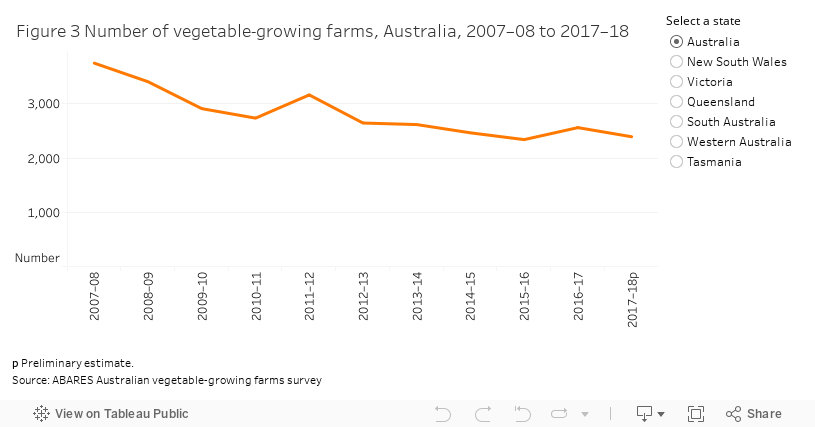
- From 2007–08 to 2017–18, the total number of Australian vegetable-growing farms fell by 36 per cent. Most of the decline was in Queensland and Victoria, but numbers in all states declined over the period.
- In 2017–18, small vegetable-growing farms (less than 5 hectares planted to vegetables) accounted for 12% of the gross value of vegetable production and large vegetable-growing farms (more than 70 hectares planted to vegetables) accounted for 59%.
Detailed physical characteristics
In 2017–18, an estimated 2,395 farms were classified as vegetable-growing farm businesses in Australia. Around 25% of these farms were in Queensland, 24% in New South Wales, 19% in Victoria, 14% in South Australia, 10% in Tasmania and 8% in Western Australia. The total number of farms growing vegetables tends to vary from year to year, partly because opportunistic growers—mostly small farms or larger farms with small areas of vegetable crops—participate when prices and/or seasonal conditions are suitable.
From 2007–08 to 2017–18, the total number of Australian vegetable-growing farms fell by 36%. More than half of this decline was in Queensland and Victoria, but numbers in all states declined over the period (Figure 3).
Vegetable growing farms vary widely in scale and intensity. Around 14% of farms plant large areas of vegetable crops of 70 hectares or more (Table 1). In 2017–18, these large vegetable-growing farms accounted for 67% of total vegetable production. At the other end of the scale, an estimated 31% of vegetable-growing farms planted less than 5 hectares. These small farms only accounted for 2% of production in 2017–18, but some of these farms produce intensive, high value crops. In 2017–18, small farms accounted for 12% of the gross value of vegetable production and large farms accounted for 59%.
a average per farm.
Note: Based on preliminary estimates.
Source: ABARES Australian vegetable-growing farms survey
Crop area
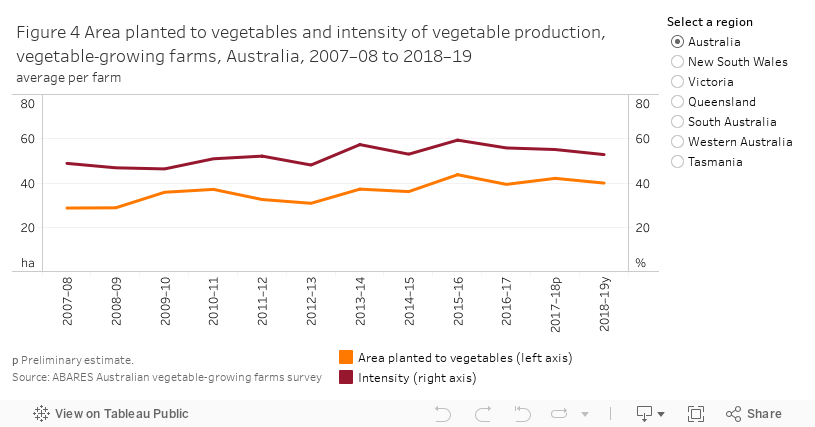
From 2007–08 to 2018–19, the average area planted to vegetables per farm increased by around 39% (Figure 4). This was largely a result of increases in average farm size because of fewer small farms, but a number of farms also increased the scale of their production.
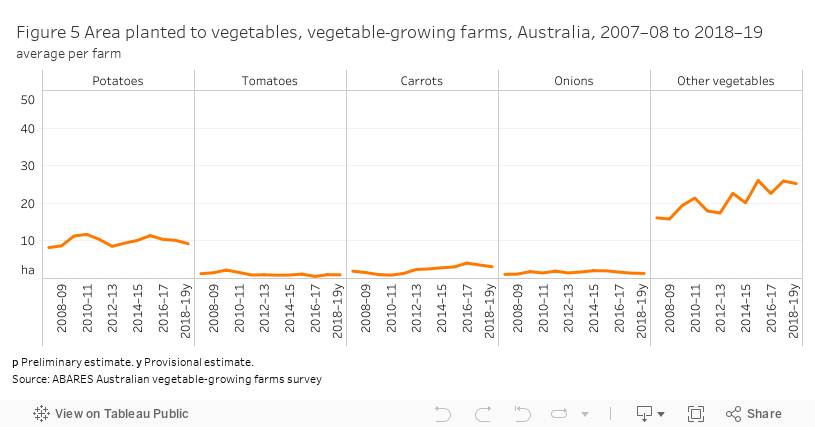
The intensity of vegetable production (area planted to vegetables as a proportion of total area planted to crops) increased slightly from 2007–08 to 2018–19. This was largely a result of increased plantings of a range of newer vegetable crops such as Asian greens and other specialty vegetables instead of other non-vegetable crops (Figure 5).
Vegetable-growing environment
In 2017–18, an estimated 84% of Australian vegetable-growing farms had exclusively outdoor vegetable operations (Table 2). Some farms used hydroponics (10%) or under-cover systems such as glass or shade cloth (15%). Under-cover systems often generate higher yields for a range of vegetable crops, giving farmers more control over output quality and ensuring a more reliable supply. However, farms using these systems require higher receipts to cover the increased input costs.
Note: Based on preliminary estimates. Percentages will not equal 100 because farms can be in multiple categories.
Source: ABARES Australian vegetable-growing farms survey
Physical characteristics by state
New South Wales had an estimated 580 vegetable-growing farms in 2017–18 (Figure 3). Most farms were in Greater Sydney, the Murrumbidgee Irrigation Area and the Far North Coast. The highest value vegetables were mushrooms, potatoes, tomatoes and melons (ABS 2019). New South Wales had the smallest average area operated (108 hectares) and area of vegetables cropped (22 hectares). This is mainly because of the relatively high proportion of farms in the Greater Sydney region which are typically small ‘market garden’ type growers.
Victoria had an estimated 446 vegetable-growing farms in 2017–18 (Figure 3). Most farms were located around Greater Melbourne, Gippsland and the irrigated regions along the Murray River. The highest value vegetables were tomatoes, mushrooms, potatoes and lettuce (ABS 2019). Victorian vegetable-growing farms had the largest average area of vegetables cropped (63 hectares), with many large farms being located in the north of the state.
Queensland had an estimated 589 vegetable-growing farms in 2017–18 (Figure 3). Most farms were in the Darling Downs, Bundaberg, Bowen and the Burdekin delta. The highest value vegetables were tomatoes, beans, sweet corn and lettuce (ABS 2019).
South Australia had an estimated 344 vegetable-growing farms in 2017–18 (Figure 3). Most farms were in the Mallee, Riverland and Adelaide Plains. The highest value vegetables were potatoes, onions, tomatoes and carrots (ABS 2019).
Western Australia had an estimated 193 vegetable-growing farms in 2017–18 (Figure 3). Most farms were located near Perth, Busselton and Pemberton with some further north near Geraldton and Carnarvon. The highest value vegetables were carrots, potatoes, onions and melons (ABS 2019).
Tasmania had an estimated 243 vegetable-growing farms in 2017–18 (Figure 3). Most farms were located in the north of the state, along the coastal fringe, and the northern midlands. The highest value vegetables were potatoes, onions and carrots (ABS 2019).
Farm financial performance
- In 2018–19, average farm cash income of Australian vegetable-growing farms remained steady at an estimated $253,000 per farm. Average farm cash income is estimated to have declined or remained unchanged in all states except New South Wales and Tasmania.
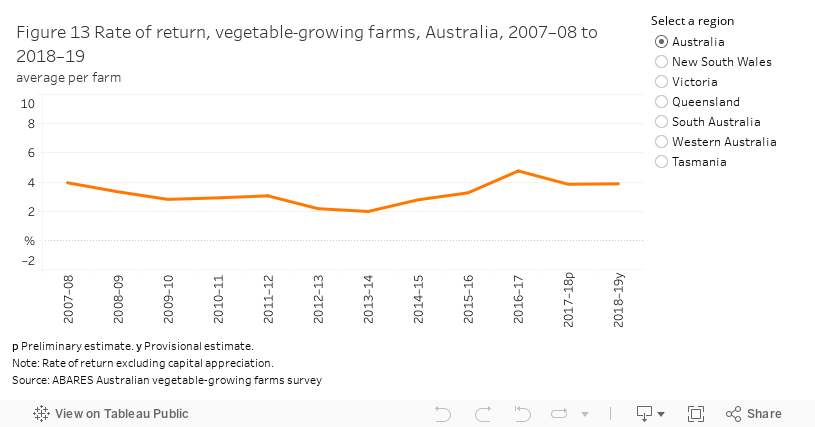
- The average rate of return (excluding capital appreciation) of Australian vegetable-growing farms is estimated to have remained steady at 3.9 per cent in 2018–19.
Detailed farm financial performance
Seasonal conditions
The average financial performance of farms in the vegetable-growing industry is complicated by the diverse nature of farms across the industry. In 2017–18 and 2018–19, varying seasonal conditions also had considerable influence on the financial performance of vegetable-growing farms.
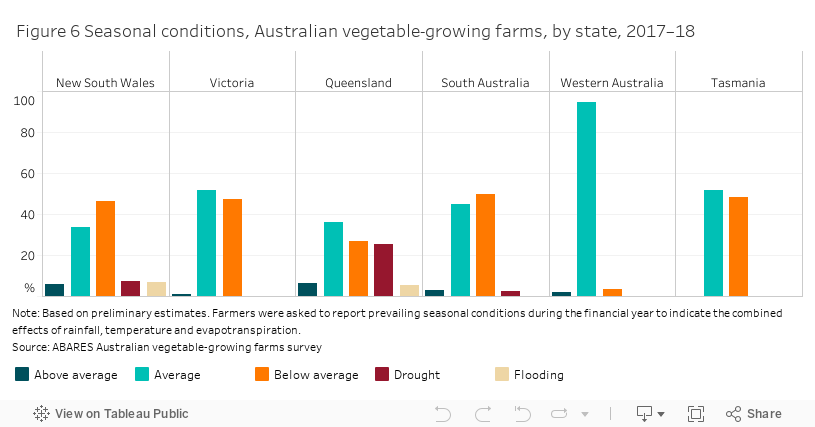
In 2017–18, rainfall was well below average across most vegetable growing regions. An estimated 26% of vegetable growers in Queensland reported drought conditions (Figure 6). A significant proportion of vegetable growers in South Australia (50%), Tasmania (48%), Victoria (48%) and New South Wales (47%) reported below average seasonal conditions. Vegetable growers in the Far North Coast region of New South Wales reported flooding for 2017–18. Most vegetable growers in Western Australia reported average seasonal conditions in 2017–18.
In 2018–19, rainfall remained well below average in all regions except around Bowen, Townsville and Far North Queensland where significant rainfall events occurred in late 2018 and early 2019.
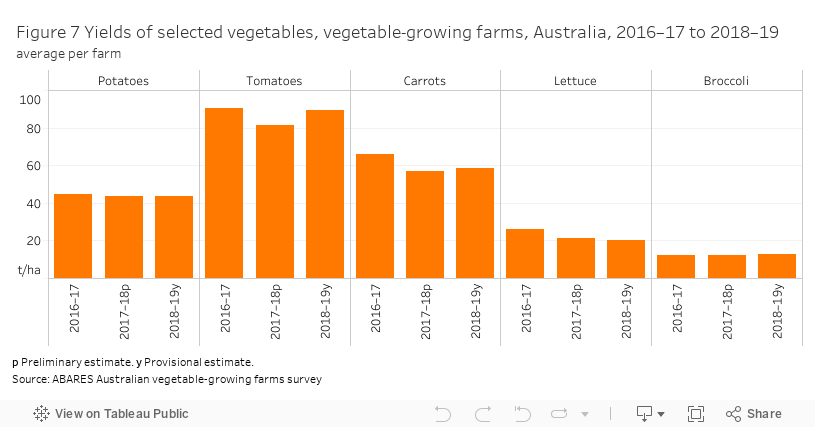
Despite low rainfall, most vegetable-growing farms use irrigation water to supplement rainfall. As a consequence, yields for most vegetable crops remained relatively similar to previous years (Figure7).
Vegetable prices
Changes in the quantity of vegetables produced and prices received have a strong influence on changes in farm cash incomes in the vegetable-growing industry each year. Australian vegetable-growing farms mostly produce for the domestic market. As a result, changes in vegetable prices tend to vary inversely with domestic production, with little direct influence from developments in export markets.
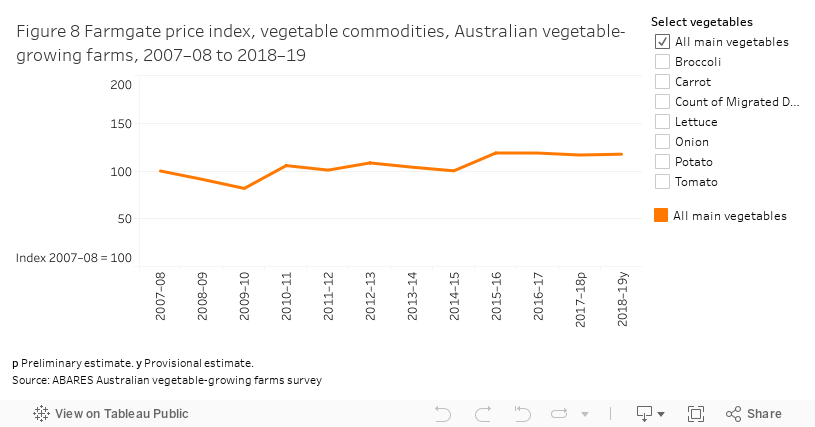
A weighted index of farmgate prices received for the main vegetables produced by Australian vegetable-growing farms remained relatively steady in 2017–18 (Figure 8). Vegetable-growing farms received lower average prices for potatoes, pumpkins, tomatoes, onions, carrots, cauliflower and cabbages but higher average prices for green peas, green beans, broccoli, cucumber, lettuce, capsicum and Asian vegetables. The weighted index of farmgate prices received for the main vegetables is estimated to have increased slightly in 2018–19.
Farm cash income and profit
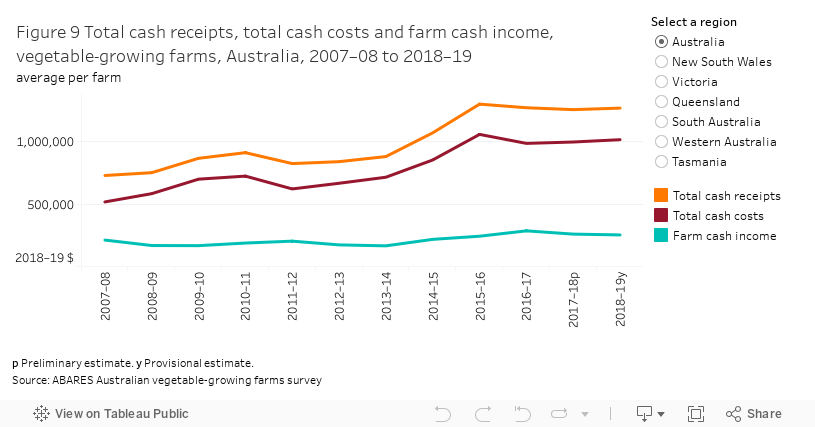
In 2018–19, average farm cash income of Australian vegetable-growing farms remained largely unchanged at an estimated $253,000 per farm (Table 3). In real terms, this is above the average since 2007–08 (Figure 9). Total cash receipts increased by 3% but cash costs rose by 4%. This followed a decline in average farm cash income of around 7% in 2017–18.
p Preliminary estimate. y Provisional estimate. na Not available.
Source: ABARES Australian vegetable-growing farms survey
Farm business profit of vegetable-growing farms is projected to have averaged $124,000 per farm in 2018–19, 2% lower than in 2017–18 (Table 3). Farm business profit is a measure of long-term profitability. It accounts for capital depreciation, payments for family labour and changes in inventories of vegetables, livestock, fodder and grain held on farm.
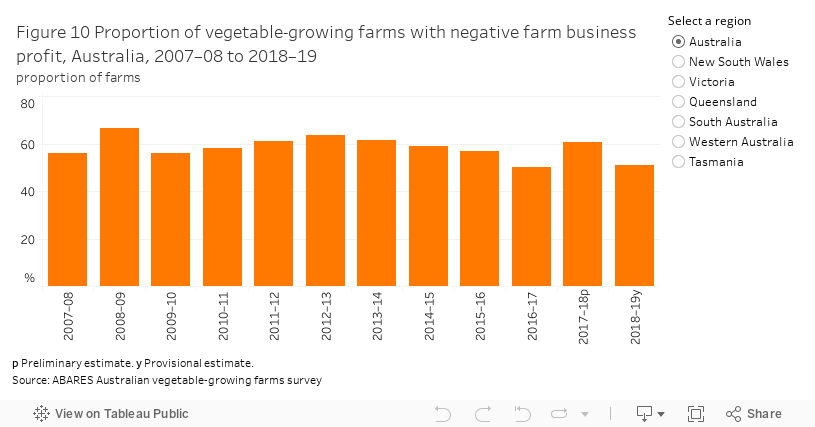
Many farms occasionally record negative farm business profit as their income fluctuates. Negative farm business profit means a farm has not covered the costs of unpaid family labour or set aside funds to replace depreciating farm assets. However, ongoing low or negative profit affects long-term viability because farms have reduced capacity to invest in newer and more efficient technologies. From 2007–08 to 2017–18, the proportion of vegetable-growing farms recording negative farm business profit averaged 59% a year. The proportion of farms recording negative farm business profit is estimated to have been 51% in 2018–19. This is a decline from 2017–18 (61%), mainly due to due to farms receiving higher average vegetable prices (Figure 10).
Total cash receipts
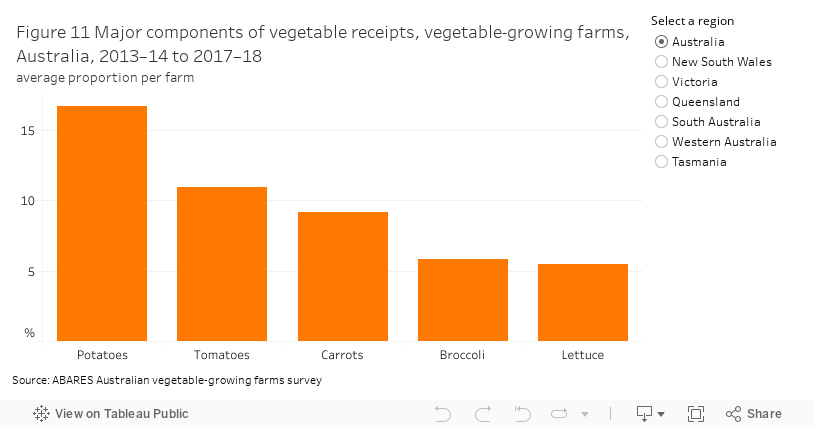
In 2017–18, receipts from the sale of vegetables accounted for an estimated 88% of average total cash receipts. Average total vegetable receipts rose slightly by 2% in 2017–18 as a result of an increase in areas planted to vegetables and increased quantity of vegetables sold. Higher receipts from tomatoes, capsicum, Brussels sprouts and other vegetables contributed to most of the increase in total vegetable receipts. On average over the 5 years to 2017–18, potato receipts were the largest component of vegetable receipts (contributing around 17%), followed by receipts from tomatoes, carrots, broccoli and lettuce (Figure 11).
In 2018–19, total vegetable receipts are projected to have increased by 2% for vegetable-growing farms to average $1,108,000 per farm (Table 3). Increased receipts for tomatoes, pumpkins, carrots and other vegetables were partly offset by lower receipts for Brussels sprouts and lettuce.
Total cash costs
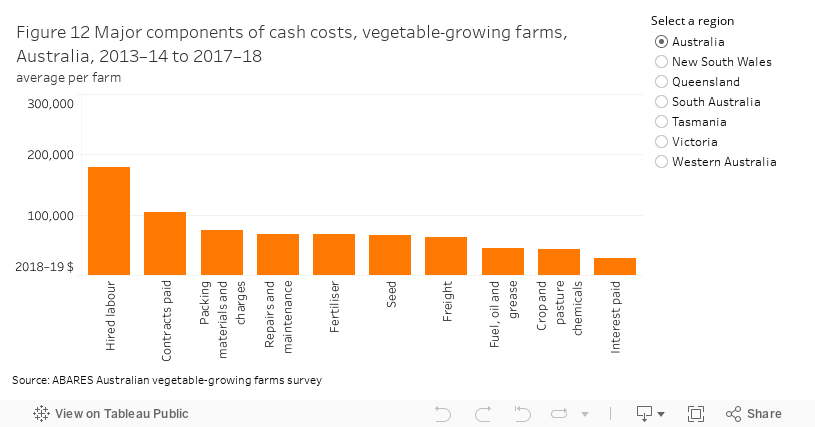
In 2018–19, average total cash costs are projected to have risen by around 4% (Table 3). Increased expenditure on hired labour and contracts paid contributed to most of the rise in cash costs. On average over the 5 years to 2017–18 the main components of cash costs were hired labour, contracts paid, packing materials and charges, repairs and maintenance and fertiliser (Figure 12).
Rate of return
The average rate of return (excluding capital appreciation) of Australian vegetable-growing farms declined from 4.8% in 2016–17 to 3.8% in 2017–18, reflecting lower farm cash incomes (Figure 13). The average rate of return is estimated to have remained largely unchanged in 2018–19 at 3.9%.
In 2017–18, the performance of vegetable-growing farms varied widely (Figure 14). Around 42% of vegetable-growing farms recorded a rate of return (excluding capital appreciation) of less than 0, and around 28% had a rate of return of between 0 and 5%. An estimated 30% of vegetable-growing farms had a rate of return (excluding capital appreciation) in excess of 5%.
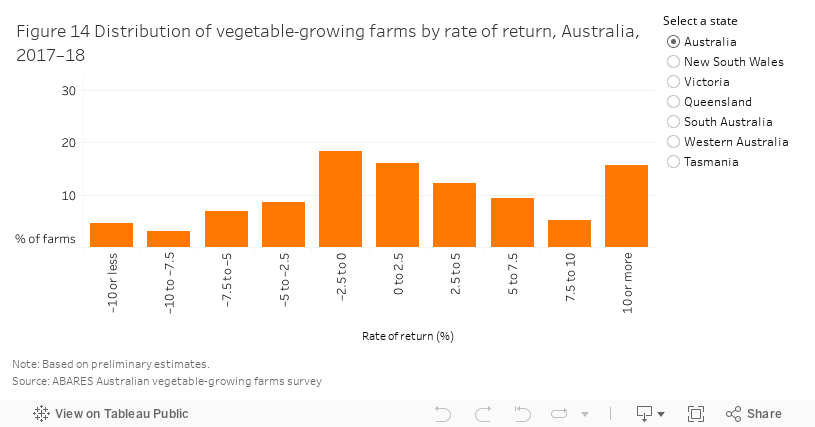
Top performing vegetable-growing farms that had returns of 10% or more (around 16% of farms) were mostly large farms (by average area planted to vegetables) with high levels of capital investment and intense vegetable-producing operations.
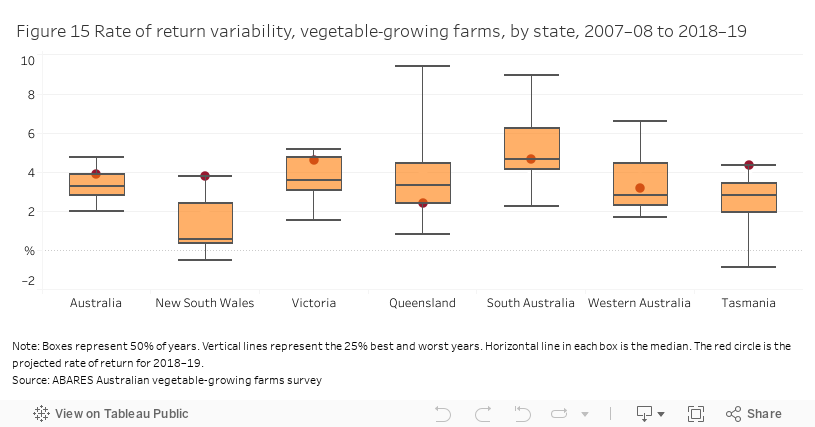
In 2018–19, average rates of return (excluding capital appreciation) are projected to have been positive across all states except Western Australia. South Australia is projected to have the highest estimated average rate of return (excluding capital appreciation) at 4.7%, followed by Victoria (4.6%) and Tasmania (4.4%).From 2007–08 and 2018–19, vegetable-growing farms in South Australia and Western Australia recorded the greatest overall variation in rates of return (Figure 15).
Performance by state
New South Wales
In 2017–18, average farm cash income for New South Wales vegetable-growing farms increased by an estimated 19% to $204,200 per farm (Table 4). Total vegetable production per farm increased as a result of a rise in average area planted to vegetables. Average total cash costs increased by 17% to around $408,500 per farm. Contracts paid, freight, hired labour and seed costs were the largest contributors to the increase in total cash costs in 2017–18.
Average farm cash income is estimated to have increased by a further 28% in 2018–19 to $261,000 per farm, mainly because of an increase in average vegetable prices and quantity of vegetables sold.
p Preliminary estimate. y Provisional estimate. na Not available.
Source: ABARES Australian vegetable-growing farms survey
Victoria
Farm cash income for Victorian vegetable-growing farms fell by 3% to average $448,000 per farm in 2017–18 (Table 5). Total vegetable receipts declined due to lower yields for most vegetables reducing production. Decreased receipts from carrots contributed most to the decline in total vegetable receipts. Average total cash costs decreased by 10% to $1,653,500 per farm. Reduced expenditure on contracts paid, packing materials and charges, freight, and repairs and maintenance contributed most to the decline in cash costs.
Average farm cash income is estimated to have declined by a further 7% to $419,000 per farm in 2018–19. This is because total cash costs are estimated to have increased by more than the small increase in total cash receipts.
p Preliminary estimate. y Provisional estimate. na Not available.
Source: ABARES Australian vegetable-growing farms survey
Queensland
Farm cash income for Queensland vegetable-growing farms declined by 21% to average $216,400 per farm in 2017–18 (Table 6). An estimated 18% increase in total cash costs more than offset a rise in total cash receipts as a result of higher average vegetable prices. Expenditure on contracts paid, hired labour, freight, and packing materials and charges were the main contributors to the increase in total cash costs in 2017–18.
Average farm cash income is estimated to have declined by 31% to around $149,000 per farm in 2018–19. Vegetable receipts are estimated to have fallen slightly by around 2%, mainly as a result of a decline in potatoes and lettuce receipts. Average total cash costs are estimated to have increased by around 4% in 2018–19.
p Preliminary estimate. y Provisional estimate. na Not available.
Source: ABARES Australian vegetable-growing farms survey
South Australia
Farm cash income for South Australian vegetable-growing farms declined by an estimated 8% to around $256,600 per farm in 2017–18 (Table 7). An estimated 12% increase in total cash costs more than offset a rise in total cash receipts from increased vegetable production. Expenditure on seed, fertiliser, fuel, oil and grease, contracts paid and freight were the main contributors to the increase in total cash costs in 2017–18.
Average farm cash income is estimated to have declined by a further 4% to $248,000 per farm in 2018–19. Vegetable receipts are estimated to have increased by around 2%, mainly as a result of an increase in tomatoes, carrots and cucumber receipts due to increased average prices. Average total cash costs are estimated to have increased by around 3% in 2018–19.
p Preliminary estimate. y Provisional estimate. na Not available.
Source: ABARES Australian vegetable-growing farms survey
Western Australia
Farm cash income for Western Australian vegetable-growing farms declined by 28% to around $237,700 per farm in 2017–18 (Table 8). Total vegetable receipts declined by 13% as a result of declines in receipts for lettuce, tomatoes and potatoes. Total cash costs decreased by around 10%, driven by a decline in expenditure on packing materials and charges, freight, hired labour and interest paid.
Average farm cash income is estimated to have declined by 17% to $198,000 per farm in 2018–19. Total vegetable receipts are expected to have declined slightly because of a projected fall in total vegetable production. A number of farms in Western Australia had significantly reduced vegetable production in 2018–19. Many of these farms were either exiting vegetable production completely or were in the process of shifting to other horticultural crops.
p Preliminary estimate. y Provisional estimate. na Not available.
Source: ABARES Australian vegetable-growing farms survey
Tasmania
Farm cash income for Tasmanian vegetable-growing farms declined by 31% to $111,900 per farm in 2017–18 (Table 9). Total vegetable receipts decreased by 7% as a result of lower vegetable prices. Lower potato, tomato and onion receipts were the main contributors to the decline in vegetable receipts. Total cash costs were relatively steady, mainly because of increased expenditure on interest paid, fuel, oil and grease and fertiliser partly offsetting increases in other expenditure items.
Average farm cash income is estimated to have increased by around 92% to $215,000 in 2018–19. Total vegetable receipts are estimated to have risen by around 25%, primarily because of increases in potato receipts due to improved yields and prices. Average total cash costs are estimated to have increased by around 4% in 2018–19.
p Preliminary estimate. y Provisional estimate. na Not available.
Source: ABARES Australian vegetable-growing farms survey
Farms growing vegetables under the National Vegetable Levy
The National Vegetable Levy (NVL) is payable on specific vegetables grown in Australia by producers who either sell the product or use it in the production of other goods. Vegetables subject to the NVL are shown in Table 10. The levy is used to fund Horticulture Innovation Australia—a grower-owned research and development company that invests in horticultural research, development and marketing. The following analysis covers only growers who produced vegetables subject to the NVL.
a Other statutory R&D levies apply to mushrooms, onions, potatoes and melons.
Note: The ABARES Australian vegetable-growing farms survey does not collect information on asparagus and mushrooms as individual vegetable commodities.
Source: Agriculture 2019
Farms paying the NVL accounted for an estimated 72% of vegetable-growing farms in 2017–18 (Table 11). Many of these farms also produced vegetables not covered by the levy.
a Population excludes farms that only grow asparagus, mushrooms, onions, potatoes and tomatoes.
Source: ABARES Australian vegetable-growing farms survey
NVL-paying farms are on average slightly smaller by area than non-NVL-paying vegetable-growing farms. Around 65% of NVL-paying farms planted less than 20 hectares of vegetables in 2017–18. The average area operated by NVL-paying farms was estimated to have been around 150 hectares, compared to 244 hectares for non-NVL-paying vegetable-growing farms.
NVL-paying farms also tend to be more diversified than the average non-NVL farm, producing a greater variety of vegetable crops, with higher total vegetable receipts. In comparison, non-NVL farms tend to specialise in one or two vegetable enterprises.
In 2017–18 an estimated 81% of NVL-paying vegetable-growing farms had exclusively outdoor vegetable operations. Some farms also used hydroponics (11%) or under-cover systems (18%).
The average farm cash income of NVL-paying vegetable-growing farms was largely unchanged in 2017–18 at an estimated $218,800 per farm (Table 12). Total vegetable receipts increased by 6% mainly as a result of increased tomato and capsicum receipts. Average total cash costs also increased, reflecting increased vegetable production per farm. Expenditure on hired labour, contracts, and seed contributed mainly to higher total cash costs. Farm cash income is projected to have declined by 4% in 2018–19 to average $248,000 per farm.
p Preliminary estimate. y Provisional estimate. na Not available.
Note: Population excludes farms that only grow asparagus, mushrooms, onions, potatoes and tomatoes.
Source: ABARES Australian vegetable-growing farms survey
Farm business profit of NVL-paying vegetable-growing farms was steady at $129,900 per farm in 2017–18 (Table 12). Farm business profit is projected to have decreased to average $119,000 per farm in 2018–19.
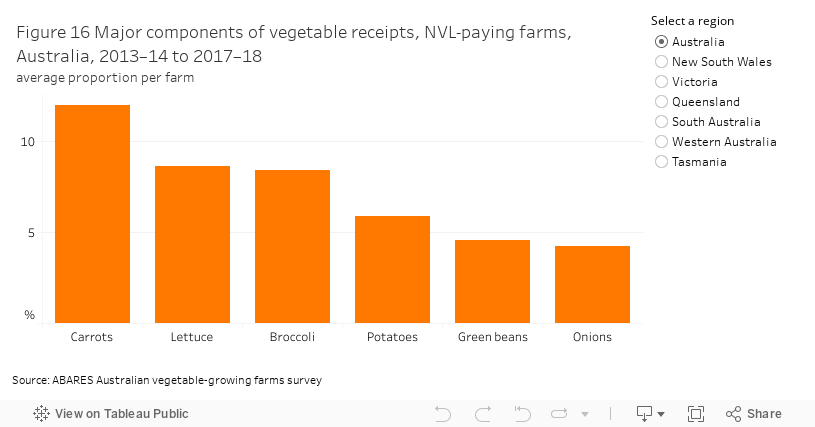
On average over the 5 years to 2017–18, carrot receipts were the largest component of vegetable receipts for NVL-paying farms. Carrots contributed around 12%, followed by receipts from lettuce, broccoli, potatoes, green beans and onions (Figure 16).
Total vegetable receipts increased by 6% for NVL-paying farms in 2017–18 as a result of increased vegetable production per farm due to increased average area planted to vegetables. Receipts from the sale of vegetables accounted for 90% of total cash receipts in 2017–18. Increases in receipts from tomatoes, capsicum, Brussels sprouts, green beans and other vegetables contributed most to the increase in total vegetable receipts. In 2018–19, total vegetable receipts are projected to have remained unchanged as a result of reduced vegetable production per farm despite slightly higher prices.
The average quantity of vegetables produced per NVL-paying farm increased slightly by 5% in 2017–18 to be 45% higher than the 10-year average to 2016–17. This was the result of an increase in average area planted despite lower crop yields for most vegetables. Increased plantings of pumpkins and other vegetables were the main drivers of the rise in total vegetable plantings in 2017–18.
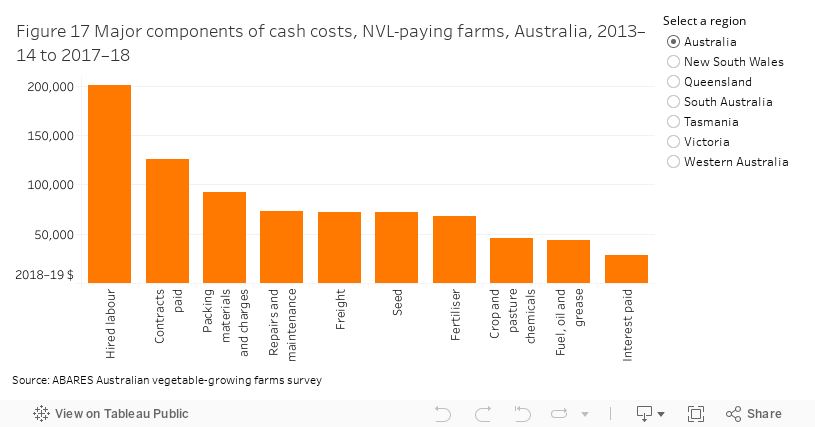
On average over the 5 years to 2017–18 the main components of cash costs of NVL-paying farms were hired labour, contracts paid, packing materials and charges, repairs and maintenance and freight (Figure 17). Average cash costs of NVL-paying farms increased by 8% in 2017–18 to $1,116,300 per farm (Table 12). Increased expenditure on hired labour, contracts paid, seed and freight costs contributed to most of the rise in total cash costs in 2017–18. Average total cash costs are projected to have increased by a further 2% in 2018–19.
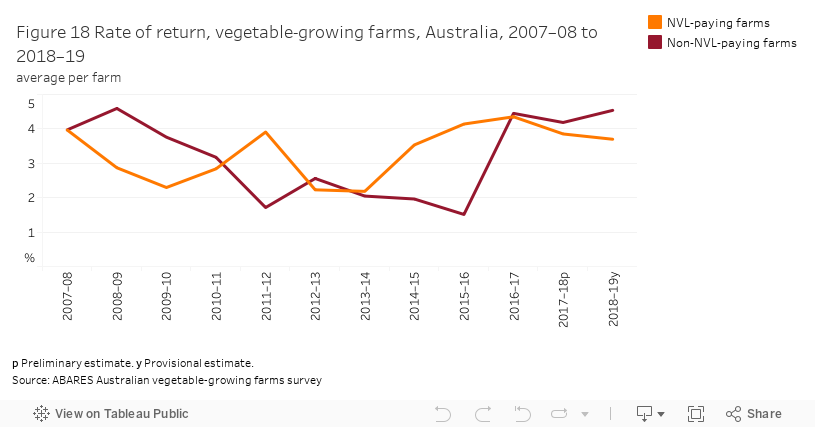
On average since 2016–17, the rate of return of NVL-paying farms has declined while non-NVL farms has increased slightly (Figure 18). In 2018–19, NVL-paying farms are projected to have recorded an average rate of return of 3.7% and non-NVL-paying farms are projected to have recorded a return of 4.5%.
Farm debt and equity
- In 2017–18, total farm debt at 30 June declined by around 18% to an average of $347,000 per farm.
- With a reduction in average farm debt, the proportion of farm receipts needed to fund interest payments remains low at around 2 per cent.
Detailed farm debt and equity
Trends in average debt per farm
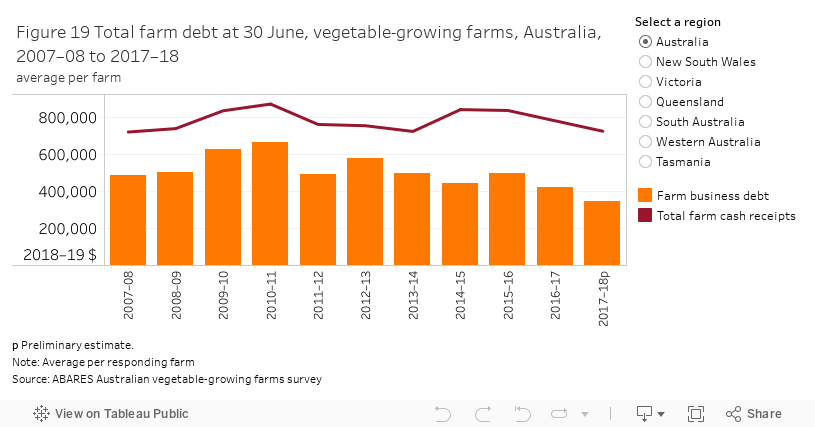
Debt is an important source of funds for investment and ongoing working capital for many vegetable-growing farms. At the national level, from 2007–08 to 2017–18 average total debt per farm decreased by around 28% in real terms (Figure 19). Changes in debt from year to year are mainly a result of changes in debt for working capital. Overall changes in average debt are generally accompanied by similar changes in average total cash receipts per farm. In 2017–18 total farm debt at 30 June decreased by around 18% to an average of around $347,000 per farm, mainly because of reduced debt from purchasing land.
In ABARES farm surveys, debt is recorded by its main purpose. However, because some loans cover a range of purposes, estimates of debt by main purpose provide a guide only.
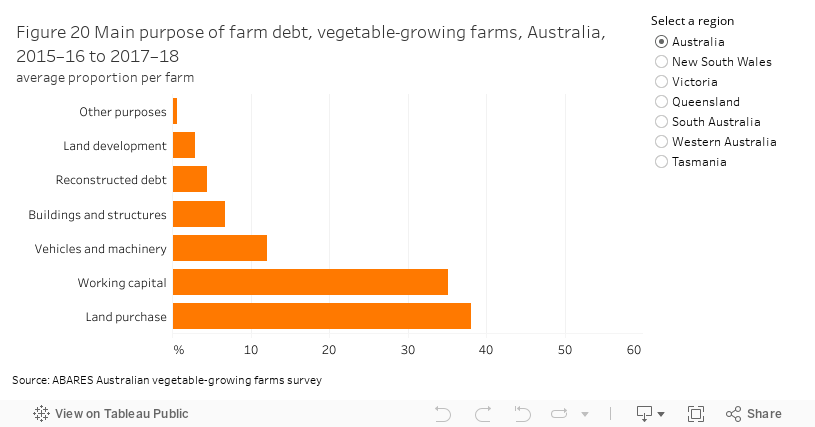
Over the 3 years to 2017–18 land purchases accounted for the largest proportion of total farm debt at 38% on average (Figure 20). A further 35% of debt was for working capital and around 12% was for purchases of vehicles and machinery. The remaining debt was for a range of purposes such as buildings, structures and land development.
Equity ratio
Increases in average total debt of vegetable-growing farms at 30 June have been largely matched by equivalent changes in farm capital. As a consequence, from 2007–08 to 2017–18 the average equity ratio of vegetable-growing farms has remained around 86%.
In 2017–18 an estimated 70% of vegetable-growing farms had an equity ratio above 90% (Table 13), 21% had an equity ratio of 70% to 90% and the remaining 10% had an equity ratio of less than 70%. The main difference between the three groups was that vegetable-growing farms with lower equity ratios tended to generate significantly higher receipts per hectare than farms with higher equity ratios, this is because many of these low equity ratio farms are large and intensive vegetable growers.
Note: Based on preliminary estimates. Rows may not sum to 100 due to rounding.
Source: ABARES Australian vegetable-growing farms survey
Debt-servicing capacity
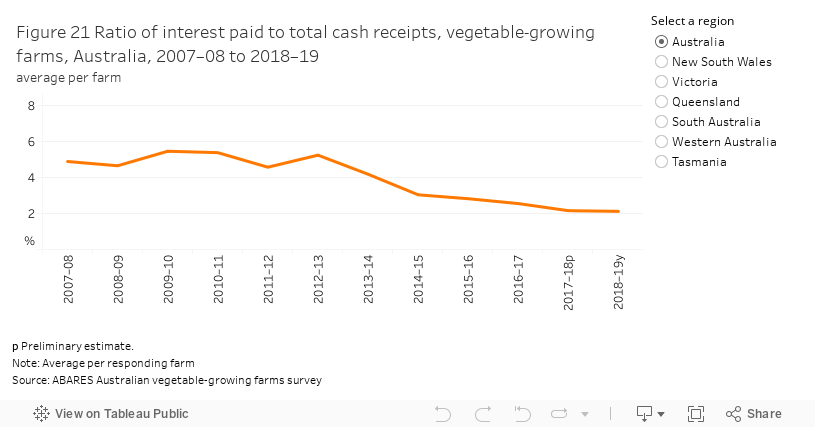
The long-term viability of a farm is affected by its capacity to service debt by making interest payments and paying down the principal. The proportion of farm receipts spent on interest payments is a useful indicator of short-term capacity to service debt. From 2007–08 to 2012–13 the proportion of farm receipts needed to fund interest payments, averaged around 5% (Figure 21). From 2012–13 the ability of vegetable-growing farms to service their debts improved as a result of higher farm receipts relative to debt and reduced interest rates. For 2018–19 it is estimated that the proportion of receipts needed to meet interest payments was just over 2%.
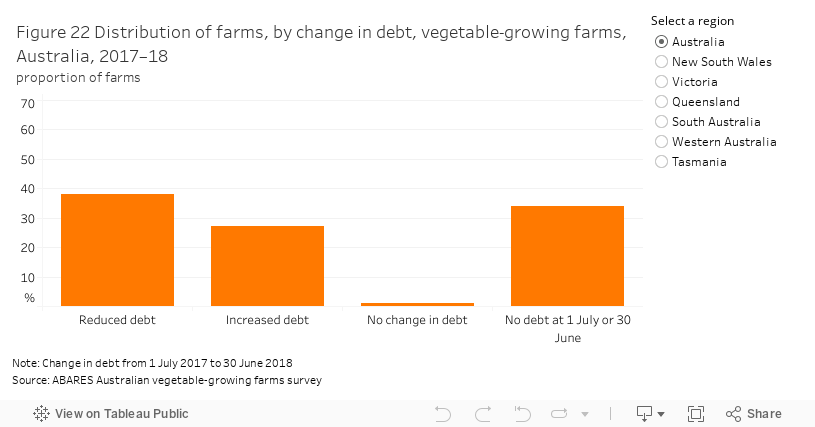
At the national level, around 38% of vegetable-growing farms reduced their total debt from 1 July 2017 to 30 June 2018 (Figure 22). An estimated 27% of vegetable-growing farms increased their debt and around 1% had no change in debt. The remaining 34% of farms held no debt at 1 July 2017 and 30 June 2018.
Distribution of farms, by debt and equity
From 2015–16 to 2017–18 an estimated 32% of vegetable-growing farms held no debt at 30 June, with a further 23% of vegetable-growing farms holding less than $100,000 in debt (Table 14). Farms with low debt are generally older, more established businesses.
Farms with higher total capital also tend to have higher levels of total debt, leading to lower equity ratios than for farms with less capital. Vegetable-growing farms with high debt generally have better debt servicing capacity, reflected by higher total cash receipts and rates of return.
a Rate of return excluding capital appreciation.
Note: Rows may not sum to 100 due to rounding.
Source: ABARES Australian vegetable-growing farms survey
An estimated 70% of vegetable-growing farms had equity ratios above 90% in 2017–18, with a significant proportion of these farms having no debt (Table 15). Only 10% of all vegetable-growing farms had an equity ratio below 70%, covering a range of different debt levels.
Note: Based on preliminary estimates. Row and column totals may not sum to 100 due to rounding.
Source: ABARES Australian vegetable-growing farms survey
Debt and equity, by state
Debt and equity ratios of vegetable-growing farms vary significantly by state. From 2015–16 to 2017–18 vegetable-growing farms in New South Wales had lower average debt and higher farm equity ratios than other states (Figure 23 and Figure 24). This is primarily a result of the smaller operating size of New South Wales vegetable-growing farms.


The distribution of debt among vegetable-growing farms in each state also varied significantly (Table 16). New South Wales had the largest proportion with less than $100,000 or no debt, while Tasmania and Queensland had the smallest. The proportion of farms with more than $1 million of debt was highest in Tasmania where around 22% of vegetable-growing farms held debts greater than $1 million at 30 June 2018. This was mainly as a result of large on-farm investments and intensive vegetable production.
Note: Based on preliminary estimates. Rows may not sum to 100 due to rounding.
Source: ABARES Australian vegetable-growing farms survey
Farm capital and investment
- On average, 43% of vegetable-growing farms each year made additions to their total capital from 2007–08 to 2017–18.
- The total value of capital for all Australian vegetable-growing farms decreased by 20% in real terms from 2007–08 to 2017–18 because of a reduction in the number of vegetable-growing farms.
Detailed farm capital and investment
Total farm capital
Investment in farm capital is important for the ongoing development of the Australian vegetable-growing industry. Investments in land, fixed improvements, and plant and equipment are key drivers of vegetable growers’ capacity to generate farm outputs.
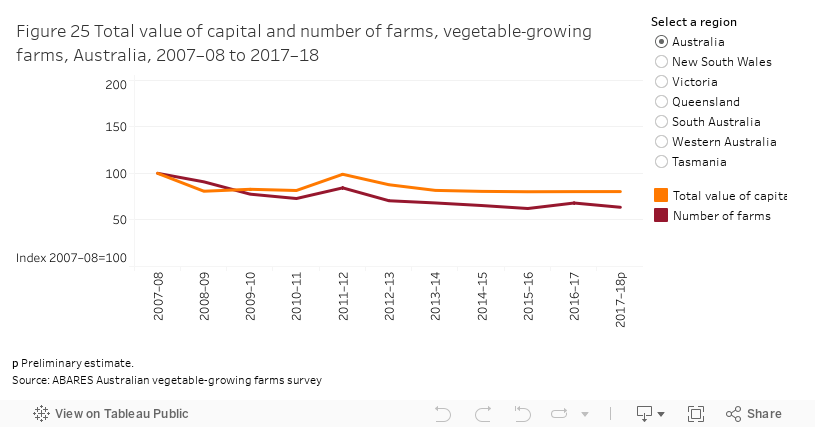
From 2007–08 to 2017–18 the total value of capital for all Australian vegetable-growing farms decreased by around 20%, in real terms (Figure 25). This decline in the total value of capital can be attributed to the reduction in the total number of vegetable-growing farms. On a per farm basis, average total capital increased by around 26% to around $4.6 million per farm, largely as a result of increases in land values per hectare and the total value of plant and equipment per farm.
From 2007–08 to 2017–18 the share of total industry capital in each state has fluctuated, with upward trends in New South Wales and Victoria but a downward trend in Queensland. The share of total industry capital in South Australia, Western Australia and Tasmania has fluctuated over time but is relatively unchanged from 2007–08.
Vegetable-growing farms in Victoria accounted for 29% of total farm capital in 2017–18, followed by New South Wales (24%), Queensland (19%), South Australia (11%), Tasmania (9%) and Western Australia (8%).
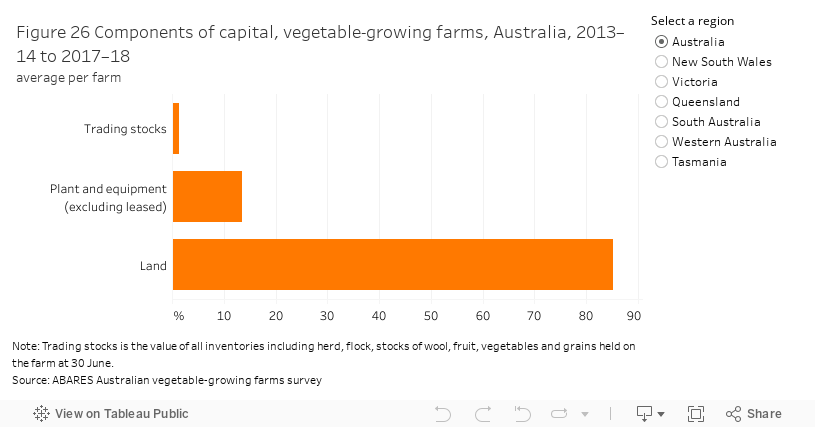
From 2013–14 to 2017–18 land accounted for an average of 85% of total capital per farm (Figure 26). Plant and equipment accounted for a further 14% of total capital, and trading stocks accounted for 1%. Livestock and trading stocks accounted for around 1% of total capital in all states except Tasmania, where it accounted for 3%, on average. This was because Tasmania has a higher proportion of vegetable growers who produce livestock or crops other than vegetables.
Return on land
ABARES uses two rates of return to farm capital—rate of return excluding capital appreciation and rate of return including capital appreciation. Rate of return is defined as farm business profit expressed as a percentage of total capital. Because land is the largest component of total farm capital, it plays a key role in determining total farm returns.
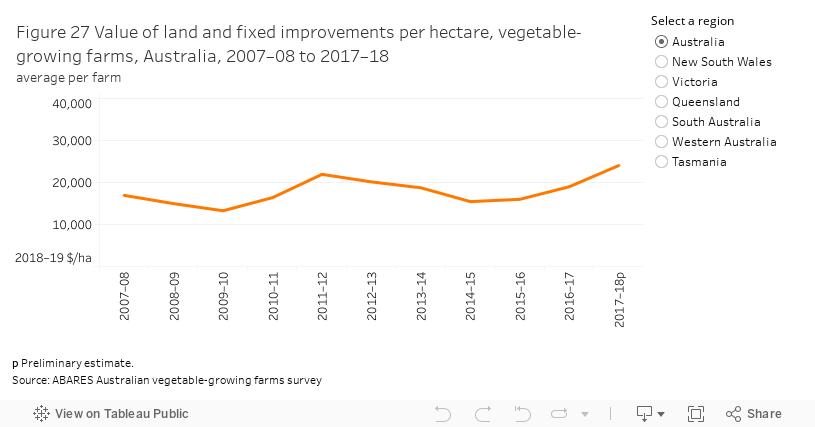
Due to the location of most Australian vegetable-growing farms, land values per hectare are generally much higher than those of other agricultural producers. From 2007–08 to 2017–18 the average value of land and fixed improvements per hectare for Australian vegetable-growing farms fluctuated, peaking at an average of around $24,100 per hectare in 2017–18, in real terms (Figure 27). From 2007–08 to 2017–18 the average value of land and fixed improvements per hectare for vegetable-growing farms increased by around 42%, in real terms.
From 2007–08 to 2017–18 changes in land values per hectare varied by state, with average land values trending upwards in New South Wales and Victoria, but falling in Western Australia because there were fewer vegetable farms located in the higher land value areas close to Perth. Nevertheless, averaged over the period from 2007–08 to 2017–18, Western Australia recorded the highest land values, followed by Victoria and New South Wales.
New farm investment
Most farmers make new investments each year to add to the existing capital stock or to replace capital items that have reached the end of their useful life. Farm investments are usually made with longer-term outcomes in mind and based on expected returns over the life of the investment.
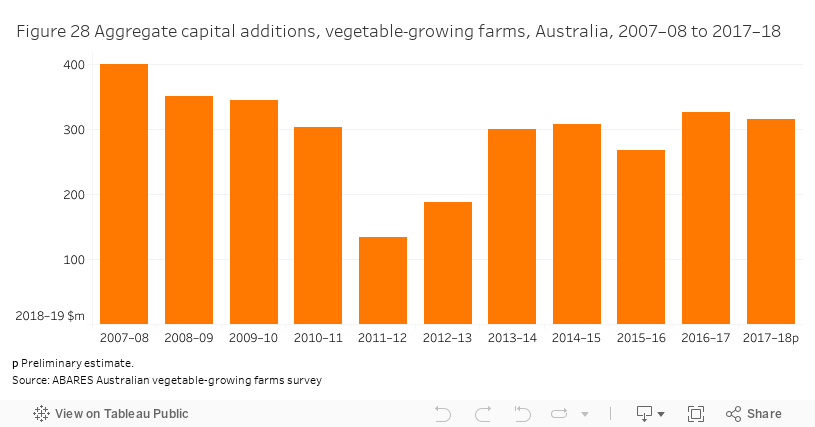
In total, Australian vegetable growers are estimated to have made an average of $292 million in new capital investment in land, buildings, structures, plant and livestock each year from 2007–08 to 2016–17, in real terms (Figure 28). In 2017–18, vegetable growers are estimated to have made a total of $315 million in new investment in land, buildings and structures, and plant and livestock.
In 2017–18, New South Wales accounted for an estimated 31% ($98 million) of the value of capital additions made by all vegetable growers. South Australia and Queensland each accounted for 17% of total capital. Western Australia (13%), Victoria (13%) and Tasmania (9%) accounted for the remaining total capital additions in 2017–18.
On average, 43% of vegetable-growing farms each year made additions to their capital over the 11 years to 2017–18. The amount invested each year by those making capital additions fluctuated broadly in line with movements in farm cash incomes. In 2017–18 an estimated 62% of vegetable-growing farms made capital additions at an average of $212,900 per farm.
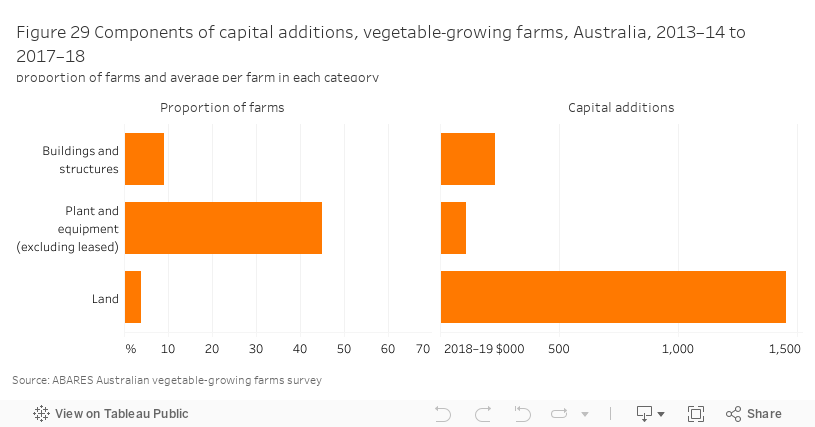
Land is the biggest component of capital additions each year. However from 2013–14 to 2017–18 only 4% of vegetable growers bought land each year, on average (Figure 29). Average expenditure on land for those making purchases was around $1.5 million per farm.
Over the period, around 45% of all vegetable growers made additions to plant and equipment each year, at an average of around $111,300 per farm. Around 9% of vegetable growers made additions to buildings and structures. Expenditure on these capital additions averaged around $232,200 per farm.
From 2013–14 to 2017–18 the average proportion of vegetable-growing farms making capital additions varied by state. Tasmania had the highest proportion of vegetable growers making capital additions in all three categories—buildings and structures, land, and plant and equipment (excluding leased).
In all states, plant and equipment additions were the most common additions made by vegetable growing farms, followed by buildings and structures.
Farm management deposits
ABARES farm surveys record the total holdings of farm management deposits (FMDs) held by partners in the farm business (individuals sharing the farm business’s profits) at 1 July and 30 June. The proportion of vegetable-growing farms holding FMDs averaged around 11% from 2007–08 to 2013–14, before increasing to around 20% in 2014–15 (Figure 30). In 2017–18, an estimated 12% of vegetable-growing farms held FMDs at 30 June. The value of FMDs held fluctuated around an average of $238,400 per farm in real terms from 2007–08 to 2017–18.
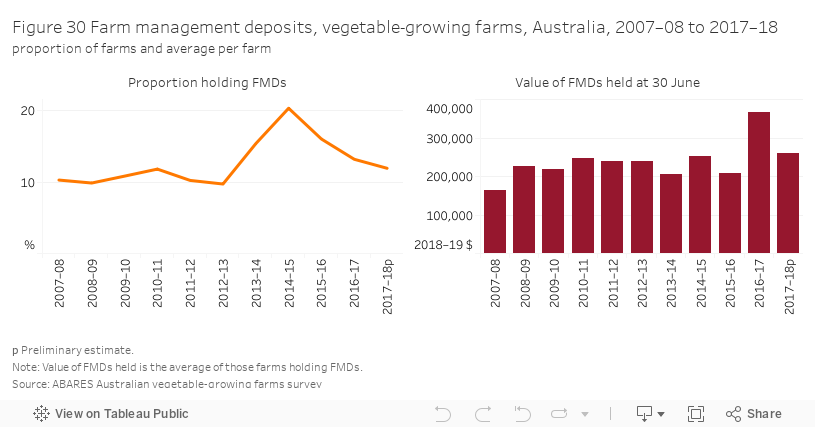
Vegetable-growing farms holding FMDs in 2017–18 recorded superior financial performance on average, including higher farm cash incomes, rates of return and farm capital than vegetable-growing farms that did not hold FMDs (Table 17).
Note: Based on preliminary estimates. a rate of return excluding capital appreciation.
Source: ABARES Australian vegetable-growing farms survey
Supplementary analysis
The Australian vegetable-growing industry faces a range of important challenges in the face of import competition, market fragmentation and tight margins. The industry includes many farm businesses that are geographically dispersed, people from a range of ethnic and cultural backgrounds, and supply a variety of products to meet domestic and export consumer demand.
The ABARES Australian vegetable-growing farms survey includes a set of supplementary questions that allow detailed analysis of a range of issues. These include: vegetable-growing cost of production; markets and value adding; irrigation and production management; training and business management; research and development; and opportunities and intentions.
Vegetable-growing cost of production
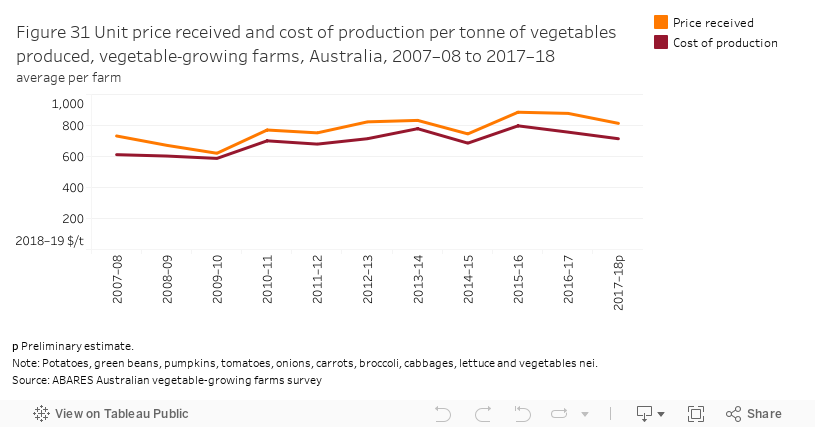
- From 2007–08 to 2017–18, average unit prices received for vegetables and unit costs of production both increased, but the average margin received has fluctuated slightly over time.
- The cost of labour makes up a considerable proportion of total costs for all vegetables.
- The average margin per ton (receipts minus costs) in the 3 years to 2017–18 varied considerably between vegetables.
Detailed vegetable-growing cost of production
The cost of producing vegetables is determined by a number of factors including the production system in use, the location of the farm, the type of vegetable(s) produced, and the scale and intensity of production.
When examined in aggregate, average cash costs do not tell the full story of how costs are changing for specific vegetables due to the highly varied production systems utilised by vegetable-growing farms. As such, the ABARES Australian vegetable-growing farms survey includes a series of questions to allow costs to be apportioned by individual vegetable crops.
Estimates of unit costs of production and receipts are useful for monitoring the pressures facing vegetable-growing farms. From 2007–08 to 2017–18, average unit prices received for vegetables and unit costs of production both increased, but the average margin received has fluctuated slightly over time (Figure 31).
Cost of production for selected vegetables
Table 18 shows a three year average of the main components of costs for vegetable-growing farms for a selection of vegetables. It is important to note that the table includes all types of vegetable-growing farms and, as such, will include farms that are producing highly-specialised products as well as large-scale farms producing vegetables for processing. Typically, these farms have widely varying production costs. For example, the results for tomatoes include some very large and highly intensive tomato growers that influence the results shown in Table 18.
Note: All dollar amounts are in 2018–19 dollars.
Source: ABARES Australian vegetable-growing farms survey
Margins per tonne (defined as the ratio of unit receipts to unit costs of production) vary between vegetables, with tomatoes having the highest average margin at around 34% and broccoli having the lowest average at around –3% from 2015–16 to 2017–18. In absolute terms, tomatoes had the highest gross margin (defined as unit receipts minus unit costs) at $696 per tonne and broccoli had the lowest at –$61 per tonne—both excluding the cost of family labour (Figure 32 and Figure 33).

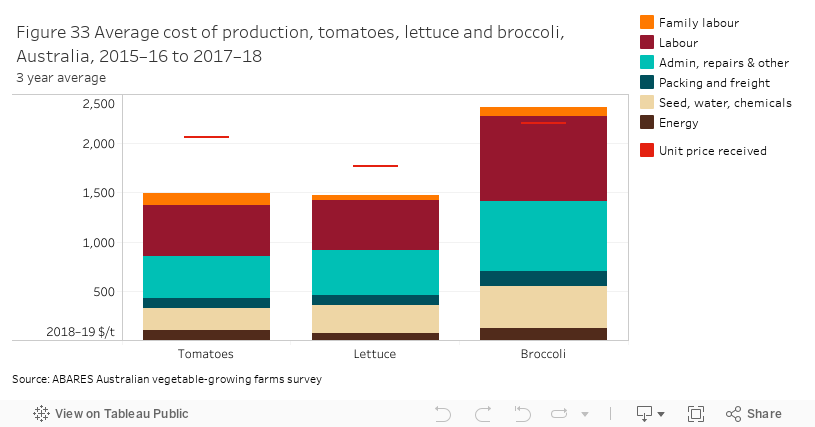
When the cost of family labour is taken into account the average margin per tonne varies considerably between vegetables with average gross margins ranging between around –7 % for broccoli and 28% for tomatoes. Tomatoes had the highest gross margin in absolute terms at an average of $573 per tonne whereas broccoli had the lowest at an average of –$151 per tonne from 2015–16 to 2017–18.
Family labour is imputed using the hours reported by the co-operator that were worked by the owner-manager and any family members and then valued at the relevant award wage (see ABARES farm surveys definitions and methods). This ensures that family labour is valued equally across all farms.
Although the average margin for broccoli is negative when family labour is included, broccoli-growing farms still recorded positive average farm business profits. When averaged over the three years from 2015–16 to 2017–18, broccoli-growing farms had a farm cash income of around $682,700 per farm and an average farm business profit of $503,700 per farm. As such, these vegetable-growing farms derived their profits in this period from other enterprises or other vegetables planted and there may be rotational benefits from planting a broccoli crop.
Table 19 and Figure 34 show a breakdown of costs by contribution to total costs. The three categories of labour (hired labour, contracts, and family labour) make up a considerable proportion of total costs ranging from around 26% for potatoes to over 43% for tomatoes. However, the utilisation of these three types of labour varies between vegetables produced, with tomato-growers having the highest proportion of hired labour, broccoli-growers having the highest proportion of contract labour and potato-growers having the highest proportion of family labour. The differences in the ratios of labour used are determined by a number of factors, including seasonality of the crop, methods of harvesting, and the availability of capital equipment to harvest specific types of vegetables. For example, an under-cover tomato-grower may require permanent staff to harvest their crop year-round whereas an outdoors broccoli-grower may only require contractors for harvesting over a few weeks.
Note: Columns may not sum to 100 due to rounding.
Source: ABARES Australian vegetable-growing farms survey
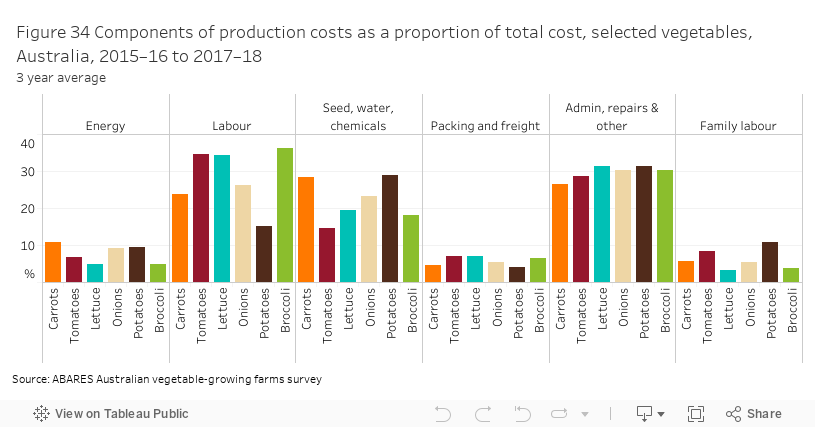
Energy costs, consisting of electricity and fuel costs, comprised less than 10% of total costs for all vegetables, except carrots where energy made up just under 11% of total costs. Energy costs per tonne were similar for carrots, potatoes and onions.
As a proportion of total costs, potatoes had the highest expenditure on seed, fertiliser, water and chemicals at 29%, closely followed by carrots at 28% whereas these inputs only comprised around 15% of the total cost per tonne for tomatoes.
Cost of production by scale of production
The average cost of production for vegetables varies significantly by the scale of production (Tables 20 to 25, Figure 35 and Figure 36). For all selected vegetables, except carrots, the higher production farms had lower total costs per tonne produced. However, the magnitude of the difference in production costs varied significantly between vegetables. Lettuce-growers planting more than 5 hectares of lettuce had the largest difference at around $1,100 per tonne lower than lettuce-growers planting 5 hectares or fewer (Table 24).
Note: All dollar amounts are in 2018–19 dollars.
Source: ABARES Australian vegetable-growing farms survey
Note: All dollar amounts are in 2018–19 dollars
Source: ABARES Australian vegetable-growing farms survey
Note: All dollar amounts are in 2018–19 dollars
Source: ABARES Australian vegetable-growing farms survey
Note: All dollar amounts are in 2018–19 dollars
Source: ABARES Australian vegetable-growing farms survey
Note: All dollar amounts are in 2018–19 dollars
Source: ABARES Australian vegetable-growing farms survey
Note: All dollar amounts are in 2018–19 dollars
Source: ABARES Australian vegetable-growing farms survey
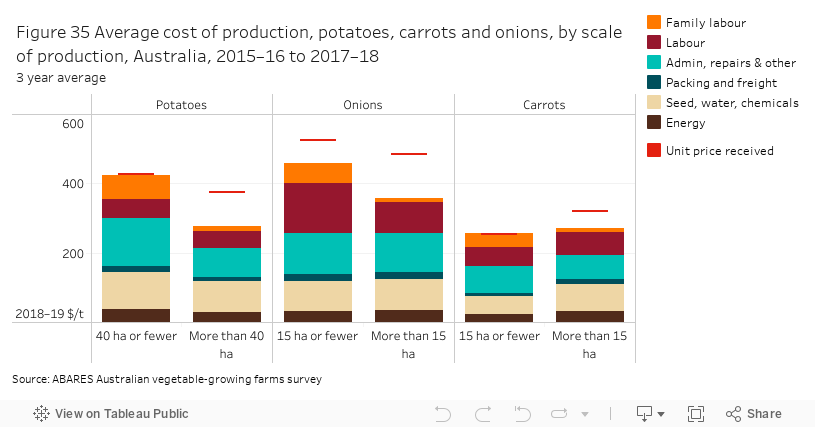

Smaller-scale growers of potatoes, onions, tomatoes, lettuce and broccoli received higher unit prices per tonne than their larger counterparts. These differences in prices per tonne may reflect differences in sale methods or the production of specialised types of these vegetables to secure a premium. Similarly, the larger producers may be growing their vegetables primarily to be processed or for bulk wholesale markets, and as such are not selling into the same markets as the smaller growers.
Labour costs per tonne were lower for larger producers for potatoes, onions, tomatoes and lettuce, and the mix of labour used varied significantly by scale of production. For all selected vegetables, farms with larger areas planted to the selected vegetable had lower family labour costs per tonne, with hired labour or contracts comprising a greater proportion of total labour costs per hectare. It is possible that this is simply due to a higher scale of production requiring more labour than a family can provide or it could be attributed to the higher scale of production making it more appealing to hire contractors or to have permanent staff.
On average, lettuce and broccoli farms in the smaller-size category reported negative margins when family labour is included. However, when whole-farm financial performance is averaged for the three years from 2015–16 to 2017–18, farms in both size categories reported positive average farm cash incomes. Similarly, average farm business profit was positive for all farm sizes and all selected vegetables.
Markets and value adding
- In 2017–18, nearly one-half of all vegetable growers sold their produce to a wholesale vegetable market.
- Very large vegetable-growing farms were more likely to export their produce than smaller vegetable growers.
- An estimated 56% of vegetable-growing farms engaged in some level of value adding to their produce in 2017–18, but only 9% of growers regarded the extent of their value adding to be high.
Detailed markets and value adding
Vegetable growers have a range of options for selling their products and marketing is an important factor in determining the financial success of many vegetable-growing farms. Vegetables can be marketed directly by vegetable producers to consumers, or indirectly through other means such as wholesalers, brokers, processors, packing facilities or buyers for retail outlets.
Selling direct to the consumer, such as at farmers’ markets, has the lowest costs and lowest number of constraints. Another option is selling to restaurants and other food service providers. Typically, the volume of product sold is lower, demand may fluctuate more frequently, and more time needs to be spent on marketing and distribution.
Selling direct to retailers cuts out third parties and may be based on a contracted price that provides surety of income. This usually means also having to meet more exacting standards in quality and packaging, higher volume to service all retailers’ outlets, and continuity of supply.
Wholesale markets exist in all capital cities of Australia with most growers supplying an agent to market the product for them. Some agents specialise in certain crops or regions and have differing requirements for payments, quality assurance, packaging, and freight.
Selling product to processors typically attracts lower but more stable prices than achieved in fresh markets. However the number of processors operating in Australia has declined over the past decade.
In 2017–18, more than half of all vegetable growers sold their produce to a wholesale vegetable market in their state (Figure 37). This was the most common selling method in all states except Tasmania, where the majority of vegetable producers sold their produce direct to processors (Table 26). South Australia, Victoria and Western Australia also had a relatively high proportion selling vegetables direct to processors.
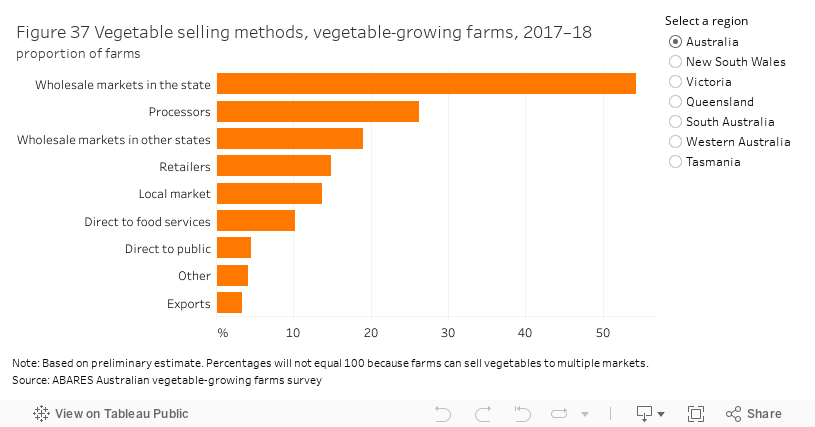
Note: Based on preliminary estimates. Columns will not sum to 100 because farms can sell vegetables to multiple markets.
Source: ABARES Australian vegetable-growing farms survey
The most common selling method for vegetable growers across all size categories was selling produce to a wholesale market in their state. Very large vegetable-growing farms with more than 70 hectares planted to vegetables were more likely to export their produce than smaller vegetable growers. However, larger farms were less likely to sell directly at the local markets. Vegetable-growing farms with more than 5 hectares planted to vegetables also had a relatively high proportion selling vegetables direct to processors.
Selling direct to retailers
In 2017–18, vegetable-growing farms that received more than 50% of their total vegetable receipts by selling directly to retailers (such as Coles or Woolworths) were mostly small farms, around 57% of them planting less than 5 hectares of vegetables. These small farms accounted for 22% of the gross value of vegetable production. An estimated 18% of the farms selling directly retailers were very large farms planting more than 70 hectares of vegetables and these farms accounted for 57% of the gross value of vegetable production. More than half of these farms selling directly to retailers were located in Queensland. The average area planted to vegetables by these farms was around 125 hectares per farm. These vegetable-growing farms earned substantially larger cash incomes (average around $1.6 million per farm) compared to farms selling to other markets. These farms had more intense vegetable producing operations with high levels of capital investments and very high rates of return (Table 27).
Note: Based on preliminary estimates. Includes vegetable-growing farms that received more than 50% of their total vegetable receipts by selling their produce to these markets. a Excluding capital appreciation.
Source: ABARES Australian vegetable-growing farms survey
Selling to wholesale markets
Vegetable-growing farms that received more than 50% of their total vegetable receipts by selling to wholesale markets (in their state or in other states) were mostly small farmers with mainly outdoor vegetable operations. Around 40% of these farms planted fewer than 5 hectares of vegetables. These small farms accounted for only 9% of the gross value of vegetable production. An estimated 11% of the farms selling directly to wholesale markets were very large farms planting more than 70 hectares of vegetables and these farms accounted for 60% of the gross value of production. The average area planted to vegetables by these farms was around 33 hectares per farm. The average farm cash income of vegetable-growing farms selling mostly to wholesale markets was $249,200 per farm in 2017–18.
Selling direct to processors
Vegetable-growing farms that received more than 50% of their total vegetable receipts by selling directly to processors were mostly medium sized farms, with mainly outdoor vegetable operations. Around one-half of these farms planted 5 to 20 hectares of vegetables and accounted for 9% of the gross value of vegetable production. Another one-quarter planted around 20 to 70 hectares of vegetables and accounted for 17% of the gross value of vegetable production. The average area planted to vegetables by these farms was around 48 hectares per farm. The average farm cash income of vegetable-growing farms selling mostly to food processors was $197,200 per farm in 2017–18.
Selling direct to local markets
Vegetable-growing farms that received more than 50% of their total vegetable receipts by selling directly to the public (including selling to local markets, farmers’ markets and food services sector) were mostly smaller farms, with nearly one-third of them planting fewer than 5 hectares of vegetables and another one-third planting around 20 to 70 hectares of vegetables. These farms together accounted for 26% of the gross value of vegetable production. Most of these farms were mainly outdoor vegetable operations that recorded lower than average rates of return. The average area planted to vegetables by these farms was around 22 hectares per farm. A majority of these farms were located in Victoria (around 43%).
Relationship with main buyer
An estimated 89% of all vegetable-growing farms rated their relationship with their main buyer as being excellent or good. More than 80% of vegetable-growing farms in each state had an excellent or good relationship with their main buyer except Western Australia where around 74% of vegetable-growing farms indicated this level of relationship.
Value adding
Value adding includes a wide range of activities, including pre-packaging, pre-processing or pre-prepared meals in response to changing consumer habits. Value adding involves strategies of assessing end user needs and meeting these demands by developing new products, identifying niche markets, or responding to product trends.
An estimated 56 per cent of vegetable-growing farms engaged in some level of value adding to their produce in 2017–18. However, only 9% of vegetable growers regarded the extent of their value adding to be high or very high. The proportion of vegetable-growing farms undertaking value adding varied by state. Only around 15% of vegetable-growing farms in Tasmania undertook value adding compared to 86% in South Australia. A higher proportion of farms receiving more than 50% of their total vegetable receipts by selling directly to retailers engaged in some form of value adding compared to other producers in 2017–18.
In 2017–18, only 11% of vegetable-growing farms indicated an intention to undertake more value adding activities on their farms in the future compared to one-quarter of farms in 2007–08. The proportion of vegetable growing farms with intentions of undertaking value adding also varied by state with a higher proportion of Western Australian vegetable-growing farms expecting to do more value adding compared to other states.
An estimated 93% of vegetable-growing farms that received more than 50% of their total vegetable receipts by selling directly to retailers engaged in some level of value adding to their produce in 2017–18 and 16% of these farms indicated their intention to undertake further value adding in the future.
More than half of vegetable-growing farms that received more than 50% of their total vegetable receipts by selling directly to food processors or at a local market did not engage in some level of value adding to their produce in 2017–18.
Irrigation and production management
- In 2017–18, around one-third of Australian vegetable-growing farms indicated their intention to increase irrigation water use in the future, primarily by purchasing additional water entitlements.
- Around two-thirds of vegetable growers conduct food safety assessments of irrigation water, test produce for chemical residues and have a food safety program in place.
- Nearly all vegetable growers have a pest and disease monitoring program.
Detailed irrigation and production management
Irrigation
Irrigation water is an important input to vegetable production and many farms are highly reliant on irrigation. An estimated 97% of vegetable-growing farms used irrigation water in 2017–18.
In 2017–18, an average of 47 hectares of vegetable crops was irrigated per farm, ranging from 26 hectares in Tasmania to 65 hectares in Victoria. The average volume of water used was 172 megalitres per farm at an average water application rate of 3.6 megalitres per hectare of vegetables planted (Table 28).
Water use by vegetable-growing farms differs in each state, reflecting irrigation systems used, the main crops grown, differences in soil type and rainfall received during the growing season. Water application rates were lowest in Queensland in 2017–18. Vegetable-growing farms in South Australia recorded the highest water application rate in 2017–18.
Note: Based on preliminary estimates.
Source: ABARES Australian vegetable-growing farms survey
Irrigation by crop
In 2017–18, lettuce was the main crop irrigated by area irrigated (Table 29), while Asian vegetables had the highest water application rate (6.8 megalitres per hectare). Tomatoes and onions also had higher water application rates in 2017–18. Green peas had the lowest rate (1.7 megalitres per hectare) in 2017–18.
Pumpkins had the highest rate of irrigation water used per tonne of output produced (4.7 megalitres per hectare) in 2017–18. Cabbages had the lowest rate of irrigation water used per tonne of output produced (0.06 megalitres per hectare).
Note: Based on preliminary estimates.
Source: ABARES Australian vegetable-growing farms survey
Future intentions
In 2017–18 around one-third of Australian vegetable-growing farms indicated their intention to increase irrigation water use in the future, primarily by purchasing additional water entitlements (Table 30). Around 60% of these farms were smaller farms growing less than 20 hectares of vegetables (Table 31). The average area of irrigated vegetables for vegetable-growing farms that expressed their intention to increase use of irrigation water was around 86 hectares per farm in 2017–18. On average, vegetable-growing farms with an intention to increase irrigation water recorded higher farm cash incomes, high levels of capital investment and higher rates of return compared to farms with no intention to increase irrigation water. An estimated 66% of vegetable-growing farms expressed no intention to increase use of irrigation water. Most of these were smaller farms growing fewer than 20 hectares of vegetables.
Note: Based on preliminary estimates. a subset of farms intending to increase irrigation water. Total will not add to 100 because farms can use more than one source of additional water.
Source: ABARES Australian vegetable-growing farms survey
Note: Based on preliminary estimates. a subset of farms intending to increase irrigation water. Total will not add to 100 because farms can use more than one sources of additional water. na not applicable.
Source: ABARES Australian vegetable-growing farms survey
The average area of irrigated vegetables for vegetable-growing farms that expressed no intention to increase use of irrigation water was around 28 hectares per farm in 2017–18. Water application rates of these farms were only slightly lower (3.5 megalitres per hectare) than farms that intended to increase future use of irrigation water (3.7 megalitres per hectare).
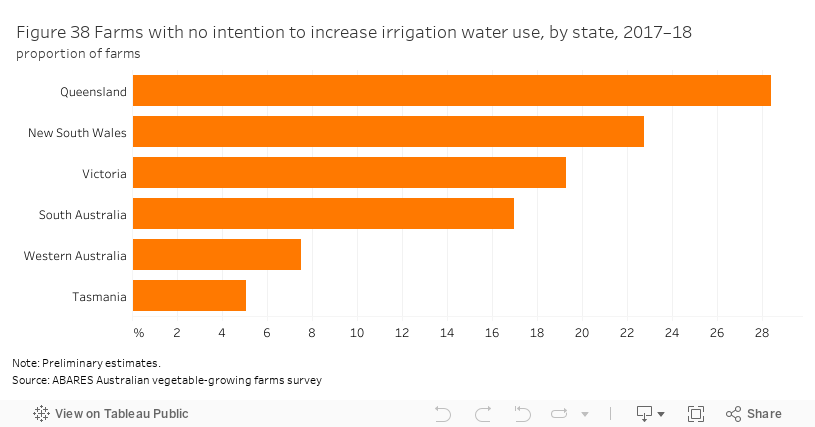
Of the vegetable-growing farms that expressed no intention to increase use of irrigation water more than half were located in New South Wales and Queensland (Figure 38). Only 5% of these farms were in Tasmania. All Tasmanian vegetable-growing farms that expressed no intention to increase use of irrigation water were larger farms growing more than 20 hectares of vegetables.
Production management
There are a number of food safety concerns in terms of microbiological, chemical or physical hazards associated with producing fresh vegetables on farm at any stage of production. Maintaining good agricultural practices and farm hygiene is vital to minimise food contamination and retain consumer confidence.
In addition to irrigation, water use in vegetable production includes applications of pesticides and fertilizers, and post-harvest uses including produce rinsing, cooling, waxing, and transport. Concern about the quality of water used to grow fresh produce is directly related to the concern about the foodborne illness risks it may present. An estimated 61% of Australian vegetable-growing farms in 2017–18 undertook a food safety assessment of their water source (Table 32). A lower proportion of vegetable growers in New South Wales conducted a risk assessment of their farm’s water source (38%) than in other states.
Note: Based on preliminary estimates.
Source: ABARES Australian vegetable-growing farms survey
Around two-thirds of Australian vegetable-growing farms in 2017–18 tested their produce for chemical residues (Table 32). The proportion of vegetable growers who tested crops for chemical residues varied between states, with only an estimated 33% of vegetable-growing farms in New South Wales conducting such a test, compared with 87% in Victoria.
An estimated 74% of vegetable-growing farms already have food safety schemes (Table 32) such as Freshcare, Woolworths Quality Assured, Coles Quality Assured, Hazard Analysis and Critical Control Points (HACCP) or other farm specific food safety programs in place. Only 65% of vegetable growers in New South Wales have a food safety program in place, compared with 85% in Victoria.
An environmental management plan is important to integrate environmental considerations and requirements into day-to-day management and long-term planning for a farm to improve environmental and economic performance. However, only 45% of all vegetable-growing farms were implementing, or were considering having, an environmental management program in place (Table 32). However, around two-thirds of vegetable-growing farms in Queensland implemented, or were considering having, an environmental management program in place.
A greater proportion of large vegetable-growing farms undertook production management activities to monitor food safety compared to smaller vegetable growers (Table 33). An estimated 84% of large vegetable-growing farms conducted a food safety assessment of the farm’s water source, compared with 57% of vegetable-growing farms with less than 5 hectares of vegetables sown. Around 89% of large vegetable-growing farms tested produce for chemical residues, compared with 49% of vegetable-growing farms with less than 5 hectares of vegetables sown. However, less than one-half of large vegetable-growing farms had an environmental management plan for their property.
Note: Based on preliminary estimates.
Source: ABARES Australian vegetable-growing farms survey
On average, vegetable-growing farms undertaking food safety assessment of their water source were higher performing farms with higher average farm cash incomes, capital invested and higher rates of return. This was also the case for vegetable growers who test their produce for chemical residues, having food safety programs in place and implementing environmental management programs on their property.
Presence of pests and diseases can significantly reduce crop yields, quality and subsequent incomes if not properly managed. As a result, most vegetable growers were concerned about pests and diseases, with an estimated 96% of vegetable-growing farms having a pest and disease monitoring program in place (Table 32). Of the farms with a pest and disease monitoring program in place, around 98% routinely conducted pest and disease monitoring. The rest of the farms conducted intermittent or occasional surveillance of pests and diseases. All vegetable-growing farms with a pest and disease monitoring program in place in, South Australia and Western Australia conducted routine pest and disease monitoring.
A higher proportion of large farms (planting more than 20 hectares of vegetables) undertook production management precautions in 2017–18—that is, conducting a food safety assessment of the farm's water source, testing produce for chemical residues, having a food safety program in place, having an environmental management program (Table 34). On average, these farms were better performers with higher average farm cash incomes and rates of return.
Note: Based on preliminary estimates.
Source: ABARES Australian vegetable-growing farms survey
Vegetable production methods
On average around 90% of vegetable receipts per farm in 2017–18 came from vegetables grown outdoors. Receipts from vegetables grown hydroponically contributed 7% to total vegetable receipts and vegetables grown under cover contributed the remaining 2% to total vegetable receipts. Around 90% of vegetable receipts in 2017–18 came from vegetables grown outdoors in all states except in South Australia. Only 81% of vegetable receipts were from outdoor operations in South Australia.
In 2017–18, an estimated 15% of vegetable-growing farms produced vegetables under cover and, on average, 58% of their vegetable revenue came from vegetables grown under cover. An estimated 10% of vegetable-growing farms produced vegetables hydroponically and, on average, 89% of their vegetable revenue came from vegetables grown hydroponically.
Farms growing vegetables using hydroponics operated a smaller average land size and had a smaller area planted to vegetable crops compared to farms growing vegetables under protection or outdoors (Table 35). A range of vegetable types are grown hydroponically, however tomatoes (66%) and cucumbers (13%) mainly contributed to total hydroponic vegetable receipts. The average estimated rate of return (excluding capital appreciation) achieved by farms using hydroponic production was higher than farms using other covered or outdoor production.
The average price received for vegetables grown under cover or hydroponically was around five to six times that received by farms that grew vegetables outdoors. However, as a result of the larger scale of production (area planted to vegetables and quantity of vegetables produced), vegetable-growing farms with outdoor operations contributed to 84% of total vegetable receipts in 2017–18. Despite receiving higher prices for their produce, farms that produced under cover or hydroponically contributed only 16% of total vegetable receipts in 2017–18.
Note: Based on preliminary estimates.
Source: ABARES Australian vegetable-growing farms survey
Vegetable-growing farms using hydroponics or other covered production also had fewer non-vegetable farm enterprises in 2017–18, with an average of 96% of receipts from the sale of vegetables, compared with an average of 86% for vegetable-growing farms with outdoor operations.
Capsicum and tomatoes mainly contributed to vegetable receipts of vegetable-growing under cover in 2017–18. Potatoes, carrots and lettuce were the main contributors to vegetable receipts of vegetable-growing farms with outdoor operations.
Training, technology, R&D and opportunities
- More than one-half of vegetable growers used field days as a source of education and training, while around one-fifth attended conferences, workshops or short courses.
- A majority of vegetable growers used information and communications technology to obtain meteorological information (54%), to manage their financial affairs (51%) and to obtain market information (50%).
- Around one-third of vegetable growers perceived climate suitability, a lack of knowledge or experience with growing particular crops and marketing those products, or water availability as constraints to change their current cropping mix.
Detailed training, technology, R&D and opportunities
Training and business management
Training and education is an important input for human resource development. Improved technical and farm management skills can generate substantial returns when organisations employ the new skills and knowledge productively. Around 70% of vegetable-growing farmers were involved in some kind of training and education related activity to improve their farm management and technical skills in 2017–2018.
Attending demonstration sites or field days was the most popular training choice among vegetable-growing farms during this period. An estimated 59% of vegetable growers attended field days to improve their farm management and technical skills in 2017–18 (Table 36). Of these vegetable growers, around 84% spent 1 to 2 days attending field days, while only 6% spent 5 days or more at field demonstrations.
Note: Based on preliminary estimates. Columns may not sum to 100 because farms can attend multiple categories of training activities.
Source: ABARES Australian vegetable-growing farms survey
Around 22% of vegetable-growing farms attended workshops and around 20% attended conferences. Around 7% of vegetable growers attended other activities like agronomist visits and discussions with input suppliers such as seedling, fertiliser and chemical providers. A higher proportion of larger vegetable growers attended training activities compared with smaller vegetable growers.
Business management is important to ensure efficient performance of all sections in an agricultural business by managing farms’ resources to meet the challenges of varying costs, process and climatic conditions. Around 8% of vegetable-growing farms did not engage in any business management and general administration related tasks in the month prior to the Australian vegetable-growing farms survey conducted from February to May 2018. A majority of farms engaged in less than 50 hours of administration related activities during the period (Table 37). Farms engaging in business management and general administration related tasks spent on average 34 hours per month on those activities in 2017–18.
Note: Based on preliminary estimates. Row and column totals may not sum to 100 due to rounding.
Source: ABARES Australian vegetable-growing farms survey
Business management and general administration related work was mostly done by unpaid staff including operators, family members and other partners in 2017–18. A majority of paid staff (83%) were not involved in any of the business management and general administration tasks. However, paid staff of farms earning more than $2 million total cash receipts spent more time on business management and general administration related tasks compared with unpaid staff. Western Australian vegetable growing farms staff spent more time on business management and general administration related work compared to other states.
Technology
Information and communications technology (ICT) increases the communication and business opportunities for the agricultural community. These technologies increase the amount of information farmers can process, from details on day-to-day operations to the latest research that contribute to the advancement of agriculture. It also allows farmers to research alternative management decisions.
Most vegetable growers used computers/internet and related technologies to run their businesses in 2017–18 (93%). Its major uses were to assist vegetable-growing farmers to obtain meteorological information (57%), to manage their financial affairs (53%) and to obtain market information (48%) (Table 38). A higher proportion of farms in Queensland, Western Australia and Tasmania used ICT to assist them with industry linkages. An estimated 22% of farms used ICT for other purposes such as to operate automated irrigation systems, record keeping, direct sales, and to use social media to promote their business.
Note: Based on preliminary estimates. Columns may not sum to 100 because farms can elect multiple categories of uses.
Source: ABARES Australian vegetable-growing farms survey
Fewer smaller vegetable-growing farms planting less than 20 hectares of vegetables used computers and related technologies, such as GPS in assisting vegetable production activities like preparing, planting and harvesting (Table 39). Larger farms generally have greater financial capacity to undertake the capital investments required to implement production related ICT.
Note: Based on preliminary estimates. Columns may not sum to 100 because farms can select multiple categories of uses.
Source: ABARES Australian vegetable-growing farms survey
Research and development
Research and development is essential for the ongoing growth and improvement in productivity, profitability, competitiveness and sustainability of vegetable-growing farms. Research on pest and disease management was most commonly identified as important for vegetable growers in 2017–18. An estimated 92% of vegetable-growing farms indicated it was a high priority (Table 40). Focus on higher-yielding varieties of vegetables (88%) and farm productivity (75%) were also identified as high priority research areas.
Note: Based on preliminary estimates. The proportions are the proportion of farms indicating each research and development area as very high or high priority.
Source: ABARES Australian vegetable-growing farms survey
In 2017–18, almost all large vegetable growers indicated research on higher-yielding varieties was the most important research area to benefit their business. Around 97% of all large vegetable growers placed very high or high priority for research on pest and disease management. Pest and disease management was the research and development priority most commonly identified as important for small vegetable growers. More than one-half of small farms and around two-thirds of larger growers indicated that environmental sustainability research was important for their business.
An estimated 28% of vegetable growers believe they were already as productive as possible (Table 41). However, 33% of vegetable growers revealed introducing higher-yielding vegetable varieties as one way of increasing productivity on their farm. The next highest response was a need to introduce or expand their use of technology (29%). An estimated 19% of vegetable growers stated other practices such as introducing disease or insect resistant varieties and specialised staff training as ways to improve productivity.
Note: Based on preliminary estimates. Columns may not sum to 100 because farms can select multiple categories of management practices.
Source: ABARES Australian vegetable-growing farms survey
Around one-third of vegetable-growing farms operating with less than 5 hectares of vegetables planted believed there was nothing they could do to improve farm productivity (Table 42). However, 28% of small vegetable-growing farms believed increasing the scale of operations would improve farm productivity. Only 12% of large vegetable-growing farms operating more than 70 hectares of vegetables believed there was nothing they could do to improve farm productivity. An estimated 59% of large vegetable-growing farms operating more than 70 hectares of vegetables believed introducing higher-yielding varieties and around 53% thought introducing or expanding the use of technology was a way to improve the productivity of their farms.
Note: Based on preliminary estimates. Columns may not sum to 100 because farms can select multiple categories of management practices.
Source: ABARES Australian vegetable-growing farms survey
Growth opportunities
The Australian vegetable industry is complex, diverse and spread over a wide range of geographic locations. These diverse conditions offer a variety of opportunities for vegetable-growing farms as well as challenges now and in the future.
Producing high quality produce and niche products were identified as growth opportunities most often by survey participants in 2017–18 (Table 43). Although 15% of farms perceived exports as an opportunity for growth, only 3% of farms indicated that they sold their produce to export markets in 2017–18 (Figure 37). Around 21% of Australian vegetable growers perceived other growth opportunities such as diversifying their product mix, accessing new markets like selling directly to the public and vertical integration.
Note: Based on preliminary estimates. Columns may not sum to 100 because multiple responses were allowed.
Source: ABARES Australian vegetable-growing farms survey
Future intentions
At the time of the survey in 2017–18, around 68% of Australian vegetable growers intended to continue with vegetable production in five years’ time (Table 44). An estimated 11% of farms expected to change or diversify into other agricultural production in five years’ time and 18% expected to leave agriculture. Around 80% of vegetable growers in New South Wales and South Australia expected to continue vegetable production in five years’ time. In Western Australia, only 29% of vegetable-growers expected to continue vegetable production in five years’ time and many farms in the survey had already significantly scaled back their vegetable operations in 2017–18. Some of these Western Australian farms were exiting farming altogether while others were shifting their enterprise mix away from vegetables.
A higher proportion of smaller vegetable-growing farms with less than 20 hectares planted to vegetables expected to either focus on other agricultural production or leave agriculture in five years’ time compared with larger vegetable growers.
Note: Based on preliminary estimates.
Source: ABARES Australian vegetable-growing farms survey
On average, vegetable growers indicating an intention to continue vegetable production in five years were larger and more profitable in 2017–18 than farms intending to change to other agricultural production or leave agriculture (Table 45).
Note: Based on preliminary estimates.
Source: ABARES Australian vegetable-growing farms survey
An estimated 24% of vegetable-growing farms intended to expand vegetable production in the next three to five years (Figure 39). Of those farms, the most common method of expansion was to set-up additional vegetable-growing plots using existing farming area (Table 46).
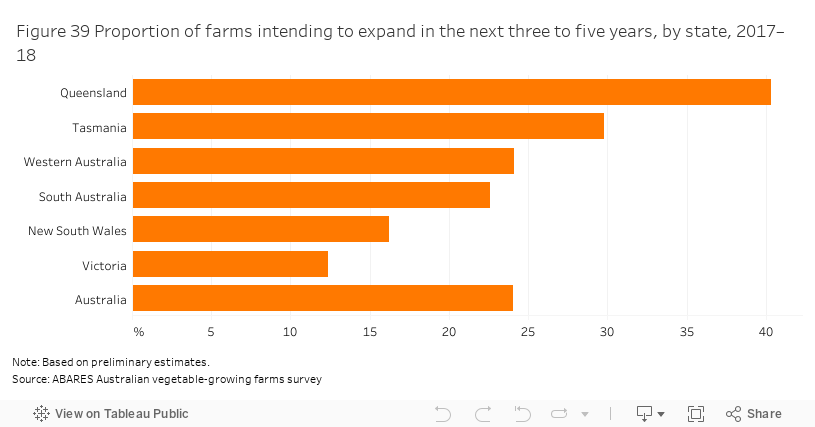
Note: Based on preliminary estimates. These proportions are of the farms intending to expand vegetable production. Columns may not sum to 100 because multiple responses were allowed.
Source: ABARES Australian vegetable-growing farms survey
Purchasing or leasing more land were the main methods of expansion by vegetable-growing farms in Tasmania, Western Australia and Victoria intending to expand vegetable production in the next three to five years (Table 46).
Around 37% of large vegetable-growing farms with more than 70 hectares planted to vegetables intended to expand vegetable production in the next three to five years. The most common method of expansion was purchasing more land. An estimated 30% of small vegetable-growing farms with less than 5 hectares planted to vegetables intended to expand vegetable production in the next three to five years mainly by setting-up additional vegetable-growing plots using existing farming area.
Constraints
In 2017–18, an estimated 98% of vegetable-growing farms indicated that they would face one or more constraints if they were to change their current crop mix. Climate suitability and a lack of knowledge or experience with growing particular crops were the most common constraints (Table 47). Vegetable-growing farms in Tasmania identified soil type as the major constraint if they were to change crop mix. Water availability was the most constraining factor for Western Australian vegetable-growing farms followed by knowledge or experience with marketing products. Around 19% of vegetable-growing farms indicated other constraints such as lack of investment to change technology and infrastructure to suit the desired cropping mix.
Note: Based on preliminary estimates. Columns may not sum to 100 because multiple responses were allowed.
Source: ABARES Australian vegetable-growing farms survey
Only around 9% of vegetable growers saw no impediments to developing export markets (Table 48). Around 56% of vegetable growers considered promoting exports was too difficult or time consuming. No developed markets and low prices for exported vegetables were also seen as major obstacles to developing export markets.
Note: Based on preliminary estimates. Columns may not sum to 100 because multiple responses were allowed.
Source: ABARES Australian vegetable-growing farms survey
Vegetable-growing farms generally agree on the major factors threatening the viability of their farms, regardless of their geographic location and size of the business. Increased farm input costs (such as water, fuel and fertiliser) was reported by around 70% of growers as a barrier to future viability of vegetable farms in 2017–18 (Table 49). An estimated 47% of vegetable growers reported increased marketing costs as a risk to business viability, while around 24% of vegetable growers reported other concerns such as biosecurity issues, supermarket domination and climate change and frequent adverse weather conditions as risks.
Note: Based on preliminary estimates. Columns may not sum to 100 because multiple responses were allowed.
Source: ABARES Australian vegetable-growing farms survey
Lower prices was seen as the major threat to business viability by Western Australian vegetable-growing farms. A higher proportion of Queensland vegetable-growing farms indicated the cost of labour as a major threat to business viability compared with growers in other states. A higher proportion of vegetable-growing farms in New South Wales and South Australia considered urban expansion as a barrier to viability compared with vegetable growers in other states.
Smaller vegetable-growing farms with less than 5 hectares planted to vegetables also considered urban expansion as a major threat to their viability. Availability of irrigation water and increased cost of labour are other factors that large vegetable-growing farms considered as barriers to business viability.
References
ABARES 2019, Agricultural commodities: June quarter 2019, Australian Bureau of Agricultural and Resource Economics and Sciences, Canberra, accessed 26 July 2019.
ABS 2019a, Agricultural Commodities, Australia, 2017–18, cat. no. 7121.0, Australian Bureau of Statistics, Canberra, accessed 26 July 2019.
ABS 2019b, Value of agricultural commodities produced, Australia, 2017–18, cat. no. 7503.0, Australian Bureau of Statistics, Canberra, accessed 26 July 2019.
AIHW 2018, Australia's health 2018: in brief, Australian Institute of Health and Welfare, Cat. No. AUS 222, Canberra.
Agriculture 2019, Vegetables levy and charge, Department of Agriculture, Water and the Environment, accessed 7 November 2019.
Data and other resources
Key physical characteristics and financial performance data at the state level available for Australian vegetable-growing farms.
Farm surveys definitions and methods
Further information about our survey definitions and methods.
Previous reports
Australian vegetable-growing farms: an economic survey 2015-16 and 2016-17
Australian vegetable-growing farms: an economic survey 2014-15 and 2015-16
Australian vegetable growing farm businesses: an economic survey 2013-14 and 2014-15
Australian vegetable growing farms: an economic survey 2012-13 and 2013-14
Australian vegetable growing farms: an economic survey 2011-12 and 2012-13
Australian vegetable growing farms: an economic survey 2010-11 and 2011-12
Australian vegetable growing farms: an economic survey 2009-10
Australian vegetable growing farms: an economic survey 2008-09
Australian vegetable growing farms: an economic survey 2007-08
Australian vegetable growing farms: an economic survey 2006-07
Australian vegetable growing industry: an economic survey 2005-06
Cataloguing data
Frilay J, Weragoda A, Litchfield F, Thompson T & Ashton D 2019, Australian vegetable-growing farms: an economic survey, 2017–18 and 2018–19, ABARES research report 19.12, Canberra, November. CC BY 4.0.
This project is funded by Hort Innovation, using the Hort Innovation Vegetable research and development levy, and co-investment from the Department of Agriculture, Water and the Environment. Hort Innovation is the grower-owned, not-for-profit research and development corporation for Australian horticulture.