
This indicator uses the area, age class and growing stock of native and exotic species plantations to assess the volume of timber that Australia’s plantation forests can supply now and into the future.
This is the Key information for Indicator 2.1b, published July 2024.
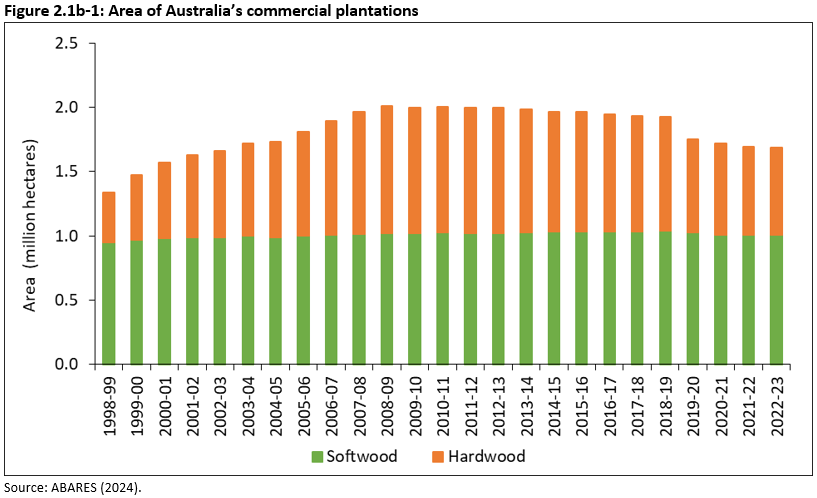
- The area of commercial plantations in Australia in 2022–23, as reported in Australian plantation statistics update 2022–23, was 1.71 million hectares, of which
- 1.01 million hectares (59%) was softwood plantation (mainly radiata pine), and
- 0.68 million hectares (40%) was hardwood plantation (mainly eucalypt species).
- 1.01 million hectares (59%) was softwood plantation (mainly radiata pine), and
- The total area of commercial plantations has been declining since 2008-09, resulting from conversion of some hardwood plantation to agriculture and other land uses, and other hardwood plantations being reclassified as non-commercial.
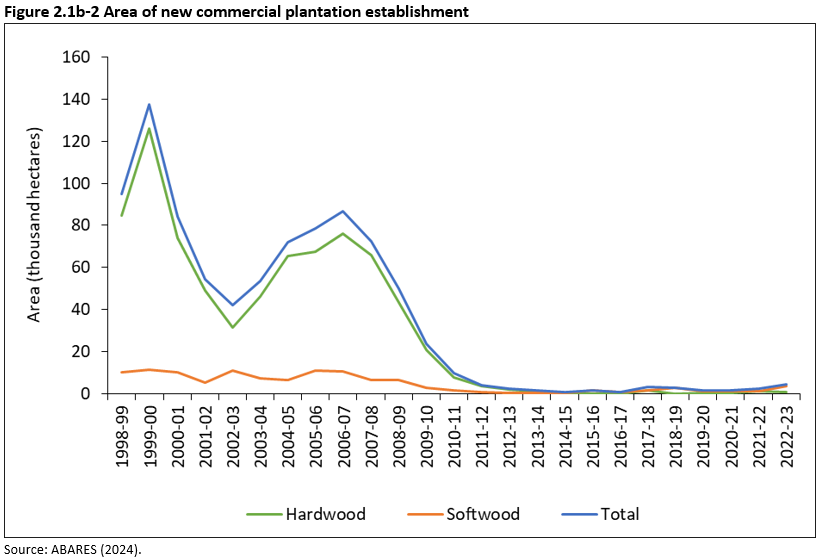
- Since 2011–12, 4,500 or fewer hectares of commercial plantations have been established annually, compared to at least 42,000 hectares annually between 1998–99 and 2008–09, driven mainly by increasing competition for land between commercial plantations and other land uses.
- By ownership structure, most commercial plantations by area (74%) are under private ownership.
Plantation forests are intensively managed stands of trees of either native or exotic species, created by the regular placement of seedlings or seeds. Commercial plantations are softwood or hardwood plantations managed for the purpose of commercial wood production (predominantly sawlogs and pulplogs) for domestic and international markets. They are usually grown over set rotations, defined as the planned number of years between establishment of a stand of trees, and final harvesting. Non-commercial plantations and other planted forests are reported in the ‘Other forest’ category. These and other terms can be found in Australia's forests and forestry glossary.
Commercial plantations are reported through the National Plantations Inventory. The first data for the National Plantations Inventory were collected in 1995, with the first comprehensive map-based report published in 1997, when Australia had 1.2 million hectares of plantations. Most commercial plantations occur within National Plantation Inventory regions, which were established to represent economic wood supply zones.
There were 1.71 million hectares of commercial plantations in Australia in 2022-23, as reported in the Australian plantation statistics update 2024. This includes:
- 1.01 million hectares of softwood plantation (59% of total commercial plantation area)
- 0.68 million hectares of hardwood plantation (40% of total commercial plantation area)
- 23 thousand hectares of plantations for which the type is unknown (1% of total commercial plantation area).
These are updated values from those reported in the vector-format spatial coverage in Australian plantation statistics and log availability report 2021, which was used to develop the rasterised (gridded) spatial coverage reported in Indicator 1.1a.i Forest area by forest type.
The 2022-23 total commercial plantation area is 13% lower than the 1.95 million hectares reported for 2016-17. The softwood plantation area remained relatively stable over the period 2016-17 to 2022-23 (Figure 2.1b-1), but the hardwood plantation area has declined year-on-year since 2008-09, with some hardwood plantation land being converted to agriculture and other land uses, and other hardwood plantations being reclassified as non-commercial.
Click here for a Microsoft Excel workbook of the data for Figure 2.1b-1.
A small area of new mostly softwood commercial plantations was established in recent years. Since 2011-12, there has been 4,500 or fewer hectares of new commercial plantations established annually, compared to at least 42,000 hectares of new plantations established annually between 1998-99 and 2008-09 (which included at least 31,000 hectares of new hardwood plantations annually) (Figure 2.1b-2). This reduction in new commercial plantation establishment has been driven, amongst other influences, by increasing competition for land between commercial plantations and other land uses.
Click here for a Microsoft Excel workbook of the data for Figure 2.1b-2.
Most (77%) of the current rotation of the existing hardwood plantation estate has been established since 2000, including 236 thousand hectares planted in 2006-10. The majority (also 77%) of the current rotation of Australia’s softwood plantation estate was planted since the 1990s, with between 120 thousand and 176 thousand hectares replanted in each five-year period since 1996 (Figure 2.1b-3).
The age-class distribution of the current rotation of Australia’s current commercial plantation estate is shown Figure 2.1b-3. The range of older age classes of the current softwood plantation estate reflects management for long-rotation sawlog production, compared to management of the current hardwood plantation estate in some parts of Australia for short-rotation pulplog production.
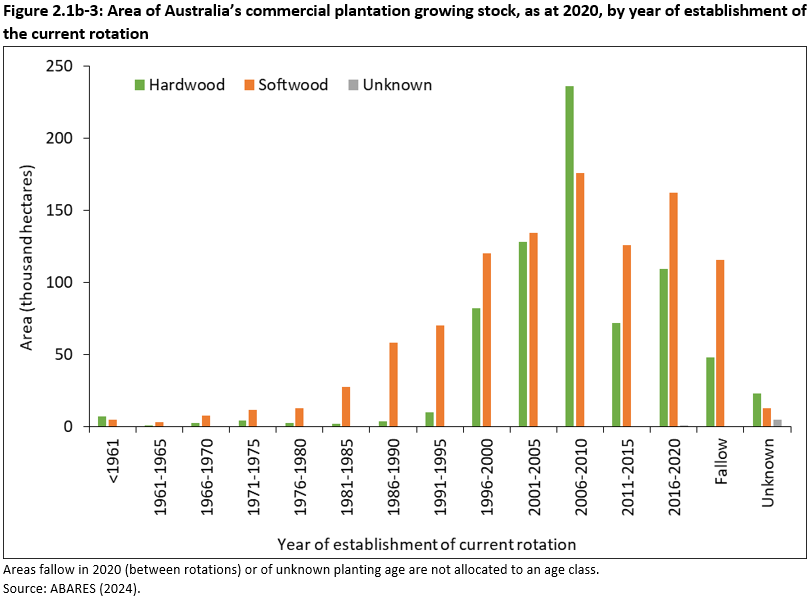
Click here for a Microsoft Excel workbook of the data for Figure 2.1b-3.
Softwood plantations
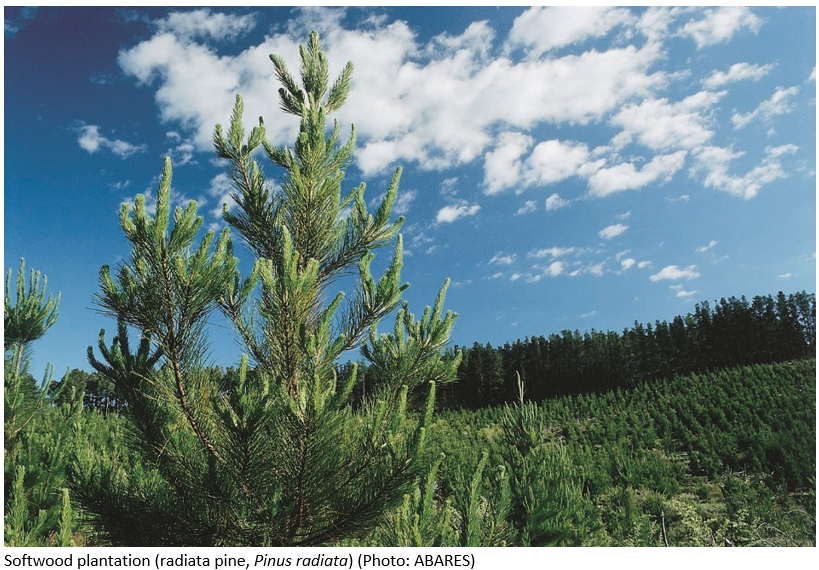
Commercial softwood plantations are mainly radiata pine (Pinus radiata) (690 thousand hectares, 68% of total commercial softwood plantation area), with areas of southern pines (hybrids of P. elliottii and P. caribaea) (140 thousand hectares, 14%), hoop pine (Araucaria cunninghamii) (42 thousand hectares, 4%) and maritime pine (P. pinaster) (31 thousand hectares, 3%), with the balance other pines, other softwoods and areas fallow (Table 2.1b-1).
Radiata pine plantations are located across south-eastern and south-western Australia, while southern pines are planted in south-east Queensland and (to a lesser extent) in northern New South Wales. Hoop pine is planted in Queensland, while maritime pine is planted in drier parts of Western Australia (Table 2.1b-1).
The majority of softwood species are managed for sawlog production on a 25-35 year rotation, while hoop pines are managed on a 45-year rotation. Areas are typically replanted with softwood species upon harvesting, sometimes following a short fallow period.
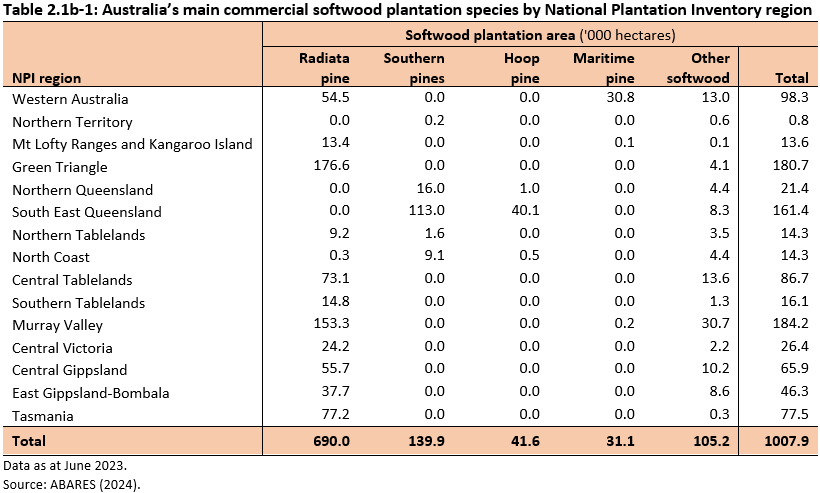
Click here for a Microsoft Excel workbook of the data for Table 2.1b-1.
Hardwood plantations
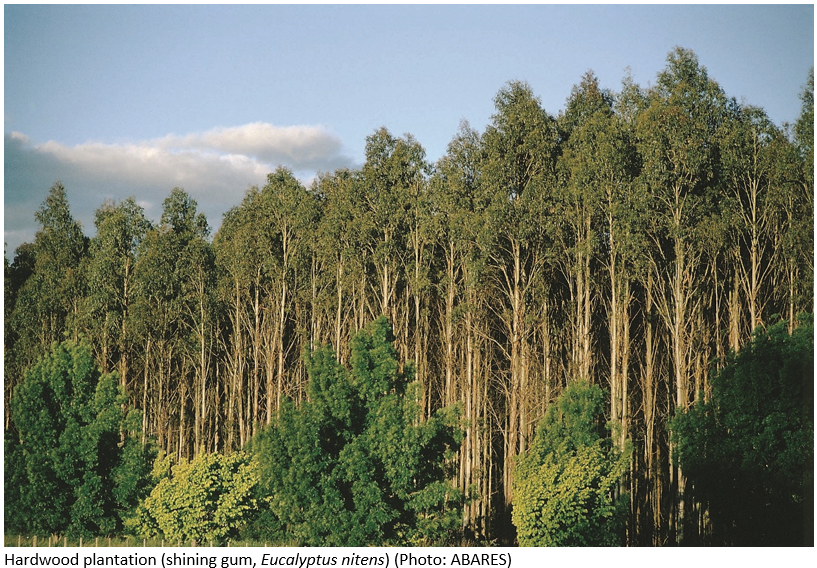
The commercial hardwood plantation estate is dominated by Tasmanian blue gum (Eucalyptus globulus) (324 thousand hectares, 48% of total commercial hardwood plantation area), and shining gum (E. nitens) (176 thousand hectares, 26%), both of which are predominantly managed for pulplog production on a 12-14 year rotation, with the balance comprising blackbutt (E. pilularis), flooded gum (E. grandis), other eucalypts and other species (Table 2.1b-2).
The largest areas of hardwood plantation are in Tasmania (190 thousand hectares, 28%), Western Australia (177 thousand hectares, 26%) and the Green Triangle area (133 thousand hectares, 20%).
Most (90%) of the shining gum plantation is in Tasmania.
Hardwood plantations managed for sawlogs represent a small proportion of the hardwood estate, and are mainly located in northern New South Wales and Tasmania. The main species planted in northern New South Wales for sawlog production are blackbutt (E. pilularis) and flooded gum (E. grandis). Hardwood plantations managed for sawlogs are managed on 25-50 year rotations.
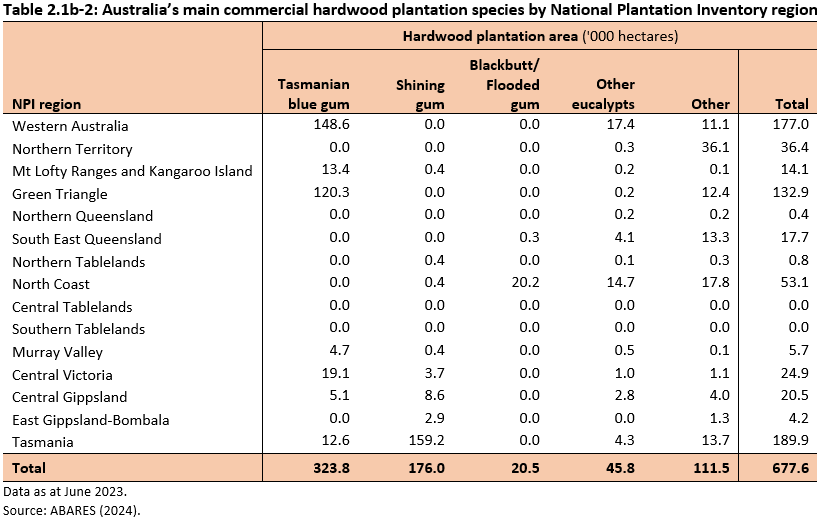
Click here for a Microsoft Excel workbook of the data for Table 2.1b-2.
Private ownership of commercial plantations has declined in area, and ownership proportion, since peaking in 2013-14. The area and proportion of publicly owned commercial plantations increased slightly over the same time (Figure 2.1b-4). The small increase since 2014-15 in the proportion of the commercial plantation estate that is publicly owned is due to conversion to agriculture or other uses of some privately owned hardwood plantations. Institutional investors, such as pension funds, have continued to own the largest proportion of commercial plantations (Figure 2.1b-5).
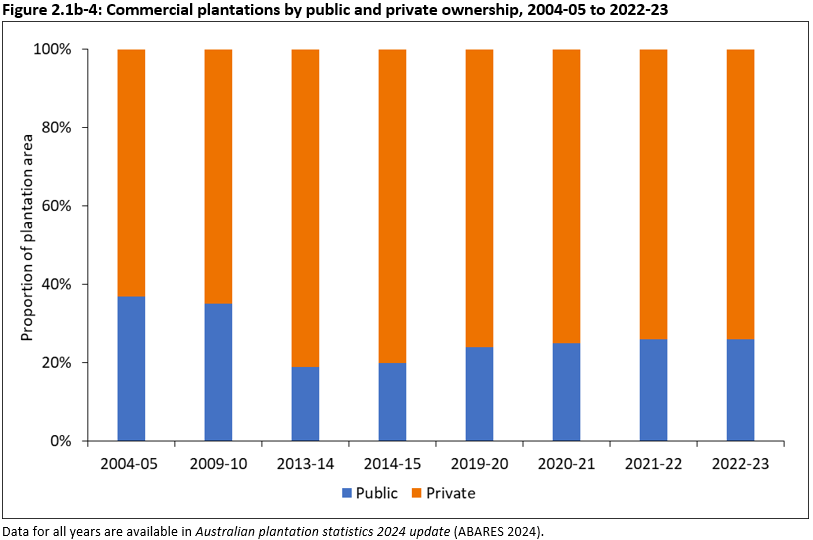
Click here for a Microsoft Excel workbook of the data for Figure 2.1b-4.
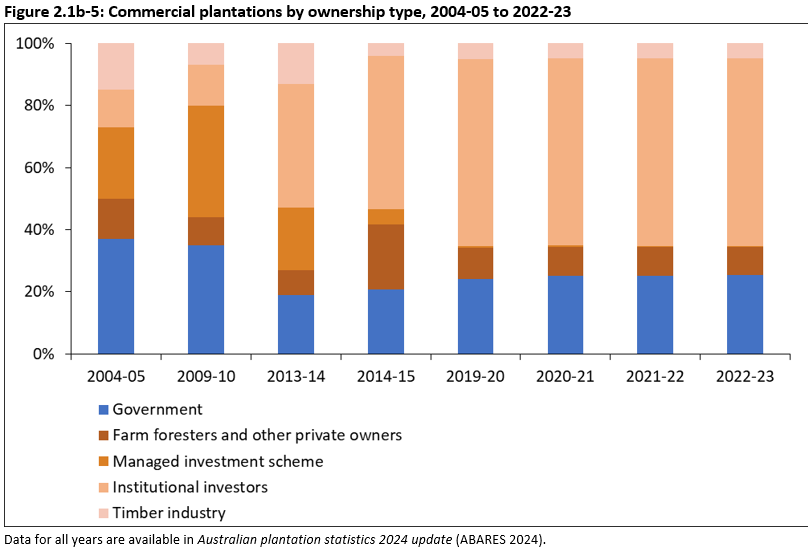
Click here for a Microsoft Excel workbook of the data for Figure 2.1b-5.
ABARES (2024). Australian plantation statistics 2022-23 update, Australian Bureau of Agricultural and Resource Economics and Sciences, Canberra, July. CC BY 4.0. doi.org/10.25814/dkcj-xy27.
Legg, P Frakes, I & Gavran, M (2021). Australian plantation statistics and log availability report 2021, ABARES research report, Australian Bureau of Agricultural and Resource Economics and Sciences, Canberra, October. CC BY 4.0. doi.org/10.25814/xj7c-p829