
This indicator measures the quantities, values and usage of non-wood products. It enables socio-economic benefits to be monitored by ascertaining trends in quantities, values and usage of non-wood products.
This is the Key information for Indicator 6.1b, published December 2025.
- Many Australian non-wood forest products are commercialised; however, production and value data are generally unavailable.
- Non-wood forest product industries are based on native species, such as sandalwood, kangaroo and crocodile, as well as introduced species, such as honeybee and feral goat. For both native and introduced species, the harvest volume and value data were derived from forest and non-forest areas.
- Honey is a major non-wood forest product. Average national honey production was 18 thousand tonnes per year between 2016–17 and 2020–21, around 5% lower than the average recorded during the 2011–12 to 2015–16 period. However, the average annual gross value increased by 74.5%, from $91 million to $159 million.
- Tea tree oil, lemon myrtle oil, wildflowers, crocodile skins, and feral goat meat are mostly exported, with export volumes sometimes exceeding 90% of total harvest. In contrast, honey and mud crab harvests are mainly for domestic consumption.
- Between 2015–16 and 2020–21, export volumes of crocodile skins, kangaroo meat, goat meat, and honey declined, while export volumes of tea tree oil, wildflowers, and kangaroo hides increased.
Australia’s non-wood forest product industries are based on products derived from both native and introduced species. They are derived from wild harvests in forests and non-forest ecosystems and some are also farmed. Some plant-based industries, such as macadamia are not discussed in this indicator because they are regarded as horticulture, rather than forest-based industries.
Many Australian non-wood forest products are commercialised and are traded both domestically and internationally. These include honey and beeswax, sandalwood, native bush foods, tea tree oil, eucalyptus oil, tree ferns, wildflowers, mud crabs, and crocodile products (MIG and NFISC 2018).
Data availability is a major barrier to providing a complete picture of the production quantities and market value of non-wood forest products at the national level. For example, data on the proportion of non-wood forest products obtained specifically from forests are not available.
Table 6.1b-1 shows non-wood products considered to have high forest dependence or to be derived from forest-dwelling species. Honey is the largest commercial output of Australia’s non-wood forest products industries.
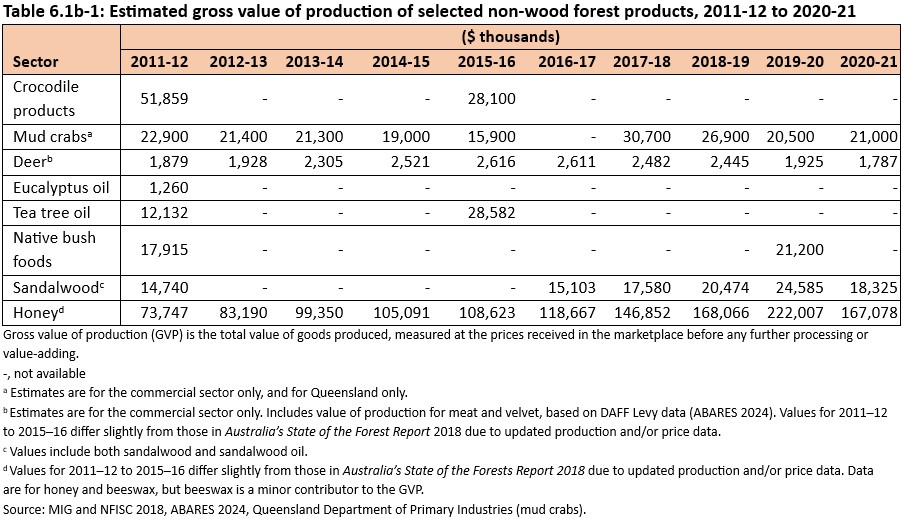
Click here for a Microsoft Excel workbook of the data for Table 6.1b-1.
Honey and other apiary products
Commercial beekeeping operations occur in all states and territories of Australia. The main products of beekeeping are honey and beeswax. The beekeeping industry also performs paid pollination services, mainly for the agriculture sector.
Honey production in Australia varies considerably between years due to variable seasonal conditions and flower availability, with much of the honey derived from forested lands. Average annual national honey production was 18 thousand tonnes between 2016–17 and 2020–21, around 5% lower than the 19 thousand tonnes produced annually during the 2011–12 to 2015–16 period (Figure 6.1b-1). Despite the lower production, the gross value increased significantly, rising by 74.5%, from an average of $91 million during 2011–12 to 2015–16 to $159 million in 2016–17 and 2020–21. This sharp rise in value was driven by supply constraints following the 2019–20 bushfires and prolonged droughts, which led to production setbacks and record-high wholesale prices (AHBIC 2022). More recent data show average annual production of around 37,000 tonnes (Clarke 2023).
Australia exports about 10% of its honey production (DAFF 2024), with key markets in North America, East and South-East Asia and the Middle East (Clarke and Le Feuvre 2021, 2024). During 2016–17 and 2020–21, Australia’s average annual honey export volume was 3.9 thousand tonnes (valued at $31.9 million per year), which was lower than the 2011–12 to 2015–16 export average annual volume and value (4.5 thousand tonnes, valued at $48 million) (Figure 6.1b-1).
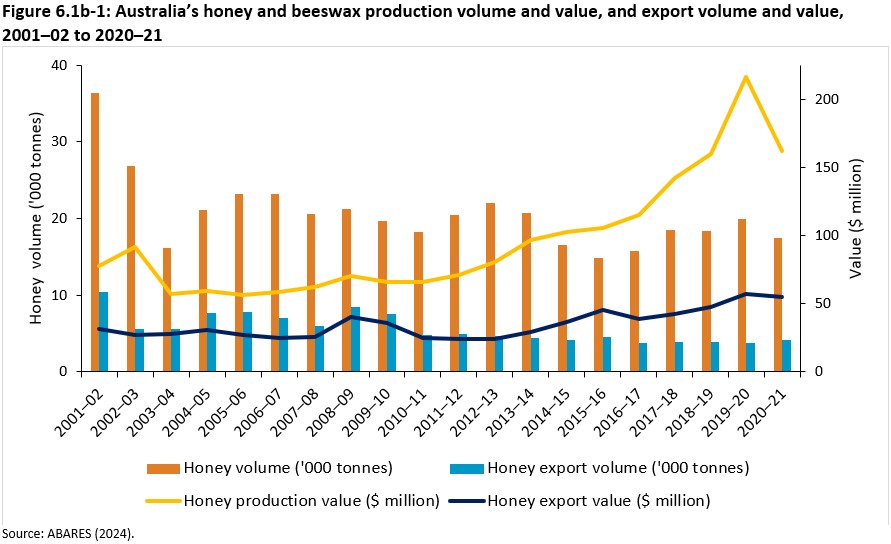
Click here for a Microsoft Excel workbook of the data for Figure 6.1b-1.
Meat, skins and other products
Crocodiles
Crocodiles are primarily harvested for the skin. Most crocodile skin production involves ranched saltwater crocodiles (Crocodylus porosus). Ranching is the commercial harvesting of eggs, hatchlings, and juveniles from the wild, which is common in the crocodile industry (CFANT and NT 2015). The ranched eggs are incubated and raised in farms along with ranched hatchlings and juveniles. Eggs, hatchlings, and juveniles are often harvested from mangrove forests and forested wetlands, including Melaleuca forest. Crocodiles are thus considered a non-wood forest product.
Australia is the largest exporter of saltwater crocodile skin, accounting for 60% of global trade (GHD 2023). The saltwater crocodile skin industry’s contribution to Australia’s economy was estimated at $54 million in 2014–15 (EY 2018).
Around 80% of saltwater crocodile skin produced is exported, mainly to France, Singapore, Italy and Japan to make high-end handbags and fashion products (Pattison et al. 2023). About two thirds of Australia’s saltwater crocodile skin production comes from the Northern Territory (GHD 2023; Pattison et al. 2023). The crocodile farming industry in Northern Territory alone was worth approximately $25 million annually in 2019–20 (DLPE 2024). For the period 2011 to 2021, the number of crocodile skins exported was highest in 2016 (59,020 skin units) and lowest in 2020 (28,531 skin units) (Figure 6.1b-2).
Other components of the crocodile industry include meat and by-products such as blood and collagen for cosmetics and nutraceuticals. Crocodile meat production was 132.3 tonnes in 2015–16 (MIG and NFISC 2018), and 300–400 tonnes per year between 2016 and 2021 (Pattison et al. 2023). The meat is predominantly sold domestically for human consumption and pet food.
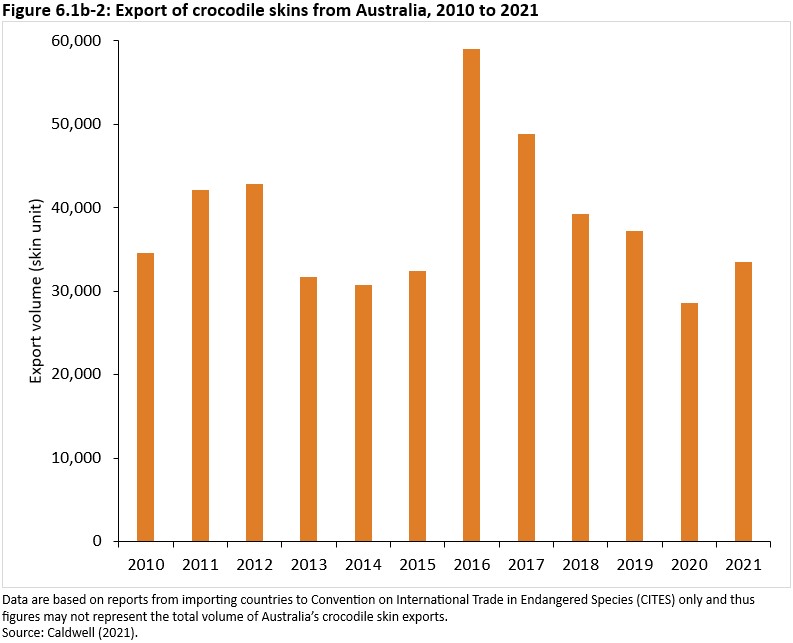
Click here for a Microsoft Excel workbook of the data for Figure 6.1b-2.
Kangaroos and other macropods
Kangaroos and wallabies are widespread native species occurring across a range of ecosystems, including forests. Commercial harvesting, including for meat export, is permitted for red kangaroo (Osphranter rufus), western grey kangaroo (M. fuliginosus), euro or common wallaroo (O. robustus), eastern grey kangaroo (M. giganteus) and tammar wallaby (M. eugenii). They can be harvested from the wild under a quota system administered by state, territory and Australian governments, based on principles of sustainability (see Indicator 2.1d).
Kangaroos are harvested for their hides, and meat for human consumption and pet food. Kangaroo hides, which includes hides, skins and leather, are the largest component of the kangaroo export industry by value. Exports of hides totalled $15.9 million in 2020–21, down from $32 million in 2015–16. The total value of exports of kangaroo products (meat and hides) fell from $88 million in 2007–08 to $35 million in 2010–11, recovered to $51 million in 2015–16, and dropped again to $22 million in 2020–21 (Figure 6.1b-3). The proportion of production volume and value from kangaroos specifically derived from forests (animals living or sheltering in forests) compared to harvests from other habitat types is not known.
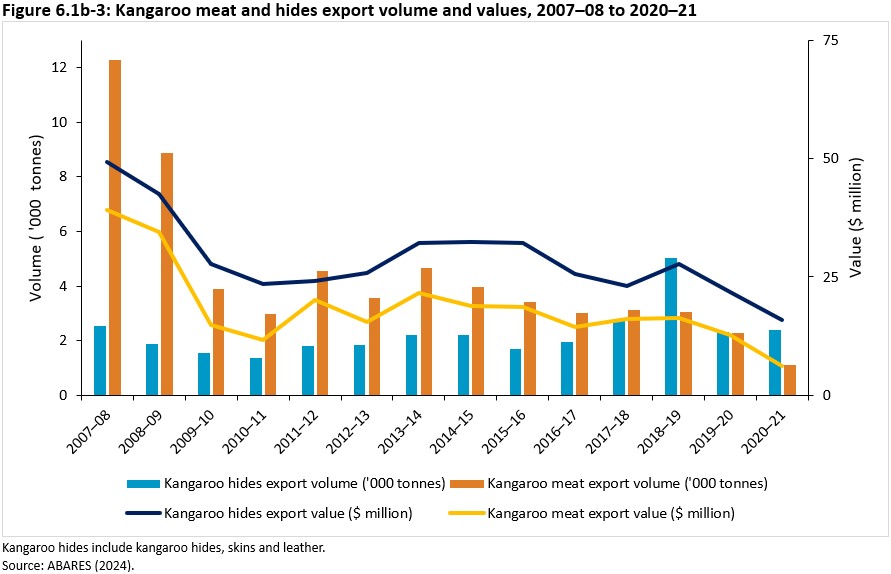
Click here for a Microsoft Excel workbook of the data for Figure 6.1b-3.
Mud crabs
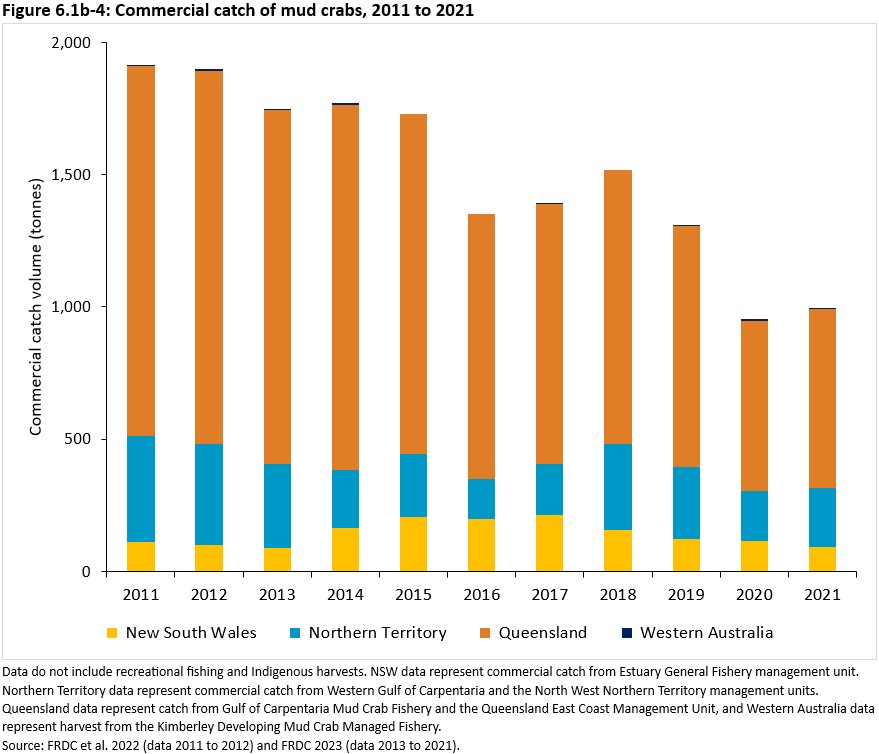
Mud crabs and nursery stock are harvested from mangrove forests. The two mud crab species found in Australia are the giant mud crab (Scylla serrata) and the orange mud crab (S. olivacea). The giant mud crab constitutes approximately 99% of the commercial catch of mud crabs in the Northern Territory and Queensland, and the entire commercial catch in New South Wales. The species composition in Western Australia is uncertain but is known to vary considerably between locations (FRDC 2023).
From 2011 to 2021, the commercial mud crab harvest fluctuated between 952 to 1,772 tonnes per year. The average annual harvest over the 2017 to 2021 period was 1,233 tonnes, which was lower compared to the 2011 to 2016 period when an average of 1,700 tonnes were harvested annually (Figure 6.1b-4). Queensland is the largest supplier of mud crabs.
With limited market pricing data it is not possible to estimate the actual gross value of production of the national mud crab fishery, however, based on an annualised price per kilogram of $35, the value would be around $38 to $50 million per year at the point of first sale (FRDC et al. 2022; FRDC 2023).
Click here for a Microsoft Excel workbook of the data for Figure 6.1b-4.
Deer
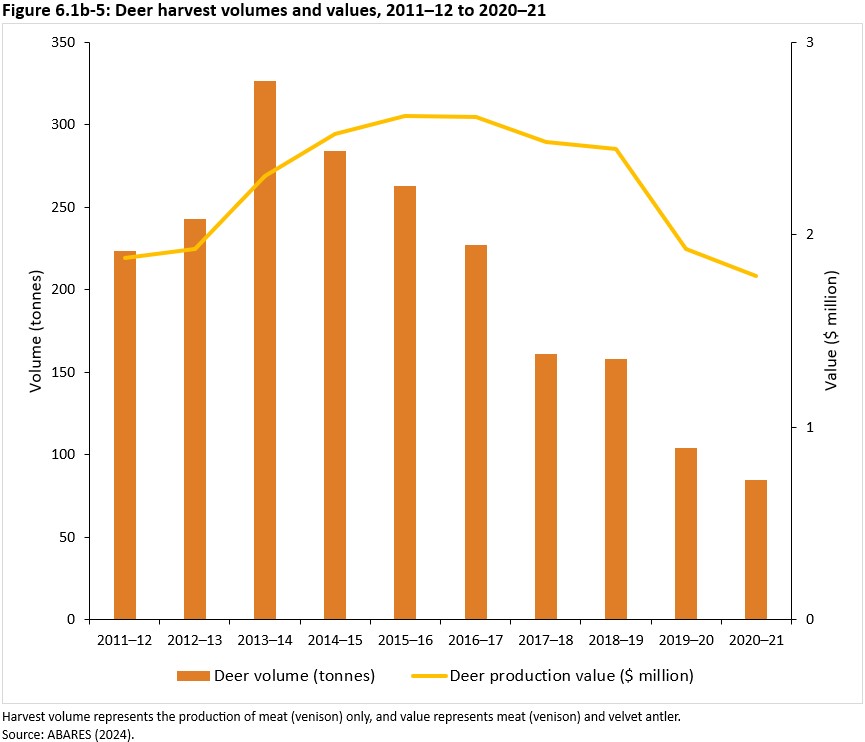
Deer are introduced species and are widespread in parts of Queensland, South Australia, Tasmania, Victoria, and New South Wales. They are less common in the Northern Territory and Western Australia (Davis et al. 2016).
The main products from deer are venison (meat) and velvet antlers. Both wild and farmed deer venison are sold through licenced abattoirs. Production of deer meat declined from 227 tonnes in 2016–17 to 85 tonnes in 2020–21. The gross value of production also declined from $2.6 million in 2016–17 to $1.8 million in 2020–21 (Figure 6.1b-5). Between 2016–17 and 2020–21, the average annual harvest volume of deer was 147 tonnes, down from 268 tonnes in the previous reporting period (2011–12 to 2015 –16). The average gross value of production remained stable across both reporting periods at $2.3 million annually.
Click here for a Microsoft Excel workbook of the data for Figure 6.1b-5.
Goats
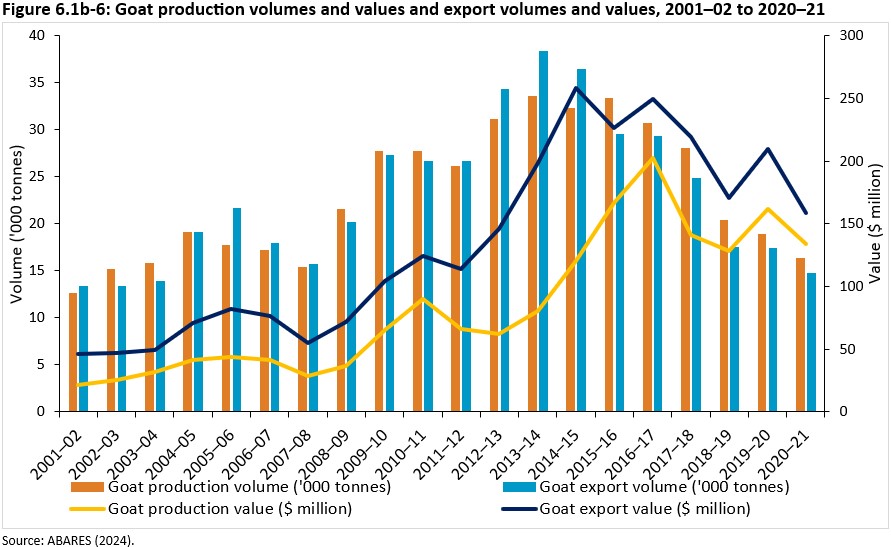
Feral goats are common and widespread particularly in rangeland areas and to some extent in forested areas throughout Australia. In some parts of Australia, wild (feral) goats (Capra hircus) are a threat to native species and agricultural crops. Wild-caught goats contribute to Australia’s domestic meat production and export markets, however, the proportion sourced from forests is unknown.
The Australian goat industry is heavily export-oriented, with limited domestic consumption. Australia has been the world’s largest exporter of goat meat since 2009. In 2015, Australia accounted for 51% of world exports, despite producing less than 1% of the world’s goat meat. In 2020–21, Australia produced about 16.4 thousand tonnes of goat meat, of which 90% was exported. This is a decline from 33.3 thousand tonnes that was produced in 2015–16 (with 89% exported) (MIG and NFISC 2018). The reduction in meat production and consequently, meat export, was also associated with a 42.7% decline of goat meat export value, from $226.4 million in 2015–16 to $158.6 million in 2020–21 (Figure 6.1d-6).
Click here for a Microsoft Excel workbook of the data for Figure 6.1b-6.
Sandalwood
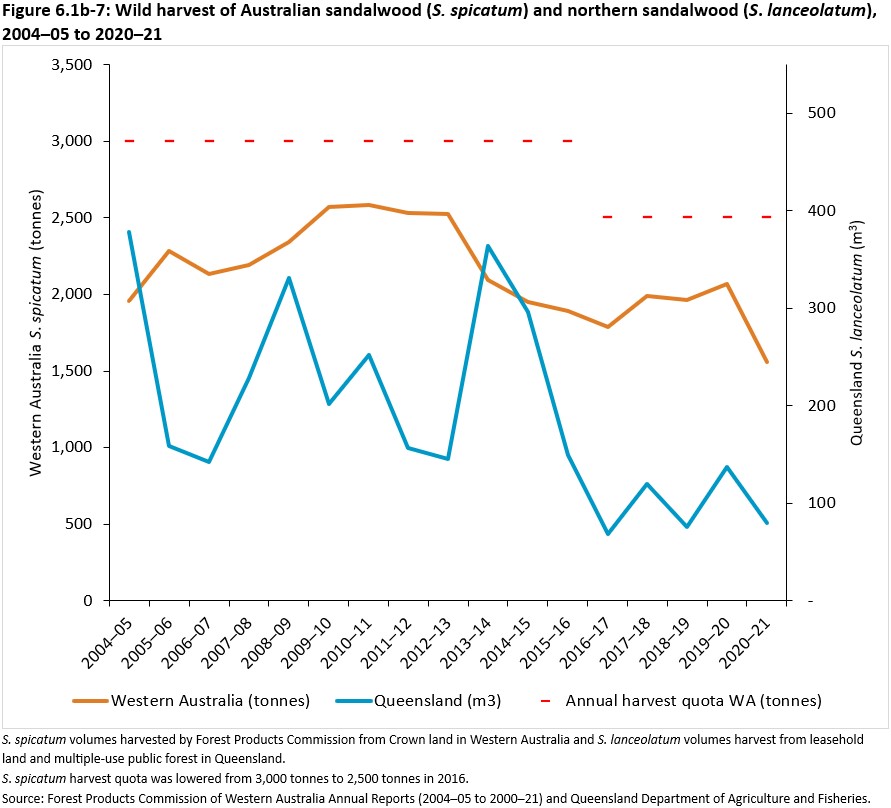
Sandalwood is harvested for the aromatic oils contained in the heartwood. As the heartwood extends throughout the tree, the whole tree (including roots) is harvested and processed (DBCA 2023). Australian sandalwood is not only traded as essential oil but also as logs, wood chips and powder for incense, cosmetics, religious rituals, and traditional medicine uses.
Most sandalwood harvested in Australia has grown naturally in the wild. The wild harvest of Australian sandalwood supplies an estimated 40–60% of sandalwood globally (Clarke 2006; Lingard and Perry 2018).
The average annual harvest of West Australian sandalwood (Santalum spicatum) from lands managed by the Western Australia Forest Products Commission during the period 2016–17 to 2020–21 was 1,875 tonnes (Figure 6.1b-7; FPC Annual Reports 2005 to 2021). This was down from the annual average harvest of 2,200 tonnes from 2011–12 to 2015–16 (Figure 6.1d-7). A smaller amount of sandalwood comes from the wild harvest of northern sandalwood (S. lanceolatum) in Queensland. The average annual harvest of northern sandalwood during 2016–17 to 2020–21 was 96 cubic metres. This was down from the average annual harvest of 222 cubic metres during 2011–12 to 2015–16 (Figure 6.1d-7).
As of 2020–21, Western Australia’s Forest Products Commission managed approximately 5,600 to 6,000 hectares of West Australian sandalwood (S. spicatum) plantations in Western Australia (FPC 2021, 2024). These plantations are typically harvested when trees reach around 25 to 30 years of age, allowing sufficient heartwood and oil development (FPC 2021; FPC and ASN 2018). In addition, plantations of Indian sandalwood (S. album) have been established in northern Australia through private and commercial ventures (MIG and NFISC 2018). Sandalwood plantations are reported in the ‘Other forest’ category in Indicator 1.1a.i.
Click here for a Microsoft Excel workbook of the data for Figure 6.1b-7.
Tree ferns
Tree ferns are harvested for domestic and export markets, primarily as ornamental plants. Soft tree ferns (Dicksonia antarctica) are the most commonly available tree fern species on the market. They are generally sourced from wet eucalypt forests in Tasmania. Regulations on tree fern harvest in Tasmania from wild populations are outlined in Indicator 2.1d.
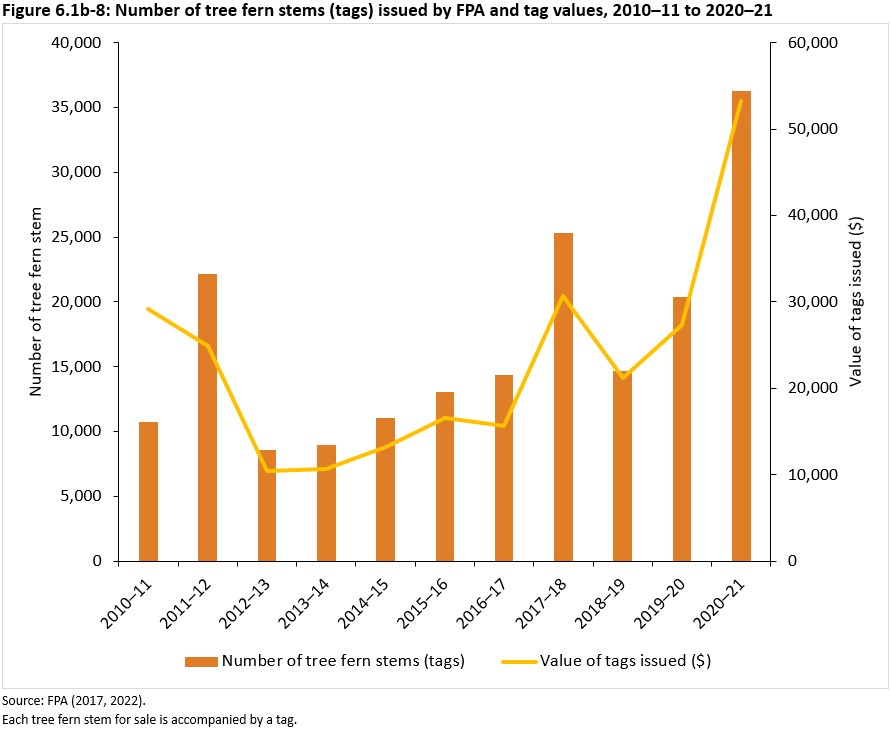
Tasmanian tree ferns must be sold with a tag issued by the Tasmania Forest Practices Authority. Tree fern tag cost has increased over time and varies with plant size. The cost of a tag for a large tree fern was $1.40 in 2011–12, $1.51 in 2015–16, and $1.62 in 2020–21 (FPA 2017, 2022).
The total tree fern harvest in Tasmania during the period 2016–17 to 2020–21 was 111,053 stems, equivalent to $148,269 in total tag value. This was higher compared to the total harvest and tag value in the period 2011–12 to 2015–16, reported as 63,831 stems and equivalent to $75,845 (Figure 6.1b-8).
Click here for a Microsoft Excel workbook of the data for Figure 6.1b-8.
Wildflowers
Australian wildflower production is underpinned by the world-wide demand for unique floricultural commodities. Flowers are sourced largely from cultivation but also from wild harvesting. The proportion of wildflower harvest from forests is not known.
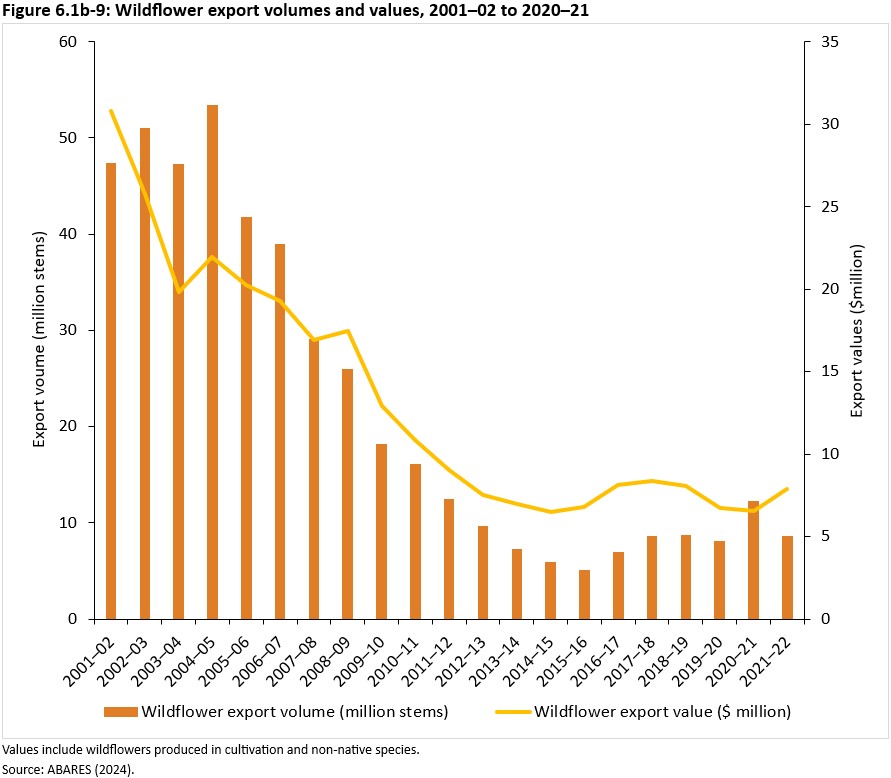
Most harvested wildflowers are exported, with 50–80% of products exported to East Asia, Europe and the USA (RIRDC 2014). Wildflower export volumes declined between 2001–02 to 2015–16 and have risen slowly since then (Figure 6.1b-9). The average annual export volume increased from 8 million flower stems during the 2011–12 to 2015–16 period to 9 million flower stems per year during the 2016–17 to 2020–21 period. This was reflected in average annual export values increasing from $7 million to $8 million for the same periods.
Click here for a Microsoft Excel workbook of the data for Figure 6.1b-9.
Essential oils
Sandalwood oil
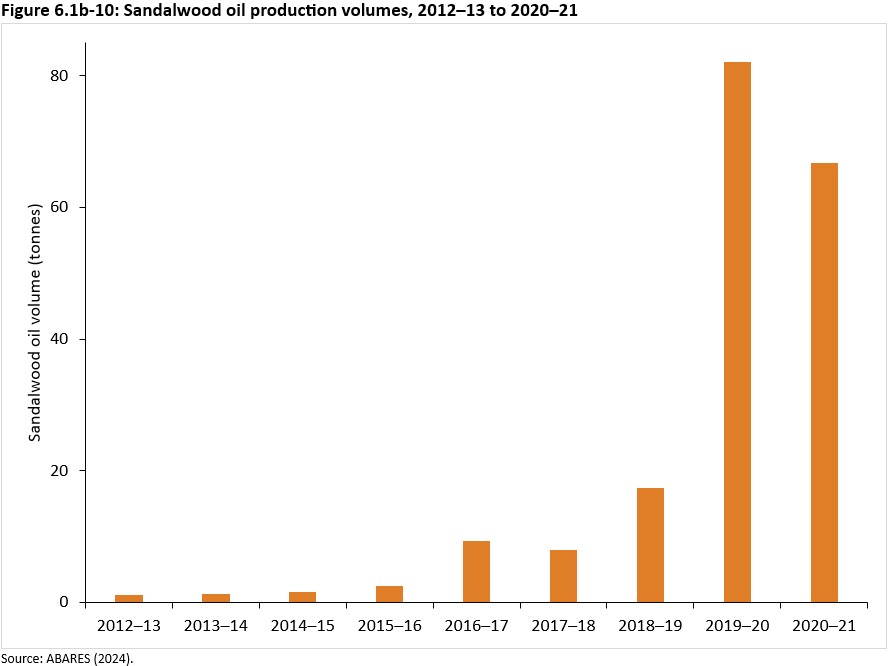
Sandalwood oil is extracted from the heartwood of sandalwood trees by steam distillation. The annual production of sandalwood oil increased from 1.1 tonnes in 2012–13 to 66.7 tonnes in 2020–21 (Figure 6.1b-10). The significant increase in recent years has been due to the harvest of mature Indian sandalwood plantations in northern Western Australia and the domestic processing of sandalwood oil from these trees.
Click here for a Microsoft Excel workbook of the data for Figure 6.1b-10.
Eucalyptus oil
Eucalyptus oil is extracted from the leaves of several Eucalyptus species, mainly blue mallee (E. polybractea), with smaller quantities obtained from narrow-leaved peppermint (E. radiata subsp. radiata) and oil mallee (E. kochii). Eucalyptus oil has a wide range of commercial applications, including pharmaceutical products and industrial chemicals. Other potential products from eucalyptus oil, such as aviation fuels or other biomaterials, have been tested but are not currently commercially produced (Mewalal et al. 2017).
Eucalyptus oil is increasingly sourced from plantations and less from native forests and woodlands. Plantations of E. polybractea for eucalyptus oil production have been established in New South Wales and Victoria (Bush et al. 2022).
The amount of eucalyptus oil produced in 2011–12 was 120 tonnes. Production increased by 50% from 2011 to 2016 as plantations matured and following the end of the Millennium Drought (MIG and NFISC 2018). Production estimates for the 2016–17 to 2020–21 period are not available.
Tea tree oil
Tea tree oil is mainly produced from narrow-leaved paperbark or narrow-leaved tea tree (Melaleuca alternifolia), but also from M. linariifolia. It has a wide range of uses in industrial applications as a solvent and disinfectant for cosmetic and pharmaceutical processes (RIRDC 2009).
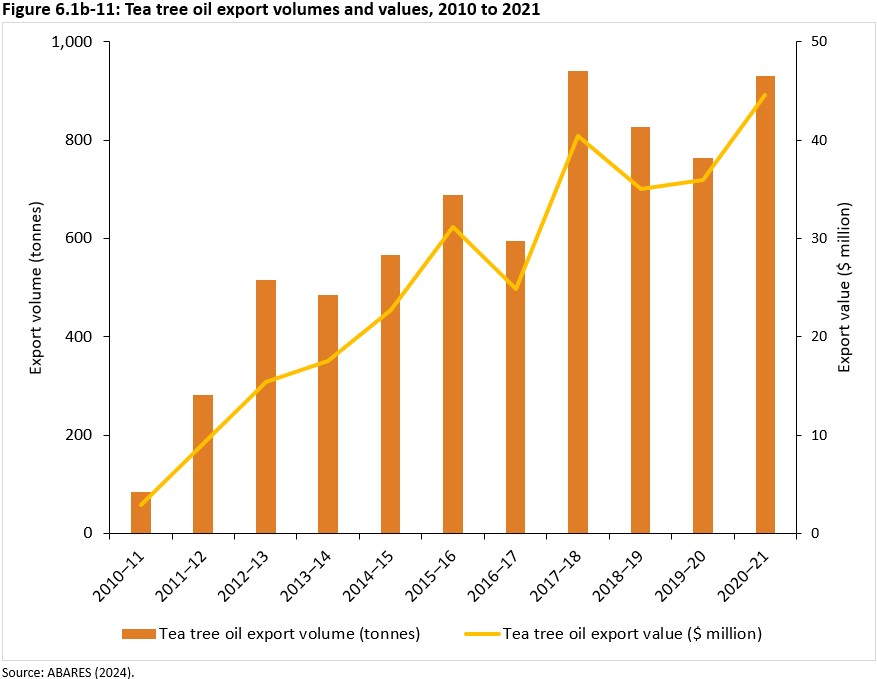
Australia is the largest producer of tea tree oil globally and over 90% of the production volume is exported, mainly to the USA and Europe (DAWE 2017). The volume of tea tree oil exports has varied between years but has shown a general increasing trend since 2016–17. Export volume increased from 688 tonnes in 2015–16 to 930 tonnes in 2020–21. Export values also increased during this period from $31 million in 2015–16 to $45 million in 2020–21 (Figure 6.1b-11).
Click here for a Microsoft Excel workbook of the data for Figure 6.1b-11.
Other native essential oils
Lemon myrtle (Backhousia citriodora), boronia (Boronia spp.), fragronia (Agonia fragrans), cypress pine (Callitris glaucophylla and C. intratropica) and honey myrtle (Melaleuca teretifolia) are some other species from which essential oils are produced in Australia.
Lemon myrtle essential oil is one of the richest known sources of natural citral, a powerful antioxidant with antimicrobial and antifungal properties. Most lemon myrtle trees can be found across high rainfall areas of New South Wales and south-east Queensland, with some in Victoria and South Australia.
Cypress oil, from C. glaucophylla (white cypress oil) and C. intratropica (blue cypress oil), is harvested commercially for aromatherapy and traditional medicine. White cypress oil is extracted from leaves and stems, with materials sourced from wild stands occurring in the sub-humid zone stretching from southern New South Wales to central Queensland (Taylor et al. 2005). Blue cypress oil is harvested from heartwood and bark with materials sourced from the Northern Territory and northern Western Australia (Boland et al. 2006).
Native bush food
The native bush food industry spans a wide variety of Australian species, with many wild harvested from forests (Clarke 2012). Australia has over 6,500 recorded native bush food plants, however, only 13 are certified by Food Standards Australia New Zealand and available within the broader Australian and international market (RIRDC 2020) (Table 6.1b-2).
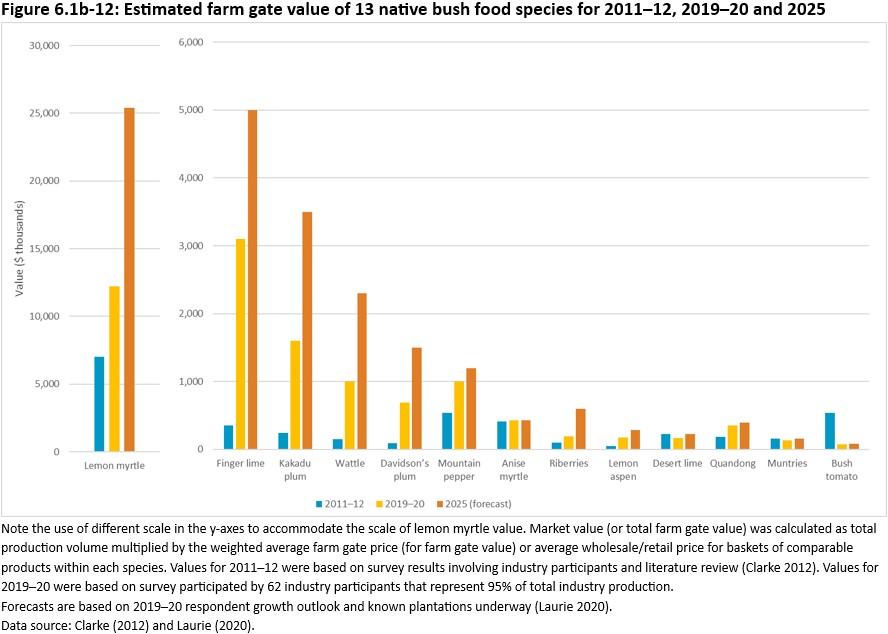
Total farm gate value for the native bush food industry grew from $10 million in 2011–12 to $21.2 million in 2019–20 (Figure 6.1b-12). Lemon myrtle makes up the largest proportion of the native bush food industry, by output and value (Table 6.1b-2; Figure 6.1b-12). About 90% of lemon myrtle leaf and oil produced in Australia is exported, mainly to Europe and the USA.
The finger lime and Kakadu plum industries have grown considerably over the last decade and are forecast to continue expanding. The value of wattle seed, Davidson’s plum and riberry industries are also projected to grow, although total values are low compared to lemon myrtle, finger limes and Kakadu plum (Figure 6.1b-12). The bush tomato industry has been declining as businesses struggles to attract labour and mechanical harvest often leads to plant mortality (Laurie 2020).
Regular production and insufficient supply are among the key challenges for native bush food (Clarke 2012; AgriFutures 2018; Laurie 2020), however, some are now being grown in plantations, including lemon myrtle and finger lime. Native bush food enterprises are typically small and grow a range of species. The native bush food industry is also increasingly at risk from myrtle rust (Mazzorana and Mazzorana 2016) and climate change impacts, including prolonged drought (Laurie 2020). Generally, there is limited information available regarding the production volume and value for individual bush food species, and the sector as a whole.
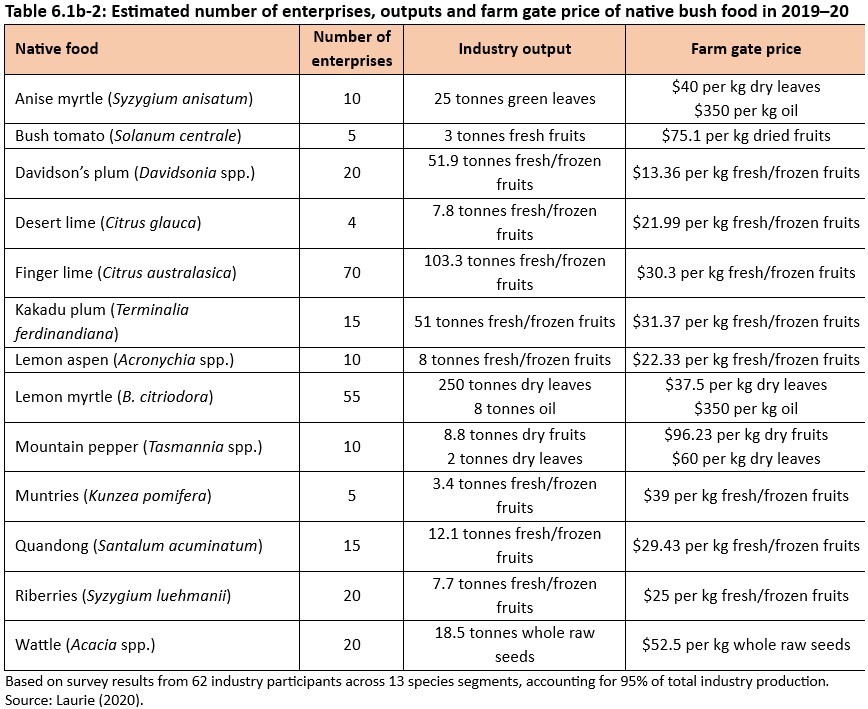
Click here for a Microsoft Excel workbook of the data for Table 6.1b-2.
Click here for a Microsoft Excel workbook of the data for Figure 6.1b-12.
Further information
References for Indicator 6.1b: Values, quantities and use of non-wood forest products (2025) PDF [0.3 MB]
Downloads
Indicator 6.1b: Values, quantities and use of non-wood forest products (2025) PDF [0.9 MB]
Tabular data for Indicator 6.1b - Microsoft Excel workbook [0.3 MB]