Authors: Matthew Howden and Kirk Zammit
The United States is a major producer and the largest exporter of agricultural commodities. Because of the size of the US agriculture sector, changes in production, trade and policy can affect international markets. This has been demonstrated by the China-US trade dispute, which has caused a diversion in exports for Australia and other countries. This Insights report compares the Australian and US agricultural sectors, and briefly profiles US agricultural policy, to highlight Australia’s exposure to shifts in the global market resulting from the trade war.
[expand all]
The United States is a major agricultural producer
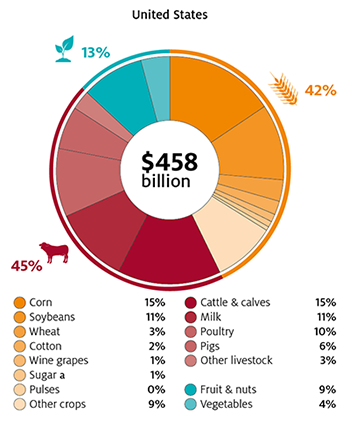
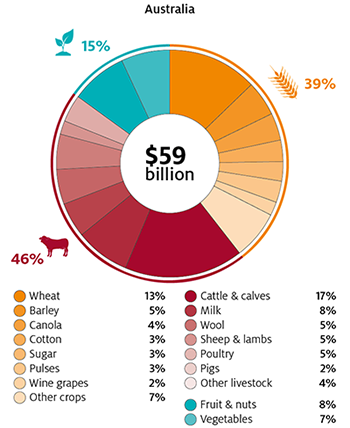
The United States is the third largest producer of agricultural products in the world. Over the five years to 2016 the gross value of US agricultural production averaged $458 billion1, almost 8 times higher than Australia, at $59 billion.
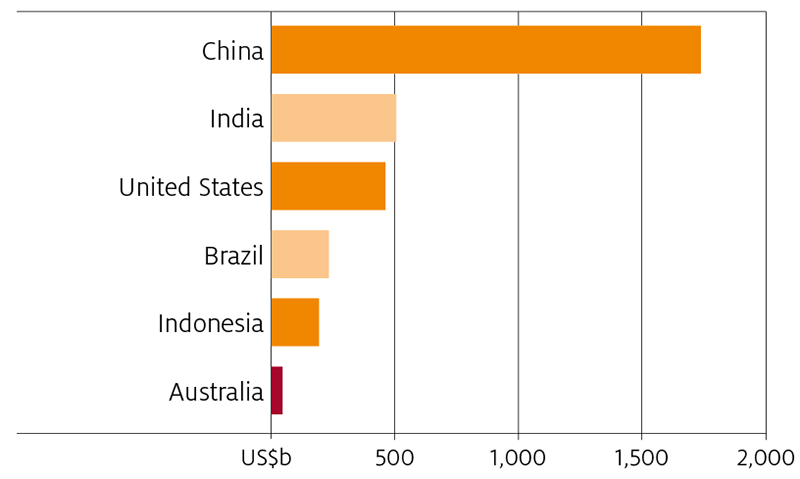
The sheer size of US agricultural exports means it is considered a price setter on world markets for some products. This means that significant changes in US production can influence world commodity prices; corn and soybeans in particular (Figure 2).
Smaller agricultural producers and exporters, like Australia, do not wield the same influence and are price takers in these markets.
Sources: Australian Bureau of Statistics (2019); USDA-NASS (2019)
US farm production differs from Australia
Australia and the United States produce many of the same commodities, but the underlying climatic, geographic, policy and consumer factors influencing production differ.
In the United States, the share of cattle and calf production relative to the total value of agricultural production is roughly equivalent to Australia.
However, unlike Australia, livestock production is more intensive, and almost all cattle are finished on grain. The exceptions are cattle on specialty grass-fed operations, cull cows and veal calves. Dairy, poultry and pork production also contribute significantly to the value of livestock production.
In contrast, Australian cattle are predominantly pasture fed and finished. Just under 40% of cattle are finished on grain. Milk is the second largest contributor to the value of livestock production, followed by wool and sheep meat. The US sheep meat and wool industries are small, accounting for less than 1% of total agricultural production.
Crop production in the United States is dominated by corn and soybeans, a significant share of which is used as feed for the livestock industry. Other major crops are cotton, rice, sorghum, sugar (produced from both beet and cane) and wheat. Wheat accounts for a relatively small share of total agricultural production at 3%.
In Australia wheat is by far the largest crop, followed by barley, canola, cotton and sugar. Australian sugar is produced solely from sugar cane.
What do Australia and the United States export?
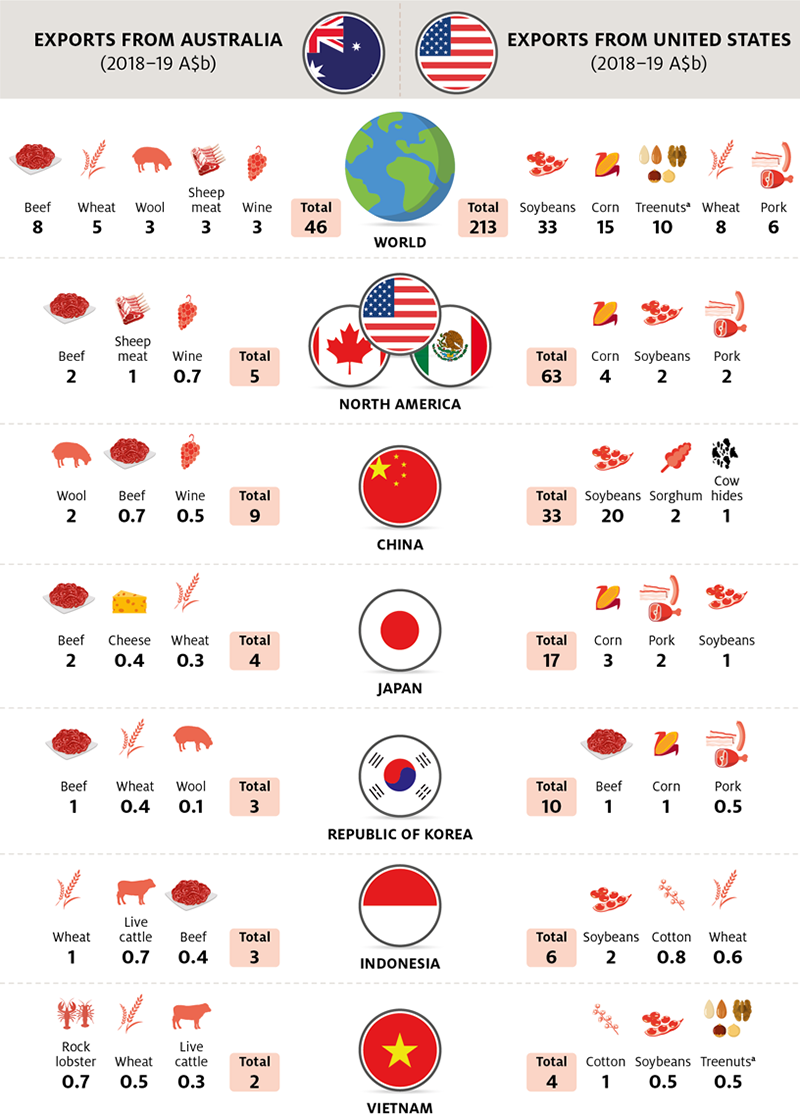
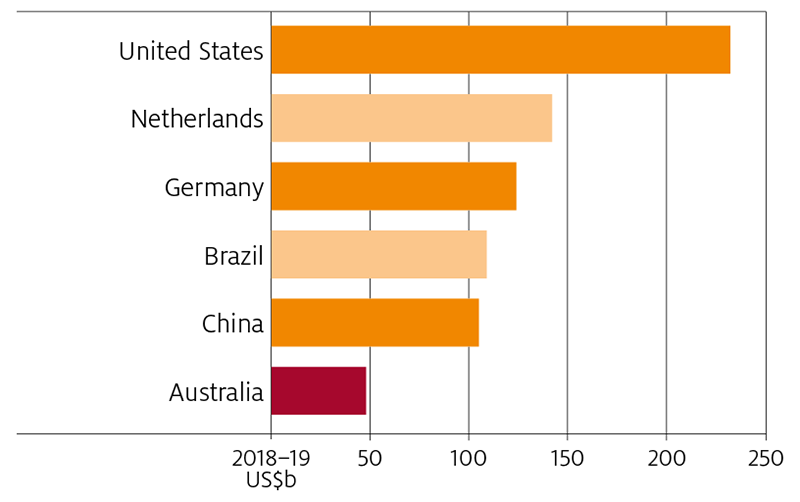
Australia and the United States export a wide range of agricultural products. The United States is the largest exporter of agricultural products globally, with the value of exports averaging $195 billion over the five years to 2016. Australian exports averaged $45 billion over the same period.
High value Australian exports are largely derived from livestock, including beef, sheep meat and wool. The United States is also a major meat exporter. Beef is the largest meat product exported, followed by pork and chicken meat. In Australia, wheat is the largest crop exported by value. In contrast, US crop exports are dominated by soybeans and corn. These crops are used as animal feed in countries like China and Mexico, and increasingly for both feed and for industrial uses (particularly biofuels) in the European Union.
The differences in the types of major agricultural products that are exported by the two countries have mitigated the effects of the China-US trade war on Australian agricultural exporters. However, Australia and the United States do compete in China across a broad range of lower volume and high-value goods.
These include fruit and nuts, vegetables, dairy products and wine. The substitutable nature of these products has seen the value of Australian exports to China increase sharply for some of these goods in 2018–19.
Source: UN Statistics Division (2019)
US agriculture is less export oriented than Australia
The United States may be the world’s largest exporter of agricultural products (Figure 4), but it is not as export oriented as Australia. Despite the very large value of agricultural exports, only about 20% of production is exported. This is much lower than Australia’s 70% of production exported.
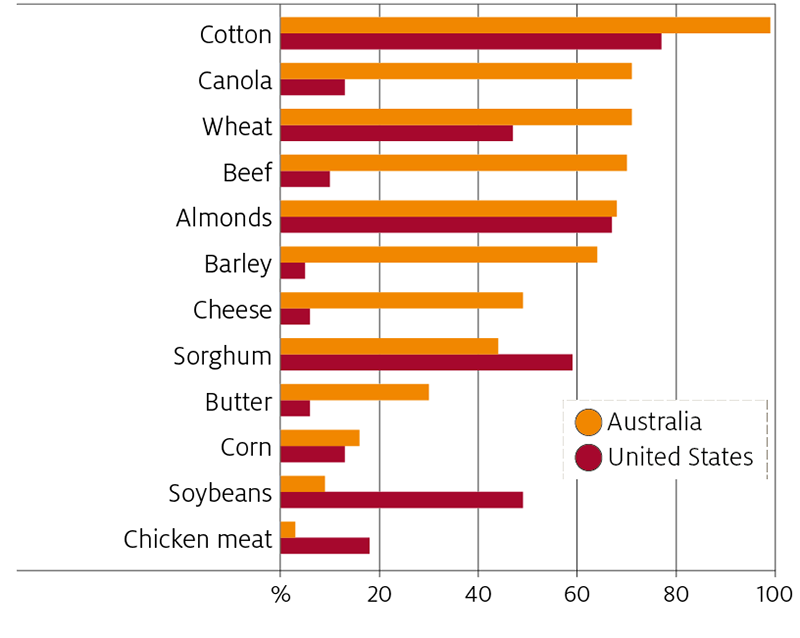
The United States has a large domestic market. With its population of 329 million, agricultural production is primarily geared towards meeting the demands of its own consumers. Commodities such as beef, dairy products and chicken meat are largely consumed domestically (Figure 5).
There is a broad spectrum of specialised, high value agricultural goods for which Australia competes with the United States on the world market. These include beef, dairy products, fruit and nuts, and wine.
Source: USDA–NASS (2019)
Both Australia and the United States export a high proportion (greater than 50% of production) of almonds, cotton and sorghum. Australia also exports a high proportion of barley, beef and canola.
Australia’s greater reliance on exports means that changes in global markets for agricultural goods have significant implications for Australian producers.
The changing trading relationships that are occurring because of the China-US trade dispute have introduced new challenges for the sector. These are assessed regularly by ABARES in Agricultural commodities.
Australia and the United States have increased exports to Asia
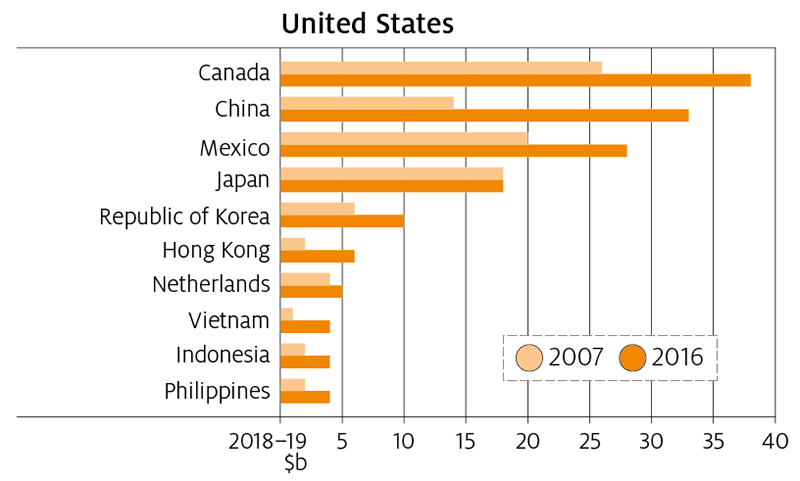
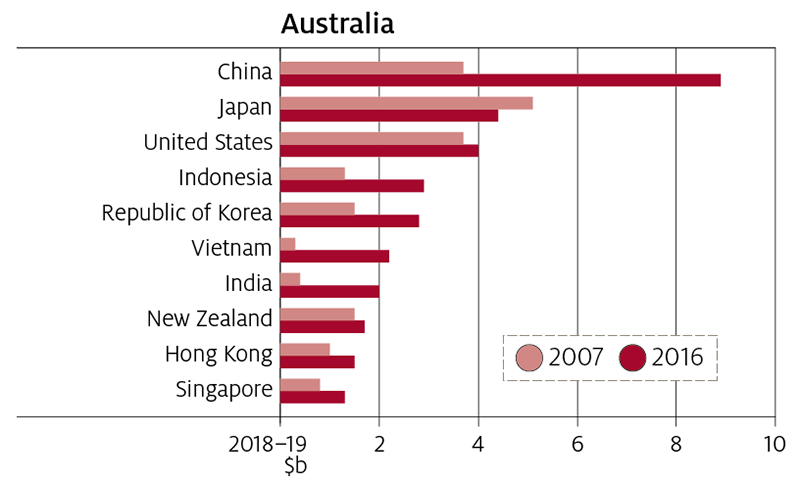
Over the 10 years to 2016 the value of both Australian (up 50%) and US (up 48%) agricultural exports increased significantly2. Driving this increase was export growth to China, Hong Kong, the Republic of Korea and South-East Asia (in particular, Indonesia, the Philippines and Vietnam). Growth in exports to Japan, a traditional export market for both countries, remained relatively unchanged. The United States also increased exports to Canada and Mexico, its most established trading partners.
Australia and the United States share 6 of their top 10 markets
The top 10 export markets for both Australia and the United States include China, Japan, Republic of Korea, Hong Kong, Vietnam and Indonesia. Over the past 10 years, these countries (excluding Japan) experienced strong population, urbanisation and income growth, which precipitated a rise in food import demand (Figure 7). Australia and the United States have both been highly responsive to the export opportunities this has provided.
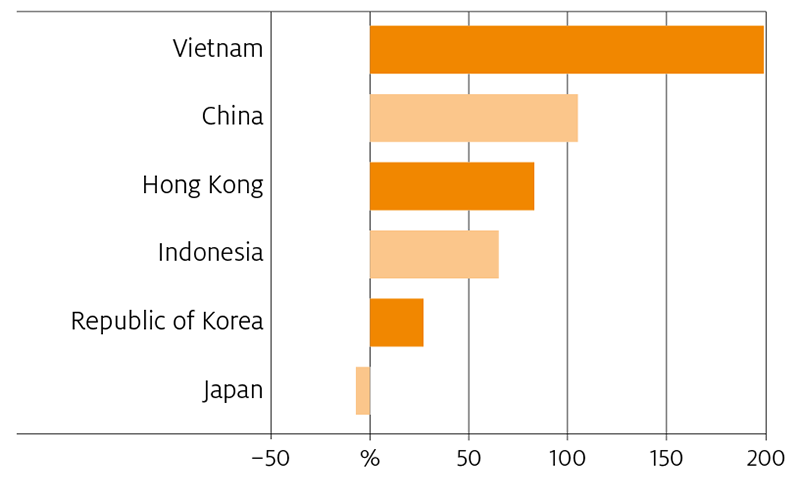
Over the 10 years to 2016, the value of agricultural exports from both Australia and the United States to these six countries increased by 77%. Australian exports increased from $13 billion to $23 billion and US exports increased from $42 billion to $74 billion.
The United States’ ability to increase exports to markets in Asia, despite only having a free trade agreement with the Republic of Korea, is worth noting. US exports to Asian countries are generally traded according to ‘most favoured nation’ terms negotiated under the World Trade Organisation.
In contrast, Australia holds multiple bilateral and multilateral agreements with most countries in the region (except those in south Asia), providing Australia with preferential access through lower tariffs and rising quotas.
When measured as a proportion of total exports, both Australia and the United States have experienced a similar shift in exports towards China. However, the United States does not have a free trade agreement with China.
US trade policy favours bilateral agreements
The United States currently has a combination of bilateral and multilateral free trade agreements covering 20 partner countries (Table 1).
a NAFTA. b CAFTA-DR.
Source: United States Office of Trade Representative (2019)
The United States is a signatory to two multilateral agreements: the Dominican Republic-Central America Free Trade Agreement (CAFTA–DR) and the North American Free Trade Agreement (NAFTA), which includes Canada, Mexico and the United States.
In May 2017 President Trump called for the terms of NAFTA to be renegotiated. This new agreement—the United States–Mexico–Canada Agreement—was signed by all three parties in November 2018 but was not in force as at August 2019.
The United States withdrew from the Trans-Pacific Partnership (TPP) on 23 January 2017. The 11 remaining signatories committed to progressing the agreement without the United States in the form of the Comprehensive and Progressive Agreement for Trans-Pacific Partnership. As at August 2019, this agreement had entered into force for 7 of the 11 signatories, including Australia.
There is limited overlap between Australian and US trade agreements
Only four countries have a free trade agreement with both Australia and the United States: Chile, Peru, Singapore and the Republic of Korea (Table 2).
However, the United States is in bilateral negotiations with Japan, and both Australia and the United States are in trade negotiations with the European Union.
The governments of both countries are also interested in beginning trade negotiations with the United Kingdom once it withdraws from the European Union. Competition between the United States and Australia is likely to increase over the medium term if the United States is able to gain favourable access to these countries.
Sources: Department of Foreign Affairs and Trade (2019a); Office of the United States Trade Representative (2019)
US agricultural policy
Agricultural policy in the United States is determined by the Agricultural Improvement Act, commonly known as the farm bill. The farm bill is typically in place for 5 years and sets the budget for US agricultural policy over that period. In December 2018 President Trump signed off on the 2018 farm bill.
The 2018 farm bill has a budget of US$428 billion for the 2018–2023 period, an increase of US$2 billion from the previous farm bill. The 2018 farm bill largely continues programs implemented in the 2014 farm bill.
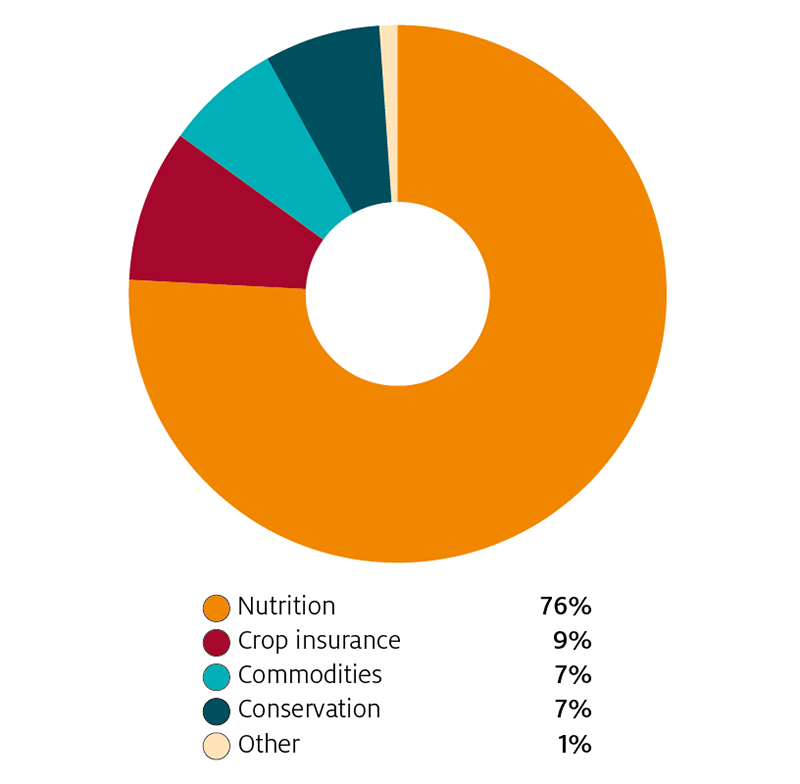
The largest budgeted component of the farm bill is nutrition programs. Around 76% of total expenditures are projected for domestic food assistance programs. This is commonly known as the food stamps program and helps disadvantaged people afford food. However, there is no requirement for the government to purchase domestically produced food.
Other major programs are crop insurance (accounting for 9%), commodities (7%) and conservation programs (7%). These programs provide farmers with various forms of support or payments for environmental stewardship and are implemented in a way so as not to affect production decisions.
OECD producer support estimates show that US producer support was around 10% of gross farm receipts over 2016 to 2018, this compares with 2% in Australia. The OECD average was 18.5%.
Source: Congressional Budget Office (2018)
China-US trade tensions have disrupted global markets
The trade relationship between China and the United States is as fragile as it is important. Despite the reliance of the US manufacturing and retail industries on Chinese imports, in July 2018 the US Government took punitive action against China for claimed violations of intellectual property laws.
In July 2018 the United States imposed tariffs on US$34 billion of imports from China, comprised principally of manufactured items but also some foods. China retaliated by imposing its own tariffs on imports of US products, most importantly on soybeans. Thus began the China-US trade war that has escalated over the past year. As at 1 September 2019, the United States has levied tariffs on approximately US$360 billion of imports from China with tariffs on a further $160 billion of imports to be applied on 15 December.
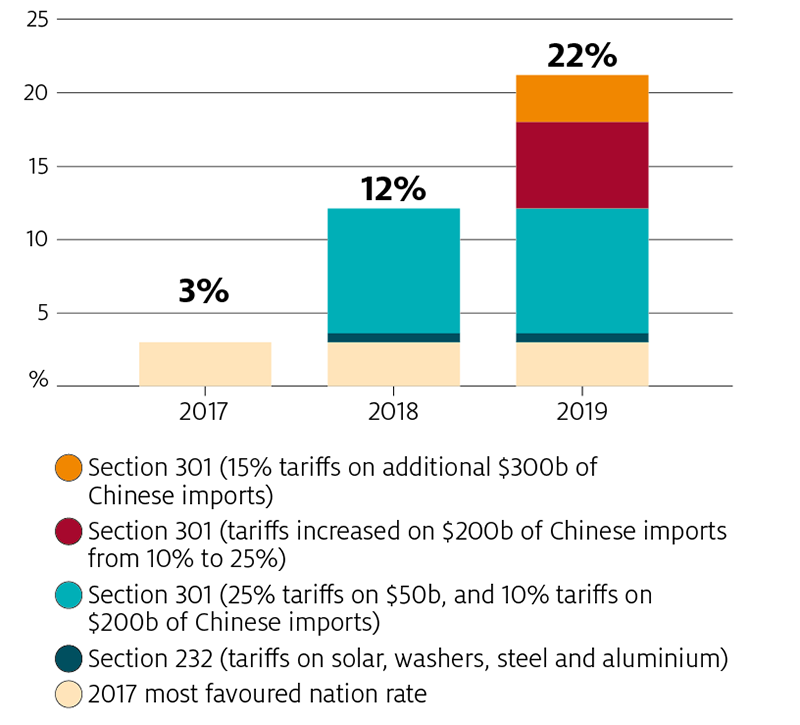
All US agricultural exports to China, worth approximately US$25 billion, are now subject to tariffs.
Note: HTS is Harmonised Tariff Schedule.
Source: US Department of Agriculture (2019)
China is Australia’s single largest destination for agricultural exports, with an export share of 27% in 2018–19. China has also become an important market for the United States, in recent years, but the trade dispute has changed this.
US agricultural exports to China have halved since China’s imposition of import tariffs, and are expected to decline further in 2019. China has fallen from being the United States’ second largest export partner to its third largest, and could fall further. However, US agricultural exporters are not as dependent on China as Australia (Figure 6). Canada and Mexico are roughly equivalent-sized markets to China, and Japan is also an important market for the United States.
The trade dispute with China has caused disruptions in global markets. US exporters have needed to find alternative markets for their commodities and China has sourced commodities from non-US countries, including Australia. This has benefited some of Australia’s exports that compete with US products.
Beyond China, market shifts could lead to increased competition with the United States in our shared export markets. For example, Australian canola exports to the European Union, which are used for biofuels and feed, are facing stronger competition from displaced US soybeans.
The United States has introduced support packages for their farmers
Two separate, one-off farm support packages were introduced by the US government to compensate farmers adversely affected by the ongoing trade dispute with China.
A US$12 billion farm support package in 2018 provided aid for eligible farmers through direct payments, food purchases and expanding marketing and foreign trade programs. A $US16 billion package has been implemented for 2019. Of that, $US14.5 billion will be made in direct payments under the Market Facilitation Program (MFP). Payments are differentiated for non-specialty crops, dairy, hogs, specialty crops and cover crops.
Overall, this support package is not likely to affect the decisions US producers make about which crop to produce. This is because direct payments to producers of non-specialty crops are based on a single-county payment rate. However, the single-county payment rate is multiplied by a farmers total plantings, which is likely result in a larger aggregate non-specialty crop area than US producers would have planted without government support.
Long term implications of a China-US trade dispute outweigh the short-term benefits for Australian agricultural exports
The China-US trade dispute has disrupted world markets and has presented opportunities for some Australian industries which export to China. The imposition of tariffs on US products has meant that alternative suppliers, including Australia are being sought to meet demand. Australian exporters have favourable market access to China because of ChAFTA (Table 4).
a Value of exports in 2017. For comparative purposes, Australian and US figures are from UN Comtrade International Statistics Database. b Most favoured nation in quota tariff rates. c Value of Australian cotton imported by China. ChAFTA China-Australia Free Trade Agreement.
Sources: Department of Foreign Affairs and Trade (2019b); UN Statistics Division (2019); US Department of Agriculture
In 2018–19 agricultural exports to China increased sharply for nuts (driven by almonds), vegetables, beef, mutton, lamb and cotton. However, climatic and productivity constraints have limited Australia’s ability to respond to increased demand from China.
The trade dispute, is likely to have longer term implications that will outweigh these short-term benefits.
The effective exclusion of the United States’ agricultural exports to China has increased competition in Australia’s other export markets, which the United States also has a significant presence in. These include countries in South-East Asia, and the eurozone.
The increase in Australian exports to China also means a further concentration of exports to China, which currently represents one third of agricultural exports. This increases Australia’s exposure to policy changes and shocks in a single market.
The dispute is also having an impact on regional and global growth. Australia’s export dependence on Emerging Asian markets means that Australian producers are potentially vulnerable to a downturn in income growth, as consumers react by shifting away from Australia’s high value agri-food products to cheaper alternatives. The extent will depend on Australia’s relative market access and possible responses in our trading patterns in the face of slowing economic growth. Beyond food, US import tariffs on Chinese consumer goods, including clothing, have the potential to disrupt global supply chains in these markets and presents a significant risk for Australian fibre exports.
Australian producers need to remain agile, responding to changes in market demands and competition if exports are to continue to grow. Building on existing trade agreements and exploring new possibilities are necessary to protect Australian exporters from the longer-term trend of increased competition and market disruption. Continued support for the multilateral framework of international trade is also important to curb direct support payments to agricultural producers, which further distort markets and can disrupt trading patterns.
Sources
ABS 2019, International Trade: June 2019 [unpublished data], cat. no. 5465.0, Australian Bureau of Statistics, Canberra.
CRS 2018, Profiles and effects of retaliatory tariffs on US agricultural exports, United States Congressional Research Service, Washington.
CRS 2019, Farm Policy: USDA’s 2018 Trade Aid Package, United States Congressional Research Service, Washington.
DFAT 2019a, Free Trade Agreements, Department of Foreign Affairs and Trade, Canberra.
DFAT 2019b, Free Trade Agreement portal, Department of Foreign Affairs and Trade, Canberra.
FAO 2019, FAOSTAT, Food and Agricultural Organisation of the United Nations, Rome.
Felix, TL, Hartman, D and Williamson, JA 2018, Grass fed beef production, Penn State Extension, Pennsylvania.
Jackson, T, Hatfield-Dodds, S, and Zammit, K, 2018, ABARES Insights, Snapshot of Australian Agriculture, Australian Bureau of Agricultural Economics and Sciences, Canberra.
PIIE 2019, Trump’s Trade War Timeline: An Up-to-Date Guide, Peterson’s Institute for International Economics, Washington.
UN Statistics Division 2019, UN Comtrade database, New York.
USDA ERS 2019, Frequently asked questions, United States Department of Agriculture Economic Research Service, Washington.
USDA FAS 2019, China announces increases to additional tariffs, GAIN report no. CH19051, United States Department of Agriculture Foreign Agricultural Service, Washington.
USDA NASS 2019, Agricultural statistics, Annual, United States Department of Agriculture, National Agricultural Statistics Services, Washington
USTR 2019, United States–Mexico–Canada Agreement, Office of the United States Trade Representative, Washington.
