
Key issues
- In the week ending 5 March 2025, low-pressure systems brought rainfall to the north and east of Australia.
- Rainfall totals were low in all cropping regions, with between 0-5 millimetres in Queensland, New South Wales and Western Australia, and no rainfall in remaining regions.
- The lack of rainfall across summer cropping regions has likely seen a drawdown of stored soil moisture but will also likely have supported the uninterrupted harvesting of earlier planted summer crops.
- Over the coming eight days, rainfall totals are expected to be high in the east, with Tropical Cyclone (TC) Alfred expected to make landfall in the coming days.
- Eastern cropping regions are expected to see between 10-100 millimetres of rainfall. If realised, these falls are likely to boost soil moisture for late planted summer crops and ahead of the planting of winter crops, however, this may bring some delays to the harvesting of earlier planted summer crops.
- Remaining cropping regions are likely to see little to no rainfall over the period.
- Most of Australia received average rainfall over February 2025, with well below average rainfall across much of southern Australia. Parts of the north and east saw above average rainfall.
- Pasture growth for the three months to February 2025 has been mixed across Australia. Above average rainfall totals resulted in average to extremely high pasture growth across large parts of northern Australia. Below average to extremely low pasture growth was recorded across parts of eastern and central Australia.
- Soil moisture models indicate low soil moisture levels in much of southern Australia, with above average soil moisture modelled in northern Queensland, eastern New South Wales and Victoria, and large parts of Western Australia.
- Water storage in the Murray-Darling Basin (MDB) decreased between 27 February 2025 and 06 March 2025 by 306 gigalitres (GL). Current volume of water held in storage is 13,078 GL, equivalent to 58% of total storage capacity. This is 26 percent or 4,707 GL less than at the same time last year. Water storage data is sourced from the Bureau of Meteorology.
- Allocation prices in the Victorian Murray below the Barmah Choke decreased from $183 on 27 February to $182 on 06 March. Prices are lower in regions above the Barmah choke due to the binding of the Barmah choke trade constraint.
Climate
In the week ending 5 March, low pressure systems brought rainfall to north-western and eastern Australia. In the northwest, tropical storm systems contributed to showers and storms. High-pressure systems kept much of the country largely dry.
- Parts of the northern tropics, including the far north of the Northern Territory and northern Queensland, recorded rainfall totals of between 5-25 millimetres. In northern Western Australia, rainfall of between 5-50 millimetres fell over the period.
- Tropical lows and the approach of Tropical Cyclone (TC) Cyclone Alfred brought rainfall totals of 5-50 millimetres across much of the east coast, including New South Wales and southern Queensland. In Tasmania, up to 15 millimetres of rainfall well in the west.
- Across remaining areas of the country, little to no rainfall was recorded.
Rainfall totals were generally low across all cropping regions.
- In Queensland, New South Wales, and Western Australia, isolated rainfall totals of between 0-5millimetres were observed, with remaining cropping regions seeing no rainfall. The lack of rainfall across summer cropping regions has likely seen a drawdown of stored soil moisture but will also likely have supported the uninterrupted harvesting of earlier planted summer crops.
Rainfall for the week ending 5 March 2025
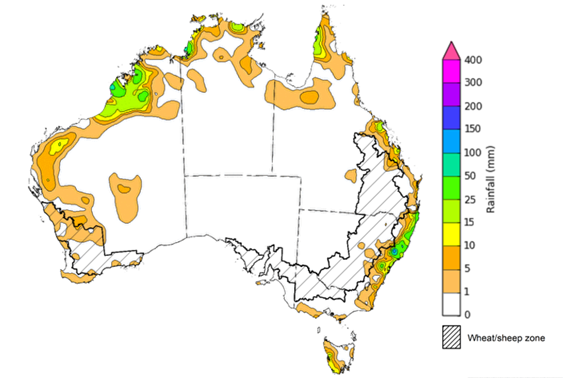
Note: The rainfall analyses and associated maps utilise data contained in the Bureau of Meteorology climate database, the Australian Data Archive for Meteorology (ADAM). The analyses are initially produced automatically from real-time data with limited quality control. They are intended to provide a general overview of rainfall across Australia as quickly as possible after the observations are received. For further information go to http://www.bom.gov.au/climate/rainfall/
Over the 8 days to 13 March 2025, Tropical Cyclone (TC) Alfred and low-pressure systems are expected to bring significant rainfall totals to parts of the north and east of the country.
- Falls of between 10–100 millimetres are likely for parts of northern Western Australia, the north of the Northern Territory and the far north of Queensland, as well as much of the east, including south-eastern Queensland, eastern New South Wales and Victoria, and Tasmania.
- Rainfall totals exceeding 200 millimetres are forecast for coastal regions in the path of TC Alfred.
- By contrast, a high-pressure system is expected to keep much of the remainder of Australia largely dry.
- By contrast, a high-pressure system is expected to keep much of the remainder of the south and interior of Australia largely dry, including South Australia and southwest Western Australia
Rainfall totals across cropping regions over the coming week are forecast to be highly variable.
- Rainfall totals of between 10-100 millimetres are forecast for cropping regions in Queensland and New South Wales, with eastern Victoria likely to see falls of between 10-50 millimetres. If realised, these falls are likely to boost soil moisture for late planted summer crops and ahead of the planting of winter crops, however, this may bring some delays to the harvesting of earlier planted summer crops.
- In contrast, cropping regions in South Australia, Western Australia and western Victoria are forecast to receive little to no rainfall over the period.
Total forecast rainfall for the period 6 March to 13 March 2025
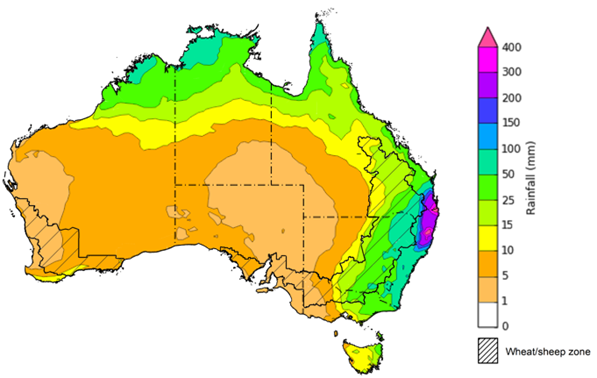
Note: This rainfall forecast is produced from computer models. As the model outputs are not altered by weather forecasters, it is important to check local forecasts and warnings issued by the Bureau of Meteorology.
Rainfall during February 2025 was highly variable with large areas of central and southern Australia received below average rainfall totals, while parts of northern areas of Queensland and Western Australia saw well above average rainfall over the period, relative to historical February averages.
- Rainfall was extremely low to below average across parts of central and southern Australia, including large areas of southern Western Australia, southern South Australia, western Victoria, and Tasmania, as well as coastal regions of southeast Queensland and New South Wales.
- Above average to well above average rainfall was recorded across parts of eastern Victoria and southern New South Wales, as well as much of northern Queensland and Western Australia.
- The remainder of Australia saw generally average February rainfall.
In cropping regions, February rainfall was variable, with generally below average and average rainfall in the south and average rainfall in the east:
- Much of South Australia, Victoria and the west of Western Australia observed well below average to extremely low rainfall.
- In Queensland, New South Wales and the remainder of Western Australia average rainfall was experienced in most regions over the period.
Rainfall percentiles for February 2025
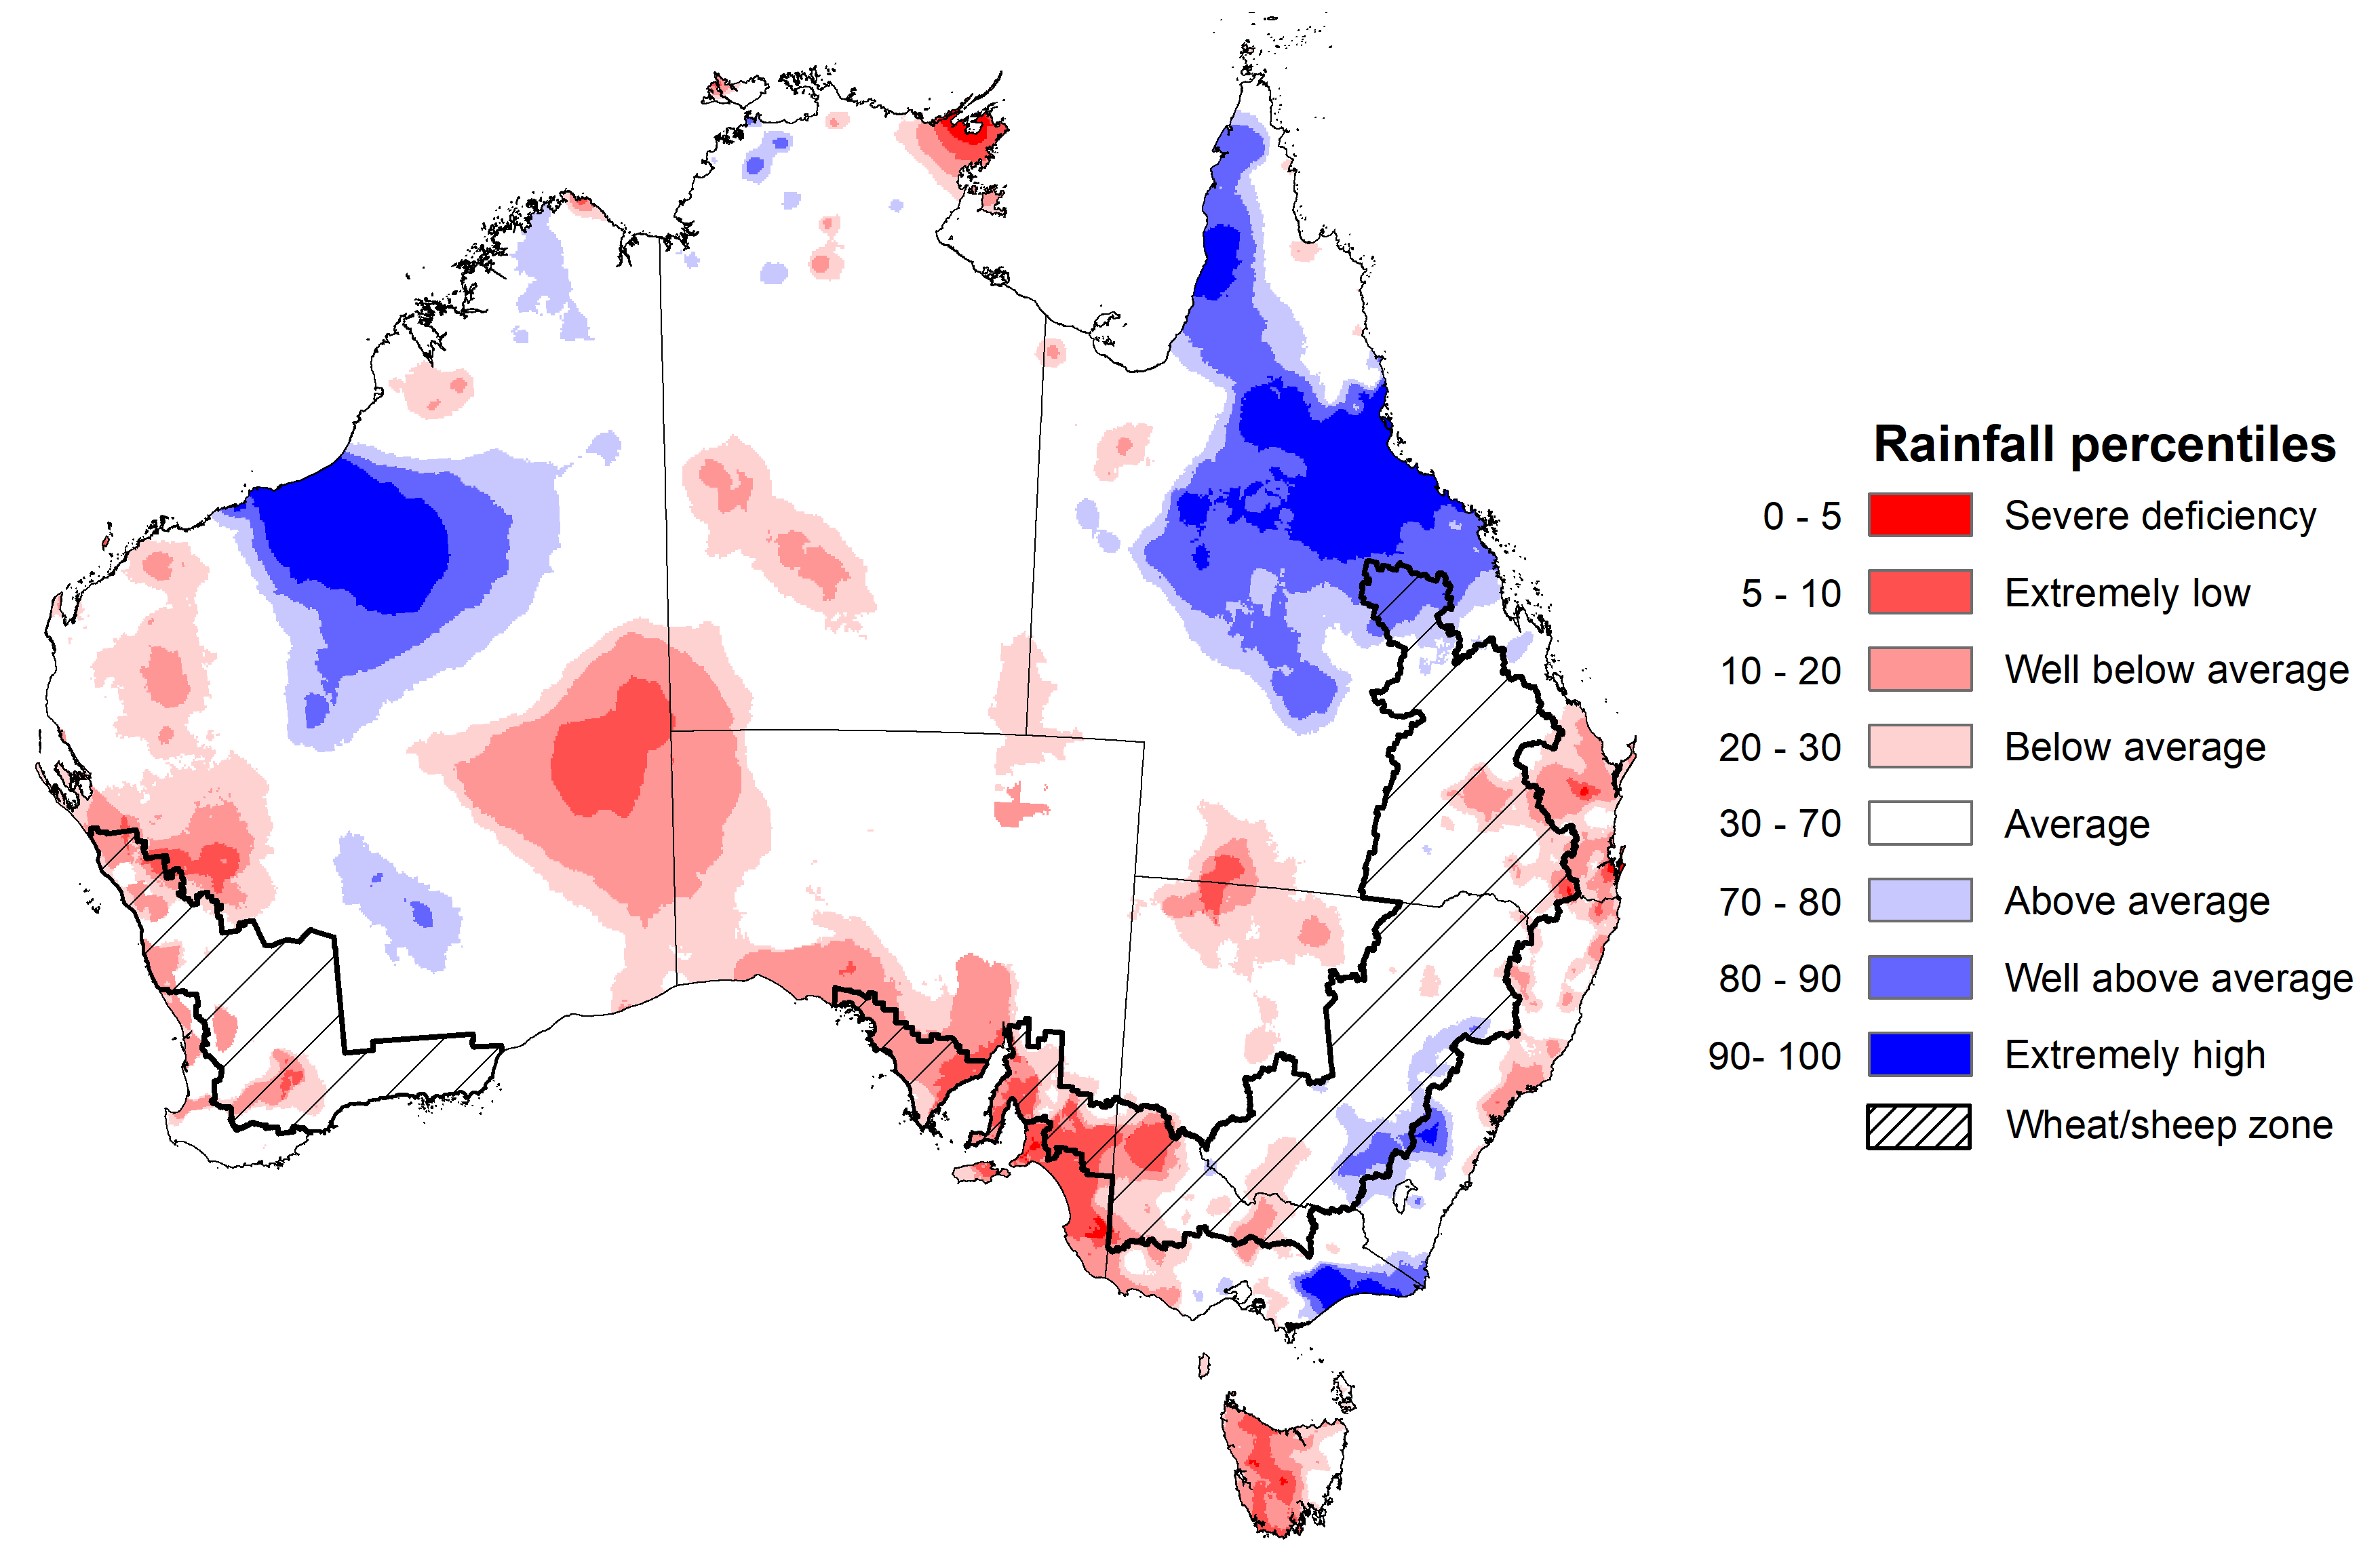
Source: Bureau of Meteorology
In February 2025, modelled upper layer soil moisture was generally average to above average across much of the country.
Large areas of Tasmania, South Australia, western Victoria, and central Australia saw very much below average to below average upper layer soil moisture.
- In contrast, much of northern Queensland and Western Australia, as well as eastern Victoria and central New South Wales saw average to very much above upper layer soil moisture.
At this time of year, upper layer soil moisture is important for late planted summer crops in northern New South Wales and Queensland and for pasture growth across northern Australia since plant germination and establishment utilise this moisture. It is also an important indicator of the ability to access paddocks for the harvesting of early planted summer crops.
Across cropping regions, modelled upper layer soil moisture in February was generally average across much of the east and west, while some cropping regions in the south saw below average soil moisture.
- In Western Australia, Queensland, Victoria and New South Wales upper layer soil moisture was broadly average, with scattered areas of above average and below average soil moisture distributed across cropping regions.
- In South Australia and western Victoria, upper layer soil moisture was below average.
Average to above average upper layer soil moisture in New South Wales and Queensland is likely to have encouraged the late planting and germination of summer crops for northern cropping regions.
Modelled upper layer soil moisture for February 2025
Source: Bureau of Meteorology (https://awo.bom.gov.au/about/overview)
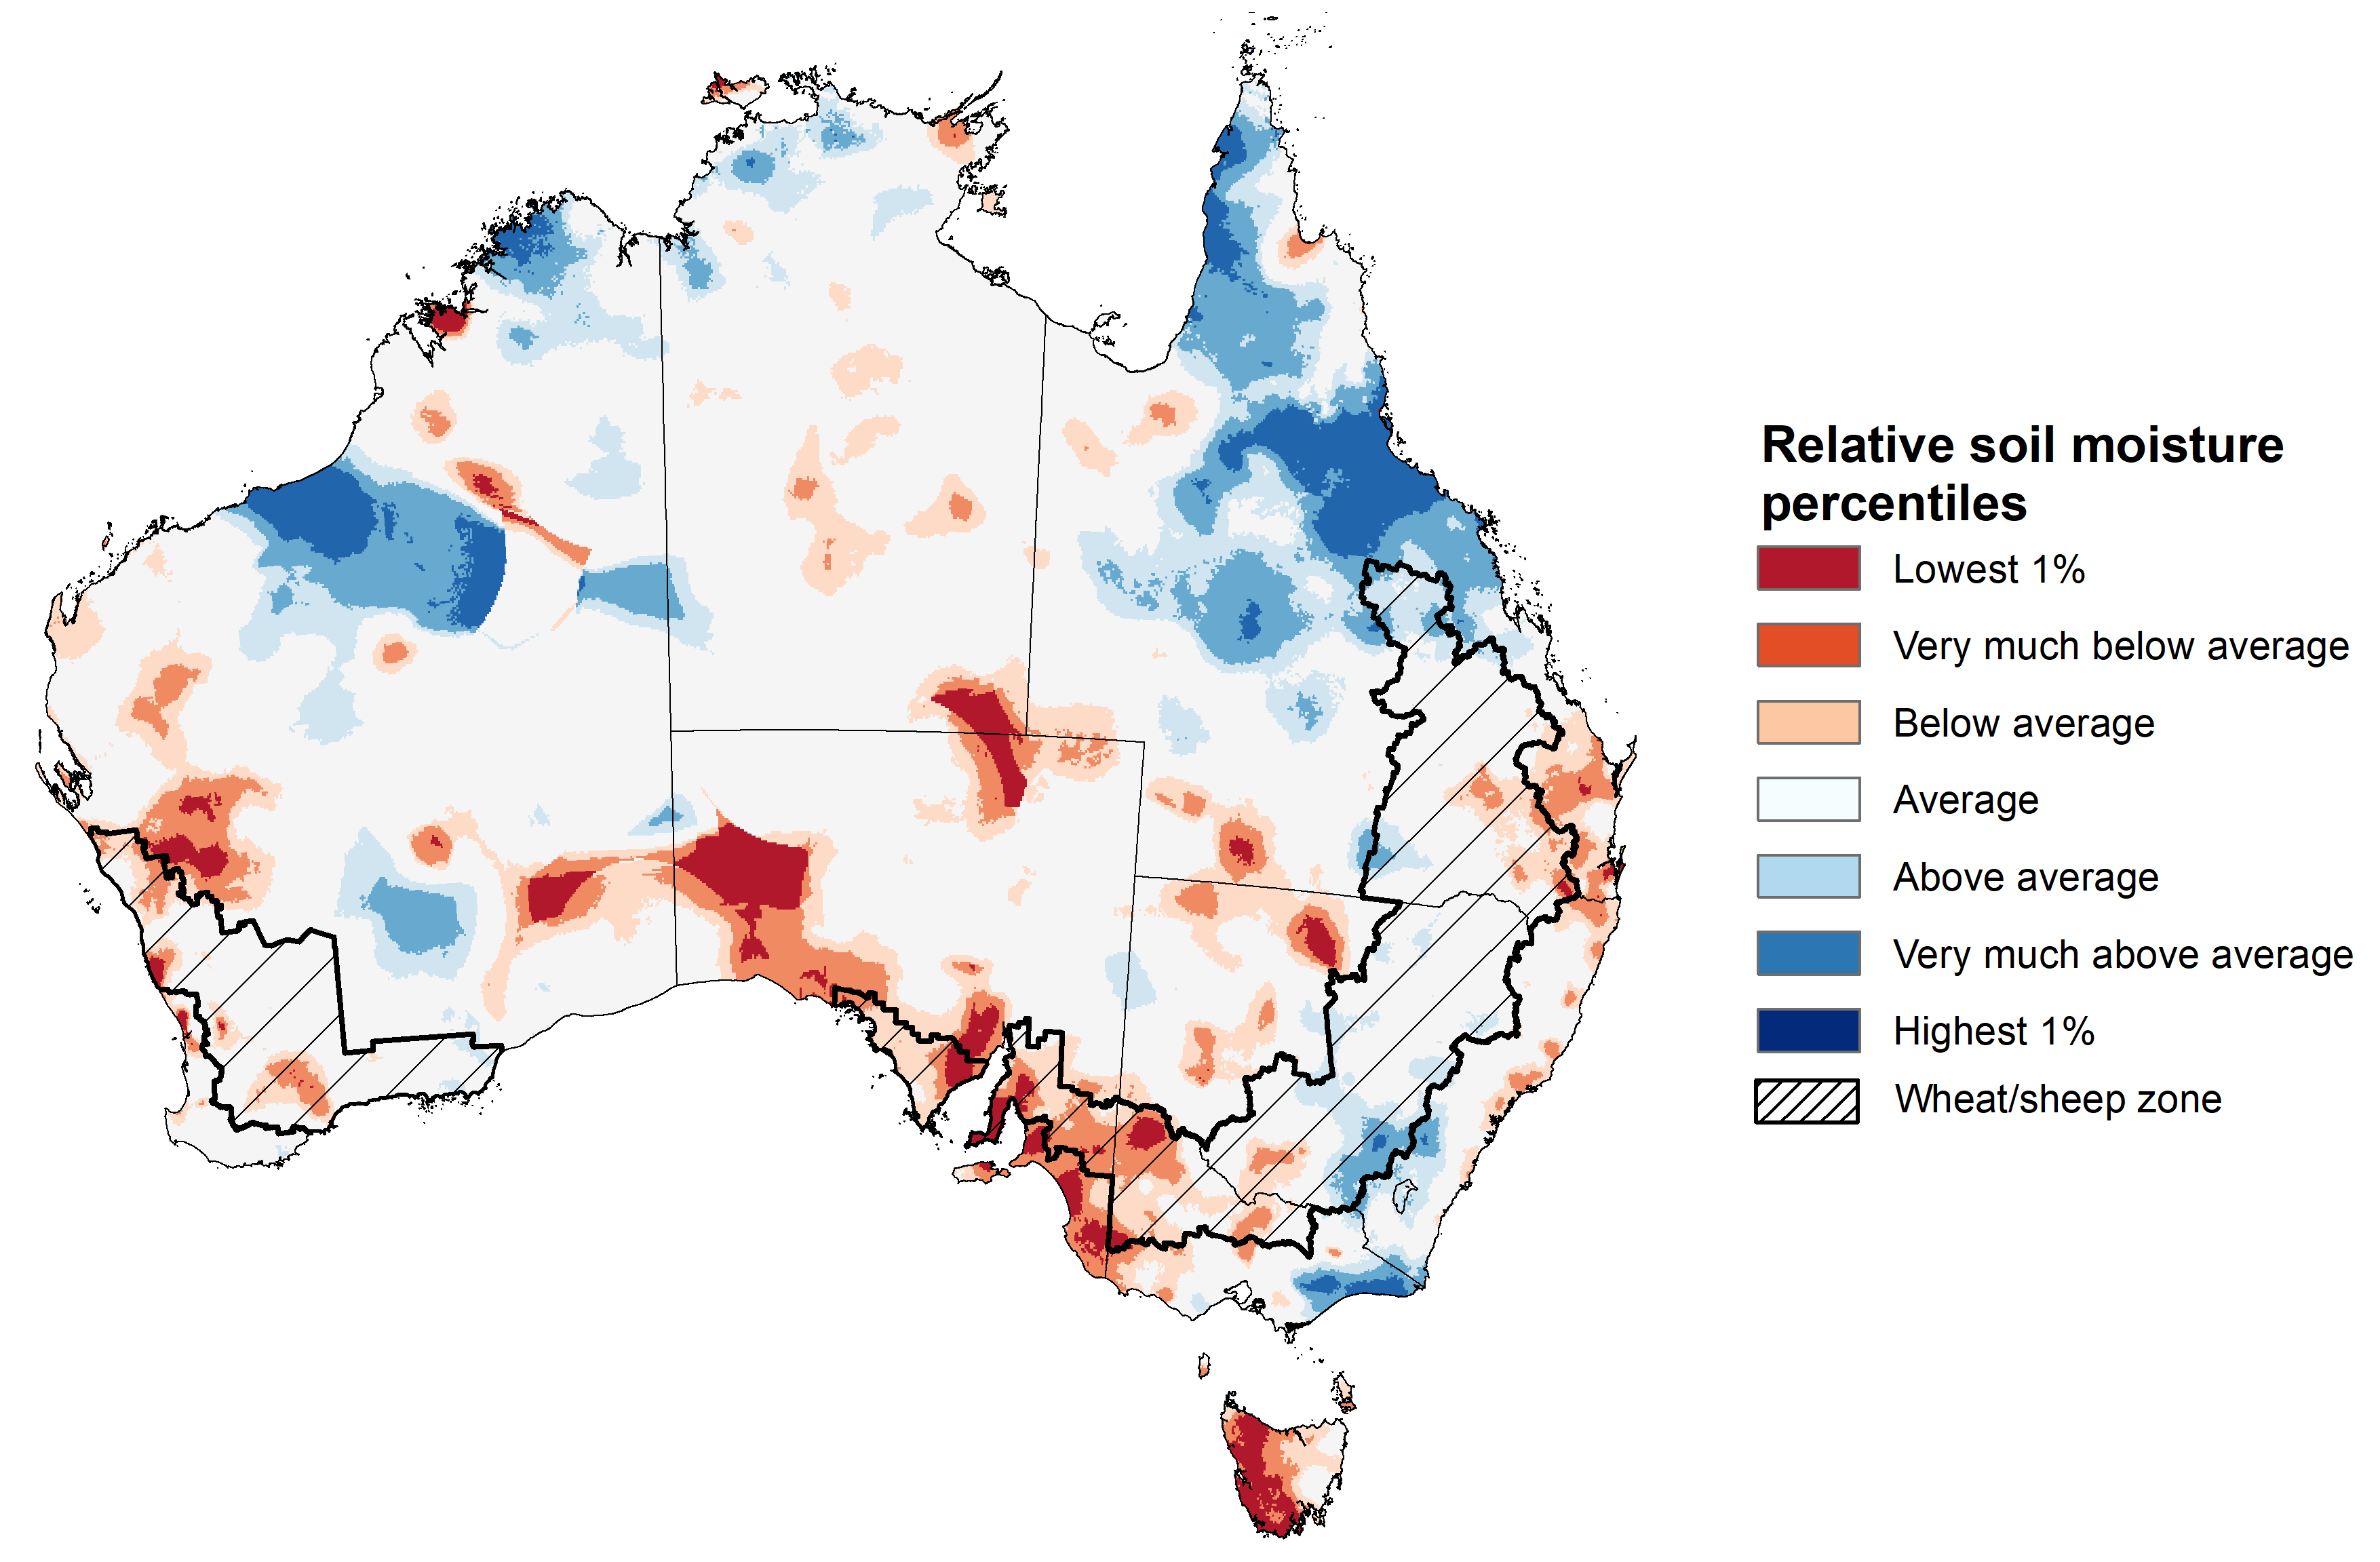
Across much of Australia, modelled lower layer soil moisture in February 2025 was average to very much below average, with areas of above average lower layer soil moisture in the north and east of the country. This represents a continuing draw down in lower layer soil moisture, with average soil moisture still below the recent highs recorded in December 2024.
- Large areas of the south of the Northern Territory, South Australia, western New South Wales, Victoria and southern Western Australia were modelled as having very much below average soil moisture.
- By contrast, much of northern Queensland, eastern New South Wales, eastern Victoria, and northern Western Australia recorded above average to very much above average soil moisture over the period.
At this time of year increased levels of lower layer soil moisture will be important to support summer crops and pasture growth during a peak growth period.
Across cropping regions, modelled lower layer soil moisture was generally above average in the east with areas of extremely low moisture modelled in the south.
- Much of Queensland and New South Wales saw very much above average to average soil moisture.
- In contrast, South Australia, Victoria, parts of southern New South Wales, and parts of southern and northern Western Australia saw below average soil moisture for this time of year.
Average to above average lower layer soil moisture is likely to provide a reserve of plant-available water for summer crops later in the growing season. Agricultural regions across southern Australia with extremely low levels of stored soil moisture will require sufficient and timely rainfall over the remainder of summer to arrest declining levels of pasture availability.
Modelled lower layer soil moisture for February 2025
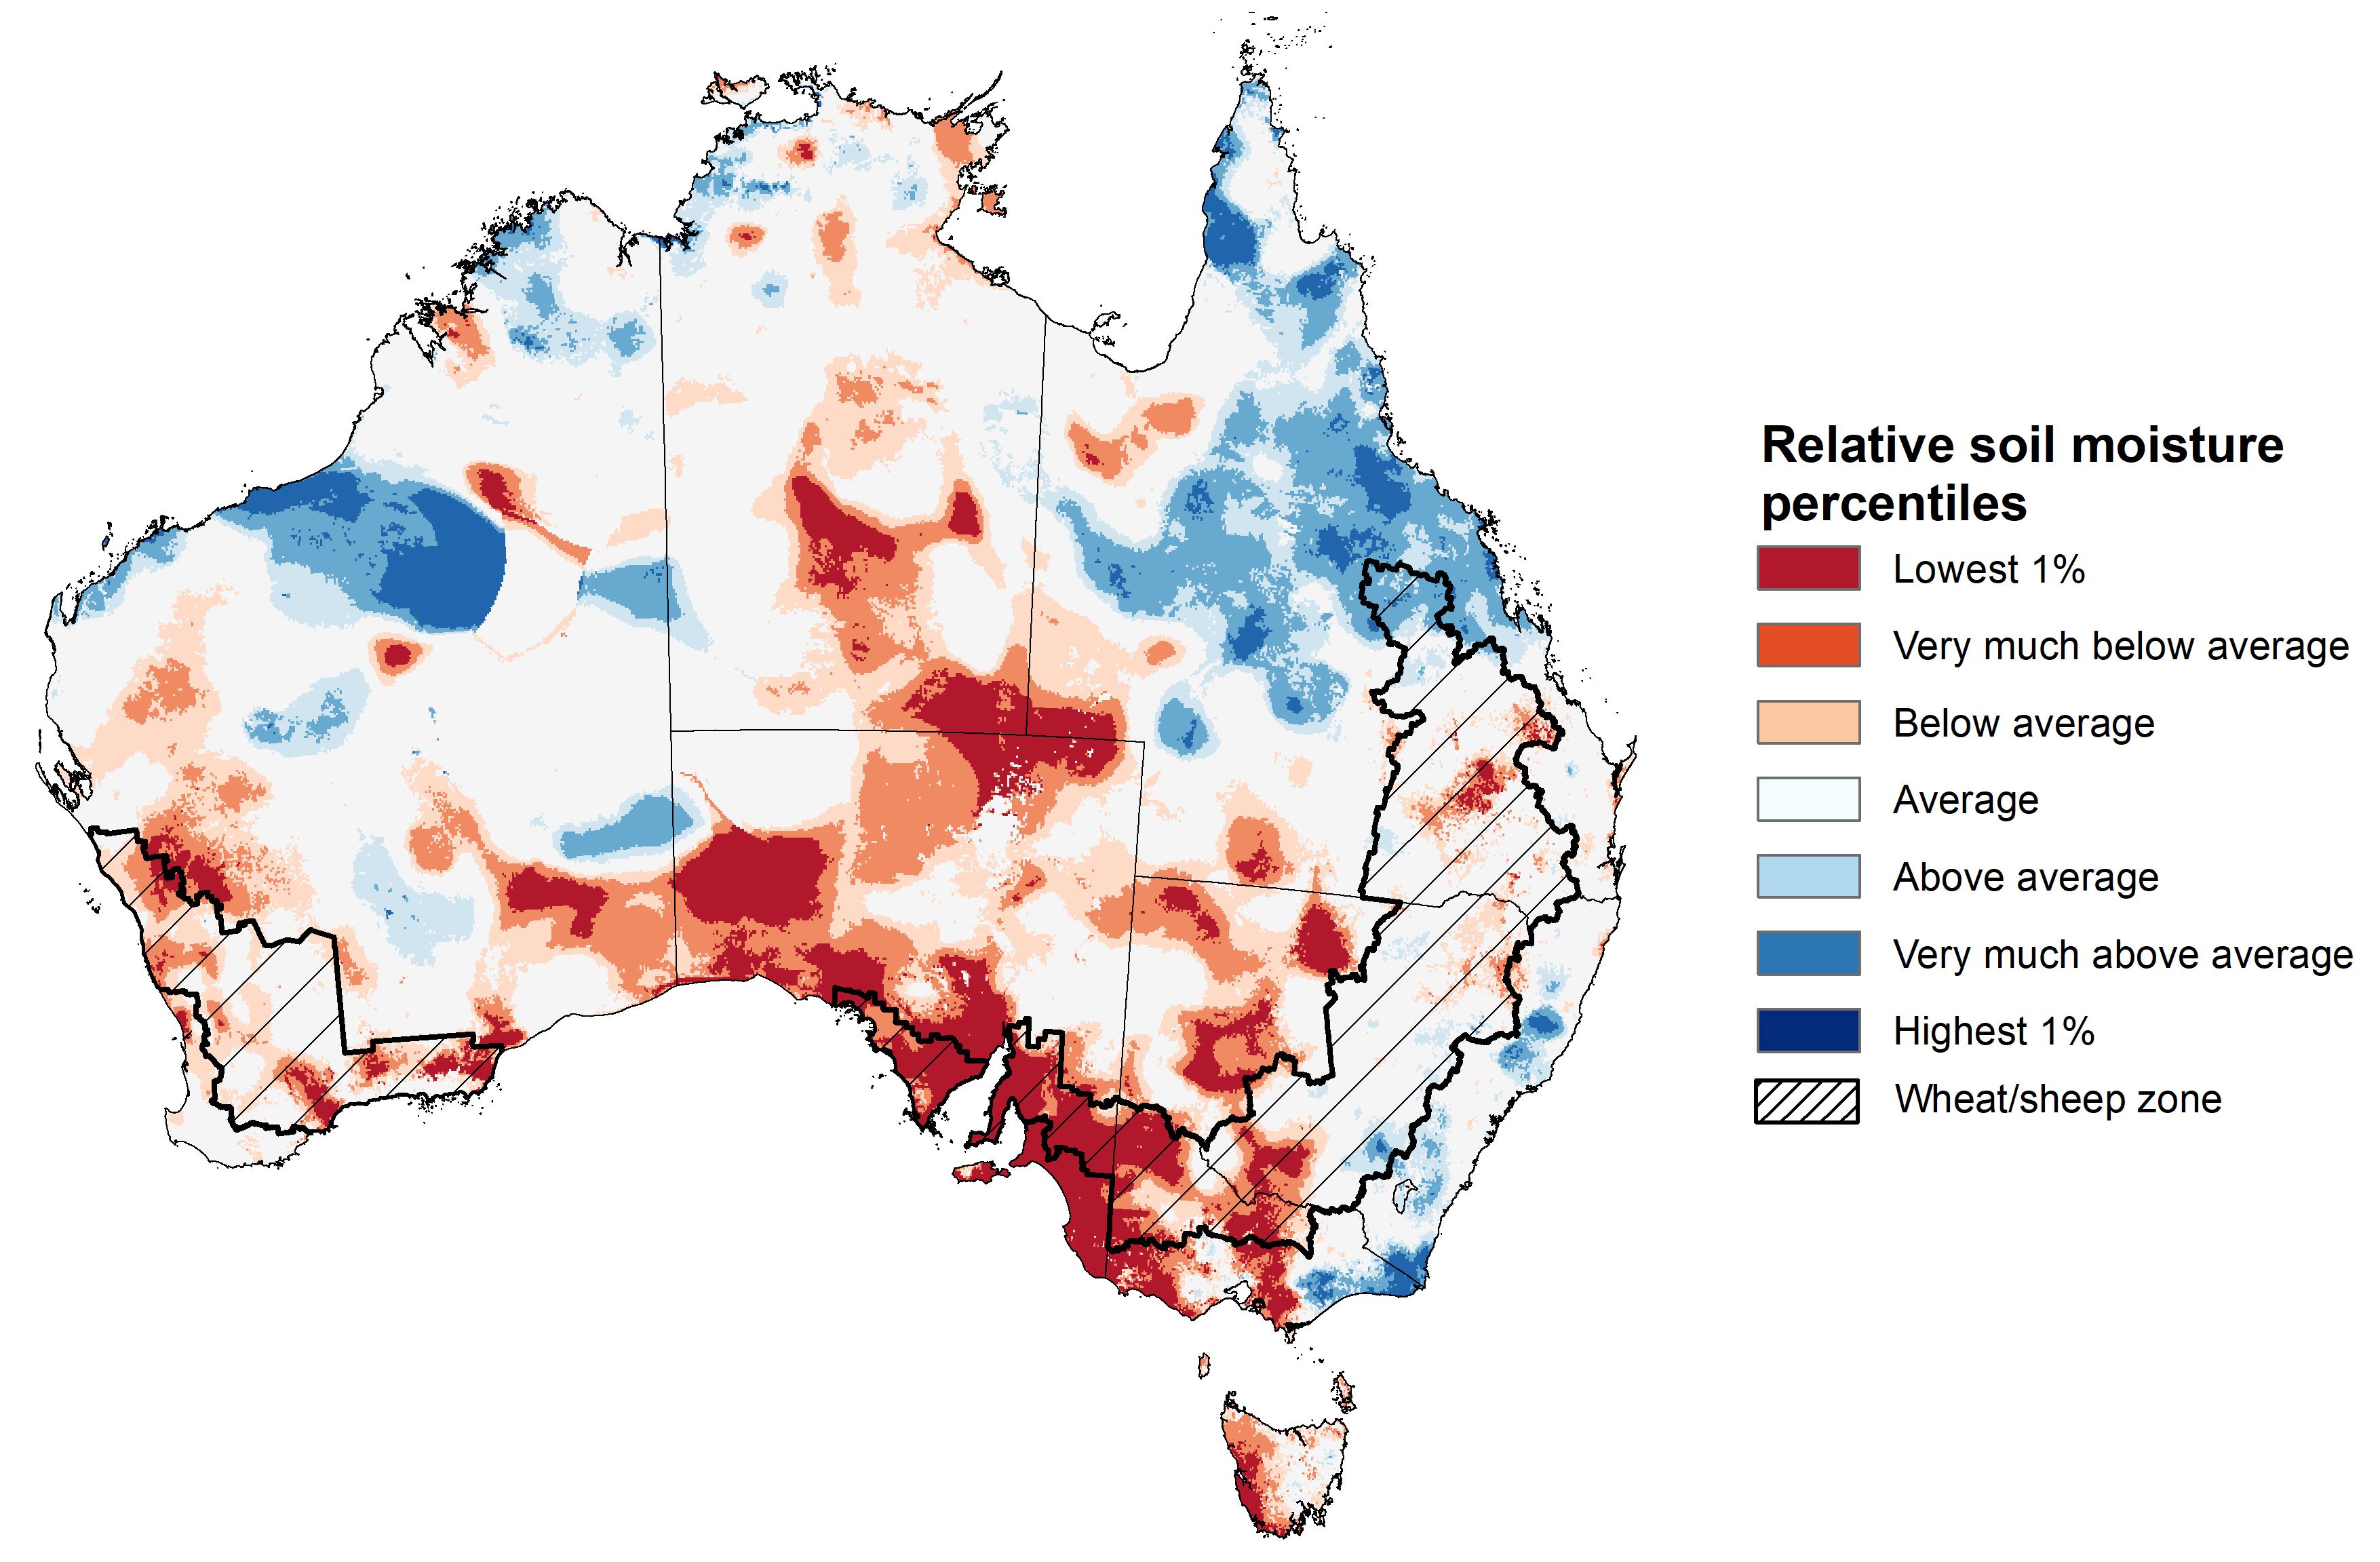
Source: Bureau of Meteorology (https://awo.bom.gov.au/about/overview)
Pasture growth for the three months to February 2025 has been mixed across much of country, with northern and parts or eastern Australia experiencing stronger pasture growth.
- Average to extremely high pasture growth was modelled across much of northern and eastern Australia, including the Northern Territory, northern and eastern Queensland, much of Western Australia, northern Victoria and south-eastern New South Wales.
This pasture growth is expected to support farmers maintaining stock numbers, provide opportunities to build standing dry matter availability and decrease the reliance on fodder to maintain livestock condition over the summer period.
- Extremely low to below average pasture growth was modelled across much of western Tasmania, northern New South Wales, southern Victoria, northern South Australia and part of southern Western Australia and the Northern Territory, and western Queensland.
This lower pasture growth will likely see graziers in affected regions actively destocking or increased reliance on supplemental feed to maintain current stocking rates and production.
Relative pasture growth for 3-months ending February 2025 (1 December to 28 February 2025)
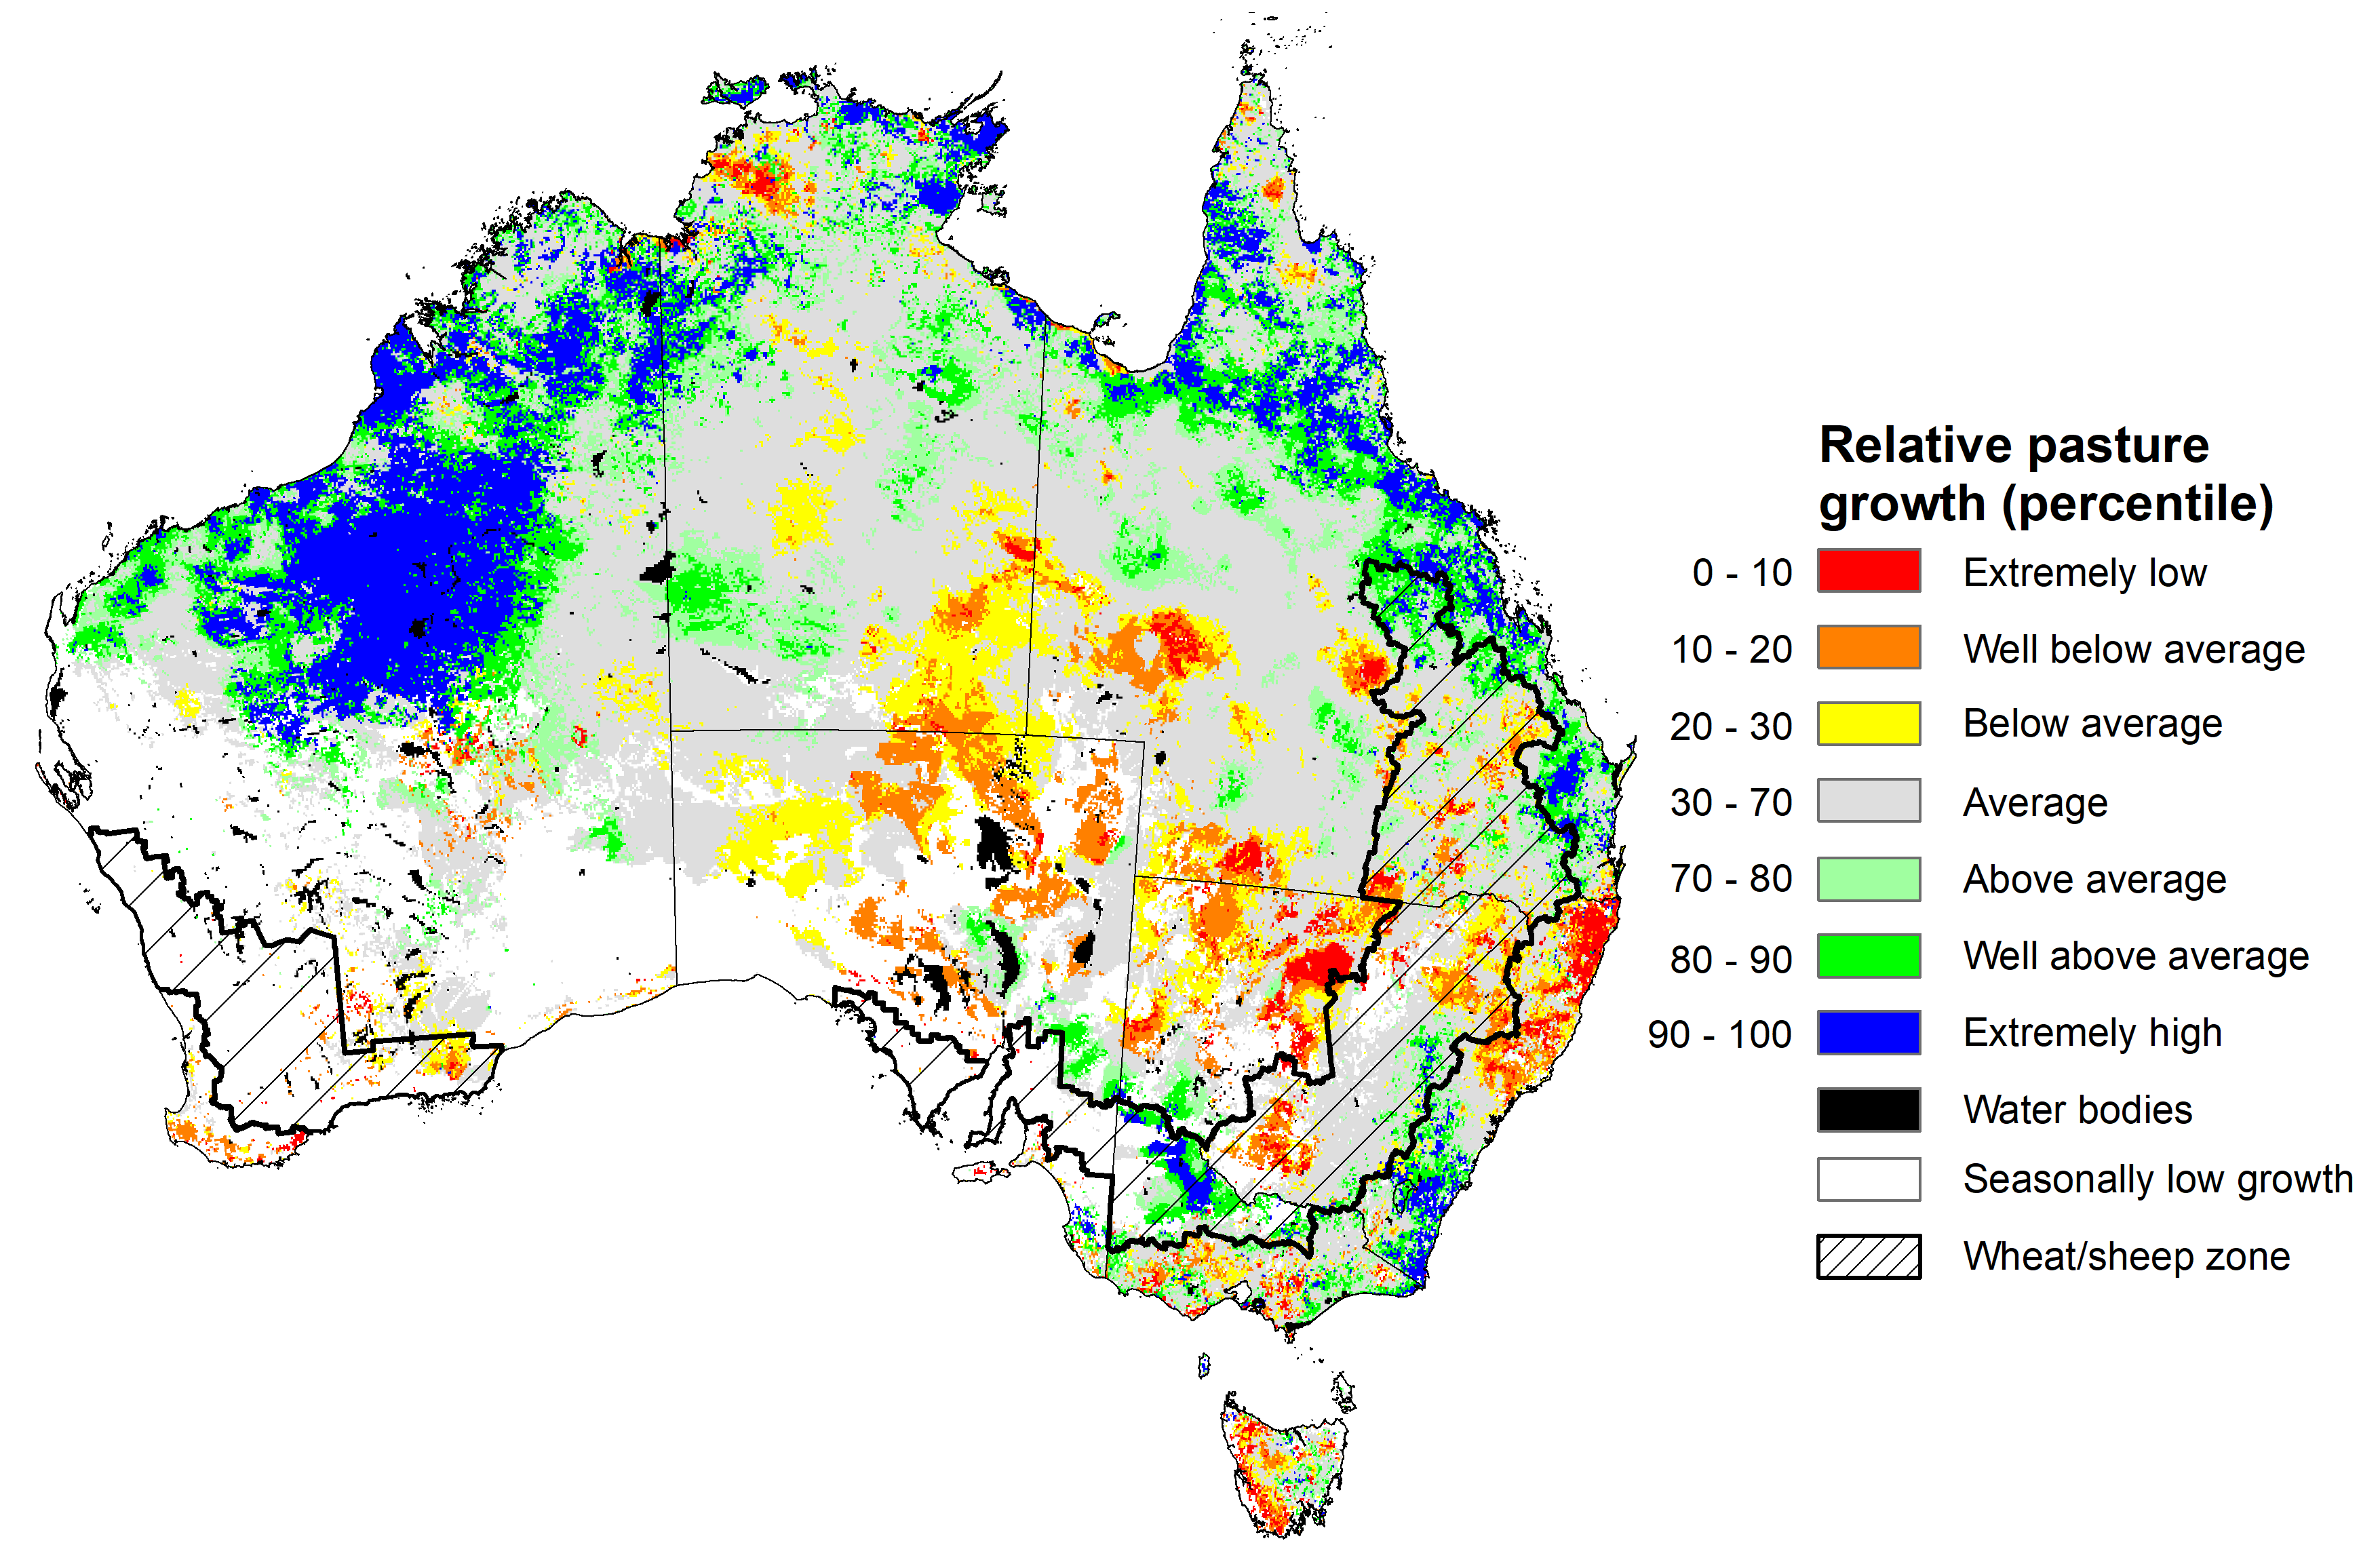
Source: Department of Environment, Science and Innovation
Water
Water storages, water markets and water allocations - current week
The Tableau dashboard may not meet accessibility requirements. For information about the contents of these dashboards contact ABARES.

Commodities
Information on weekly price changes in agricultural commodities is now available at the Weekly commodity price update.