
Key issues
- During the week ending 7 July 2021, low pressure troughs and cold fronts brought moderate rainfall to parts of eastern, south-eastern and south-western Australia.
- The rainfall across some south-eastern Australian cropping regions has provided much needed moisture to parts of central and western South Australia to assist with winter crop germination and establishment. However, cropping regions with below average soil moisture in north-western Victoria and eastern South Australia recorded little rainfall to assist with winter crop germination and establishment.
- Nationally, pasture growth conditions during the 3-months to June 2021 were above average across large areas of eastern and western Australia, but generally below average across parts of southern and northern Australia. As a result, livestock producers in some southern regions will be heavily reliant on rainfall over the remainder of winter to build soil moisture levels and supplementary feeding to maintain current stock numbers.
- A negative Indian Ocean Dipole (IOD) event is looking increasingly likely if current conditions in the Indian Ocean persist. The Southern Annular Mode (SAM) has also recently shifted to positive values. Given current and expected conditions, the IOD and SAM are likely to enhance winter rainfall across parts of Australia.
- The rainfall outlook for August to October 2021 suggests there is a greater than 75% chance of above average rainfall across much of New South Wales, Queensland, northern Victoria, South Australia, as well as parts of Western Australia. If realised this forecast is likely to result in average to above average rainfall totals for most cropping regions and support the ongoing establishment and growth, and eventual yield development, of winter crops.
- Low pressure systems and troughs are likely to bring showers and storms to parts of south-eastern and south-western Australia during the 8 days to 15 July 2021.
- In the next eight days, rainfall totals of between 10 and 50 millimetres are forecast for cropping regions across much of New South Wales and Western Australia, and parts of southern South Australia, Victoria, and Queensland. If realised, the falls forecast across New South Wales, southern Victoria, southern Queensland, and Western Australia will likely support the growth of early sown winter crops. However, further rainfall is likely to exacerbate the effects of waterlogging in some southern Victorian and Western Australian growing regions.
- Water storage in the Murray–Darling Basin (MDB) increased by368 gigalitres (GL) between 29 June 2021 and 6 July 2021. The current volume of water held in storage is 16,508 GL, which represents 65% of total capacity. This is 47% or 5,234 GL more than at the same time last year.
- Allocation prices in the Victorian Murray below the Barmah Choke decreased from $96 per ML on 27 June 2021 to $90 per ML on 30 June 2021. Prices are lower in the Murrumbidgee due to the binding of the Murrumbidgee export limit.
Climate
[expand all]
Rainfall this week
During the week ending 7 July 2021, low pressure troughs and cold fronts brought moderate rainfall to parts of eastern, south-eastern and south-western Australia. High pressure systems restricted rainfall across the remainder of Australia.
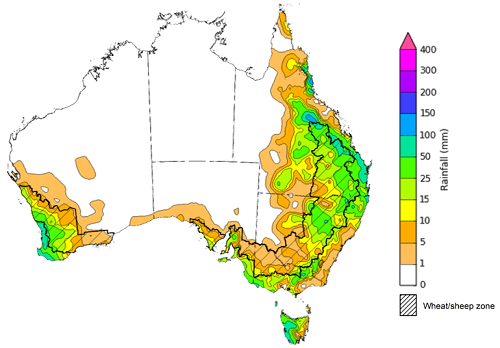
Rainfall totals of between 10 and 50 millimetres were recorded across parts of New South Wales and Victoria, eastern Queensland, the far south of South Australia, the southwest of Western Australia and much of Tasmania. Rainfall totals in excess of 50 millimetres were recorded across isolated parts of north-eastern New South Wales, central and eastern Queensland, eastern Victoria, the far southwest of Western Australia and western Tasmania.
In cropping regions, rainfall totals of between 10 and 50 millimetres were recorded across much of central and northern New South Wales, Queensland, parts of eastern and southern Victoria, and western and central South Australia and western and central Western Australia. Little to no rainfall was recorded across remaining cropping regions in southern New South Wales, northern Victoria and eastern South Australia during the week ending 7 July 2021.
The rainfall across some south-eastern Australian cropping regions has provided much needed moisture to parts of central and western South Australia to assist with winter crop germination and establishment. This rainfall will also support the development of established crops in much of New South Wales and Queensland. Cropping regions with below average soil moisture in north-western Victoria and eastern South Australia recorded little rainfall to assist with winter crop germination and establishment.
Rainfall for the week ending 7 July 2021
©Commonwealth of Australia 2021, Australian Bureau of Meteorology - Issued: 07/07/2021
Note: The rainfall analyses and associated maps utilise data contained in the Bureau of Meteorology climate database, the Australian Data Archive for Meteorology (ADAM). The analyses are initially produced automatically from real-time data with limited quality control. They are intended to provide a general overview of rainfall across Australia as quickly as possible after the observations are received. For further information go to http://www.bom.gov.au/climate/rainfall/
Pasture Growth
Pasture growth during the April to June period affects the availability of fodder to support livestock production across northern Australia as it enters a seasonally low growth period. Across southern Australia, April to June pasture growth influences the amount of plant biomass that is available to support livestock production over the low growth months of winter and the level of reliance on hay and grain during this period.
For the 3 months to June 2021, below average rainfall and generally below average soil moisture limited pasture production across parts of southern and northern Australia. In contrast, average or better rainfall and generally average soil moisture benefitted pasture production across parts of western and eastern Australia.
Modelled pasture growth was extremely low to below average across parts of south-western New South Wales, parts of western and central Queensland, western Victoria, south-eastern South Australia, central and northern Western Australia, and parts of central Northern Territory. As a result, livestock producers in across parts of south-western New South Wales, western Victoria and south-eastern South Australia will be heavily reliant on rainfall over the remainder of winter to build soil moisture levels and supplementary feed to maintain current stock numbers.
In contrast, modelled pasture growth was above average to extremely high across large areas of New South Wales, eastern Queensland, and large areas of Western Australia. This growth is likely to enable farmers to continue to rebuild stock numbers and provide opportunities to replenish fodder supplies during spring.
Relative pasture growth for 3-months ending June 2021 (1 April to 30 June 2021)
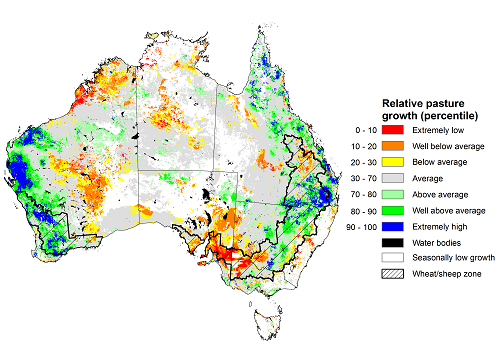
Notes: AussieGRASS pasture growth estimates are relative to the long-term record and shown in percentiles. Percentiles rank data on a scale of zero to 100. This analysis ranks pasture growth for the selected period against average pasture growth for the long-term record (1957 to 2016). Pasture growth is modelled at 5km2 grid cells.
Source: Queensland Department of Science, Information Technology and Innovation
Climate Drivers
Throughout the late winter and early spring period the climate drivers with the largest potential impact on Australia’s climate patterns are the El Niño–Southern Oscillation (ENSO), the Indian Ocean Dipole (IOD) and the Southern Annular Mode (SAM). These climate drivers will likely influence the outlook for Australia’s winter cropping season.
Analysis of oceanic and atmospheric indicators suggest that ENSO conditions remain neutral, reducing its influence on Australia’s climate patterns. International climate models expect the ENSO to remain neutral throughout winter, with two of the seven models predicting the development of a La Niña event in late spring. Meanwhile, sea surface temperatures in the tropical Indian Ocean suggest the continued development of a negative IOD event. The SAM became strongly positive over the preceding couple of weeks. Given current and expected conditions, the IOD and SAM are likely to be the major influences on late winter and early spring rainfall across Australia.
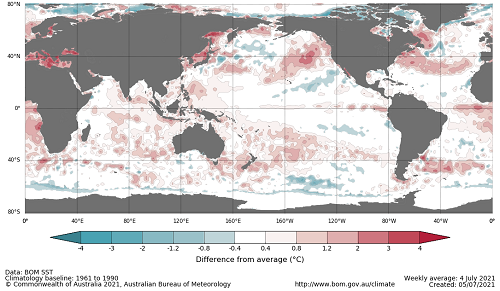
Sea surface temperature anomalies have been close to average across the tropical Pacific Ocean over the previous week. There has been an increase in warm anomalies in the western Pacific, the Maritime continent and along the east coast of Australia. Neutral Pacific equatorial sea surface temperatures are associated with neutral ENSO conditions.
Warm sea surface temperature anomalies have contracted slightly near Western Australia and Indonesia. Meanwhile, sea surface temperatures in the western Indian Ocean remained neutral over the past week. The warm anomalies in the eastern Indian Ocean and the ocean surrounding Australia underpin the ongoing development of a potential negative IOD.
Difference from average sea surface temperature observations 28 June to 4 July 2021
A negative IOD event is looking increasingly likely if current conditions in the Indian Ocean persist. Warmer than average water temperatures in the east Indian Ocean and cooler than average temperatures in the west is associated with above average rainfall across southern Australia throughout winter and spring, as well as the far north. It is also associated with the onset of early northern rainfall.
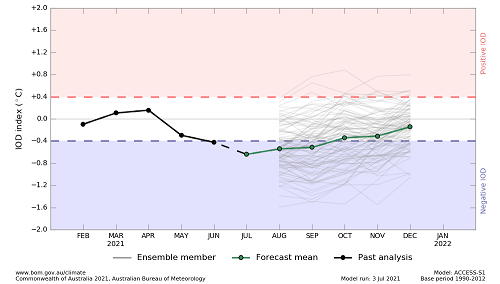
As at 4 July 2021, the Indian Ocean Dipole (IOD) weekly value was -0.27°C. The IOD index has been below the negative IOD threshold (−0.4 °C) for six consecutive weeks prior to this week. While a negative IOD event is not declared until the index has been below the threshold for at least 8 weeks, this pattern can still influence Australian rainfall as the event develops. Forecasts from international climate models surveyed by the Bureau of Meteorology have mixed expectations for the months ahead. Two of the five models predict a negative IOD in July, while three anticipate the IOD remaining neutral. By September, all five models predict a negative IOD, but only one models anticipate the negative IOD to remain until November.
Monthly sea surface temperature anomalies for IOD region
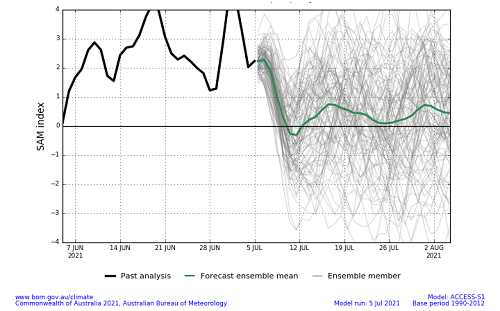
The Southern Annular Mode (SAM) is strongly positive at present, but is expected to return to neutral values and remain neutral over the coming weeks. The SAM refers to the north-south shift of the band of rain-bearing westerly winds and weather systems in the Southern Ocean compared to the usual position. A positive SAM in winter is associated with increased rainfall for parts of eastern Australia. It is also associated with decreased rainfall for western and central Victoria, the south-east of South Australia, the west of Western Australia and Tasmania.
Southern Annular Mode (SAM) daily index
National Climate Outlook
These climate outlooks are generated by ACCESS–S (Australian Community Climate Earth-System Simulator–Seasonal). ACCESS–S is the Bureau of Meteorology's dynamical (physics-based) weather and climate model used for monthly, seasonal and longer-lead climate outlooks.
For further information, go to http://www.bom.gov.au/climate/ahead/about/
The Bureau of Meteorology’s latest rainfall outlook indicated wetter than average conditions are expected for much of northern, central and eastern Australia during August. It should be noted that May marked the beginning of the northern Australian dry season. This means tropical northern Australia typically has very low rainfall totals at this time of year, and only a small amount of rainfall is needed to exceed the average. In contrast, the wetter than average conditions expected in parts of south-eastern Australia are likely influence the outlook for Australia’s winter cropping season.
The outlook for August 2021 indicates that there is a 75% chance of rainfall totals between 10 and 100 millimetres across parts of eastern, south-western and far southern Australia. Rainfall totals in excess of 100 millimetres are expected across parts of Tasmania and isolated parts of south-eastern and south-western Australia.
Across cropping regions there is a 75% chance of rainfall totals of between 5 and 10 millimetres in northern Queensland. There is a 75% chance of rainfall totals between 10 and 50 millimetres for New South Wales, southern Queensland, Victoria, South Australia and Western Australia. If the forecast rainfalls are to eventuate, they will support the ongoing establishment and growth, and eventual yield development, of winter crops.
The cropping regions of western Victoria and eastern South Australia, with below average soil moisture, also have a 75% chance of receiving 10 to 25 millimetres. These falls are likely to be sufficient to support crop grow if adequate rainfall is received during July to initiate the germination and establishment of dry-planted crops.
Rainfall totals that have a 75% chance of occurring August 2021
©Commonwealth of Australia 2021, Australian Bureau of Meteorology - Issued: 01/07/2021
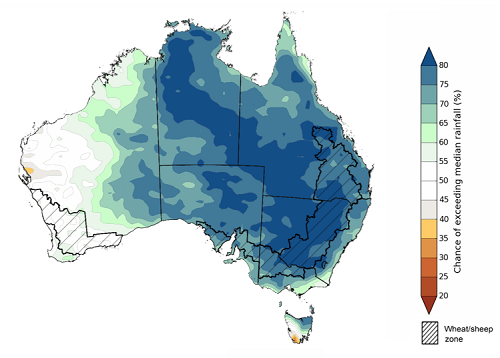
The rainfall outlook for August to October 2021 suggests there is a greater than 75% chance of above average rainfall across much of New South Wales, Queensland, northern Victoria, South Australia, as well as parts of Western Australia and the Northern Territory. There is a less than 40% chance of exceeding median rainfall across isolated parts of Western Australia and southern Tasmania (Bureau of Meteorology ‘National Climate Outlook’, 1 July 2021).
Bureau of Meteorology rainfall outlooks for August to October have greater than 55% past accuracy across most of Australia. Outlook accuracy is greater than 65% across much of New South Wales, central and southern Queensland, South Australia, Western Australia, and much of the Northern Territory.
Chance of exceeding the median rainfall August to October 2021
©Commonwealth of Australia 2021, Australian Bureau of Meteorology - Issued: 01/07/2021
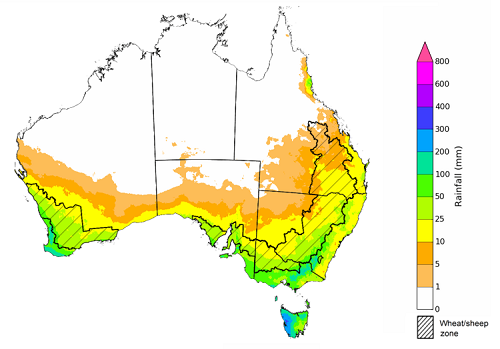
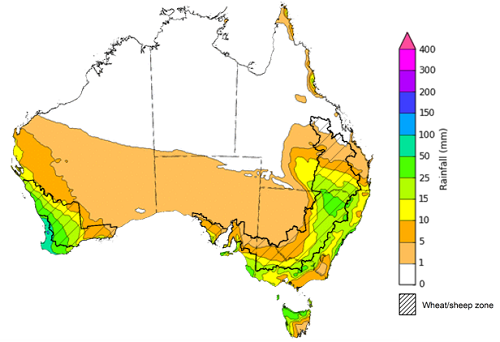
The outlook for August to October suggests there is a 75% chance of rainfall totals between 50 and 200 millimetres across much of New South Wales and Victoria, and parts of south-eastern Queensland, the south of Southern Australia, the south of Western Australia and eastern Tasmania. Rainfall totals in excess of 300 millimetres are likely across parts of alpine regions of New South Wales and Victoria, and the far south-west of Western Australia and western Tasmania.
Across cropping regions, there is a 75% chance of receiving between 50 and 200 millimetres in New South Wales, Victoria, South Australia and Western Australia, as well as much of Queensland. Totals of less than 50 millimetres are expected in far northern cropping regions of Queensland.
These rainfall totals are average to above average for this three-month period across most cropping regions. Above average soil moisture levels in New South Wales, and parts of Queensland and Western Australia and the probability of close to average in-season rainfall in August to October will assist with maintaining current yield potential in winter crops.
Rainfall totals that have a 75% chance of occurring August to October 2021
©Commonwealth of Australia 2021, Australian Bureau of Meteorology - Issued: 01/07/2021
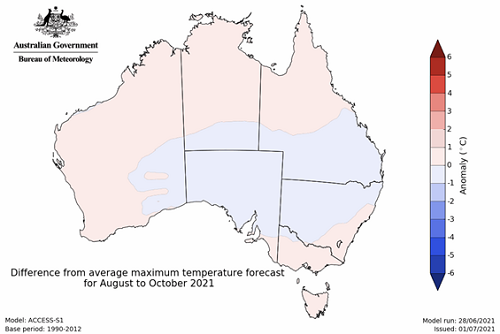
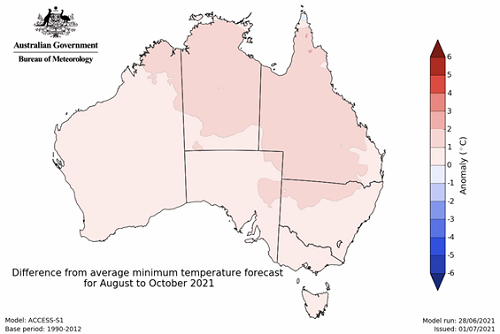
The temperature outlook for August to October 2021 indicates that maximum temperatures across most of Australia are likely to be close to the 1990-2012 average (- 1°C to 1°C). Minimum temperatures are expected to be slightly above average for much of Queensland and parts of northern New South Wales, Western Australia and the Northern Territory (Bureau of Meteorology ‘National Climate Outlook’, 1 July 2021).
Predicted maximum temperature anomaly for August to October 2021
Predicted minimum temperature anomaly for August to October 2021
Rainfall forecast for the next eight days
Low pressure systems and troughs are likely to bring showers and storms to parts of south-eastern and south-western Australia during the 8 days to 15 July 2021. High-pressure systems are expected to keep rainfall totals low for the majority of central and northern Australia during the next 8 days.
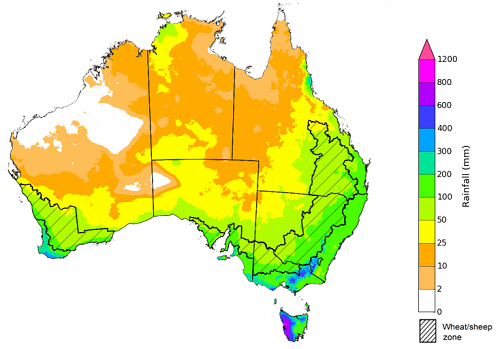
Rainfall totals of between 10 and 50 millimetres are forecast for much of eastern New South Wales. and parts of southern Queensland, central Victoria, southern South Australia and southern Western Australia and northern Tasmania. Rainfall in excess of 50 millimetres is forecast for the far southwest of Western Australia.
In Australia’s cropping regions, rainfall totals of between 10 and 50 millimetres are forecast for much of New South Wales and Western Australia, and parts of southern South Australia, Victoria, and Queensland. Rainfall totals of between 1 and 10 millimetres is expected across cropping regions in south-western New South Wales, central Queensland, northern Victoria, much of South Australia and parts of south-eastern Western Australia.
If realised, the falls forecast across New South Wales, southern Victoria, southern Queensland, and Western Australia will likely support the growth of early sown winter crops.
The dry forecast for the next 8 days across cropping regions in northern Queensland, southern New South Wales and parts of South Australia and Western Australia will allow for the finalisation of planting programs and the application of fertilizer and post-emergent weed control following this week’s rain. However further rainfall is likely to exacerbate the effects of waterlogging in some southern Victorian and Western Australian growing regions.
Total forecast rainfall (mm) for the period 8 July to 15 July 2021
©Commonwealth of Australia 2021, Australian Bureau of Meteorology - Issued: 8/07/2021
Water
Water storages, water markets and water allocations - current week
The Tableau dashboard may not meet accessibility requirements. For information about the contents of these dashboards contact ABARES.

Commodities
Information on weekly price changes in agricultural commodities is now available at the Weekly commodity price update.