
Key issues
- For the week ending 12 January 2022, troughs extending across eastern Australia resulted in storms and significant rainfall across southern Queensland, New South Wales, Victoria, and Tasmania. Tropical cyclones and seasonal thunderstorms were also active during the week, bringing significant rainfall to the northern regions of Queensland, Western Australia, and the Northern Territory.
- December 2021 was drier than normal compared to the December long-term average. Below average rainfall during December is likely to have allowed the harvest of winter crop to proceed without delay in Victoria, South Australia and Western Australia.
- Across New South Wales, Victoria and Queensland above average pasture production will likely enable farmers to continue to rebuild stock numbers and provide opportunities to replenish fodder supplies during spring and early summer.
- ENSO indicators suggest that La Niña remains active in the tropical Pacific. Most climate models suggest the 2021–22 La Niña will persist until early in the southern hemisphere autumn. La Niña events are associated with above-average rainfall for northern and eastern Australia during summer.
- The outlook for February 2022 indicates that there is a 75% chance of rainfall totals between 10 and 100 millimetres across most of eastern New South Wales, eastern and northern Queensland, eastern Victoria, and the north of the Northern Territory and Western Australia. Rainfall totals in excess of 100 millimetres are expected in parts of north-eastern New South Wales, northern Queensland, and the north of the Northern Territory and Western Australia.
- The outlook for February to April 2022 suggests there is a 75% chance of rainfall totals between 50 and 300 millimetres across much of eastern New South Wales, Queensland, southern Victoria, northern Western Australia, the Northern Territory and Tasmania. Rainfall totals in excess of 300 millimetres are forecast for north-eastern New South Wales and parts of eastern and northern Queensland, as well as northern parts of Western Australia and the Northern Territory.
- Over the 8-days to 20 January 2022, rainfall is expected across much of Australia. Ex-tropical cyclone Tiffany and low-pressure troughs are expected to bring heavy rain and storms to large areas of Australia’s tropical north, as well as large area of central and eastern Australia.
- Water storage in the Murray–Darling Basin (MDB) increased by 179 gigalitres (GL) between 4 January 2022 and 11 January 2022. The current volume of water held in storage is 22,601 GL, which represents 89% of total capacity. This is 57% or 8,208 GL more than at the same time last year.
- Allocation prices in the Victorian Murray below the Barmah Choke increased from $98 per ML on 31 December 2021 to $99 per ML on 7 January 2022. Prices are lower in the Goulburn-Broken, Murrumbidgee, and regions above the Barmah Choke due to the binding of the Goulburn intervalley trade limit, Murrumbidgee export limit, and Barmah Choke trade constraint.
Climate
For the week ending 12 January 2022, troughs extending across eastern Australia resulted in storms and significant rainfall across southern Queensland, New South Wales, Victoria, and Tasmania. Tropical cyclones and seasonal thunderstorms were also active during the week, bringing significant rainfall to the northern regions of Queensland, Western Australia and the Northern Territory.
Rainfall totals of between 10 and 50 millimetres were recorded across much of eastern and central New South Wales and Victoria, eastern Queensland, and the north of Western Australia and the Northern Territory, and Tasmania. Rainfall totals in excess of 50 millimetres were recorded in eastern Victoria, south-eastern New South Wales, along the east coast and the Cape York Peninsula in Queensland, and northern parts of the Northern Territory and Tasmania. Meanwhile, little to no rainfall was recorded across the rest of country, including central Australia, South Australia and southern Western Australia.
In cropping regions, rainfall totals of between 10 and 150 millimetres were recorded across much of New South Wales, with falls of between 10 and 150 millimetres being recorded across parts of Queensland an eastern Victoria. Little to no rainfall was recorded across remaining cropping regions in Queensland, Victoria, South Australia and Western Australia.
Significant rainfall in parts of southern Queensland triggered localised flood warnings for various areas in the southeast, including the Mary River in Maryborough. While river levels had begun receding across most areas by Monday, parts of the Mary River remained flooded. The impact of persistent rainfall and flooding throughout November and December has slowed harvesting and degraded some crops in areas of New South Wales and Queensland. Above average soil moisture levels are likely to have benefited summer crop yields in Queensland and New South Wales.
Rainfall for the week ending 12 January 2022
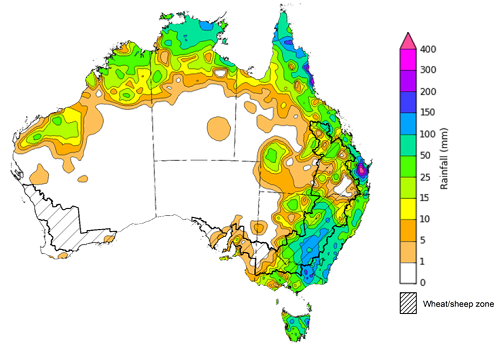
Note: The rainfall analyses and associated maps utilise data contained in the Bureau of Meteorology climate database, the Australian Data Archive for Meteorology (ADAM). The analyses are initially produced automatically from real-time data with limited quality control. They are intended to provide a general overview of rainfall across Australia as quickly as possible after the observations are received. For further information go to http://www.bom.gov.au/climate/rainfall/
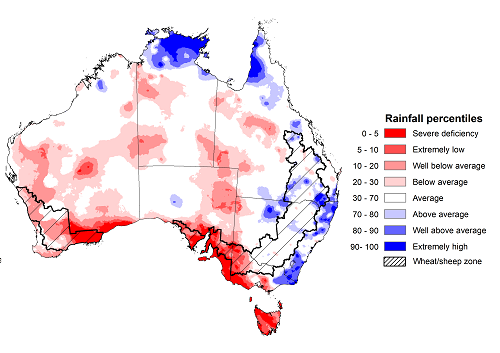
Rainfall during December 2021 was 6% below average for Australia as a whole. Severely deficient to below average rainfall was recorded across Tasmania, southern and eastern South Australia, western and southern Victoria, and southern Western Australia. However, scattered areas of above average to extremely high rainfall were recorded along the east coast of New South Wales and around the Gulf of Carpentaria in Queensland, and the northern parts of the Northern Territory.
The active La Niña event on the Pacific was the main climate influence during the month contributing to above average rainfall across parts of eastern and northern Australia. Meanwhile, the Southern Annular Mode (SAM) fluctuated between positive and neutral values throughout the month, likely contributing to the dryness along the southern and western coasts of the mainland and Tasmania.
December rainfall was average to above average across cropping regions of New South Wales and Queensland, with below average falls dominated cropping regions in Victoria, South Australia and Western Australia.
Below average rainfall in December benefited the harvest of winter crops across Victoria, South Australia and Western Australia. While average December rainfall allowed harvest activities to recommence in across New South Wales, following severe disruptions in November due to heavy rainfall.
Rainfall percentiles for December 2021
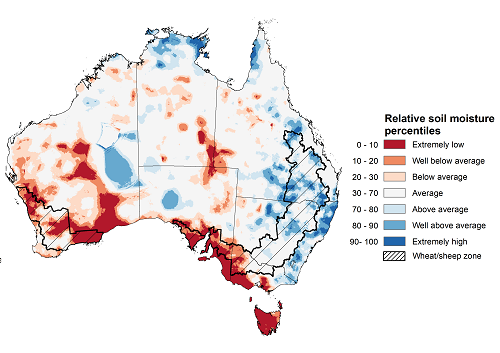
Upper layer soil moisture in December 2021 was generally average for this time of year across most of Australia, following reduced rainfall throughout the month. Modelled upper layer soil moisture was extremely low for large areas of the southern Australian coastline, as well as Tasmania in keeping with well below average rainfall in these areas during December. Above average soil moisture remained evident across large areas of New South Wales, Queensland and the Northern Territory, reflecting rainfall patterns during December.
At this time of year, upper layer soil moisture is important for late planted summer crops in northern New South Wales and Queensland and for pasture growth across northern Australia since plant germination and establishment utilise this moisture. It is also important indicator of the ability to access paddocks to undertake harvest and planting activities.
Upper layer soil moisture was average to above average for this time of year across most cropping regions in New South Wales and Queensland. Upper layer soil moisture was extremely low to average for Western Australia, South Australia and Victoria. Lower levels of upper layer soil moisture would have allowed uninterrupted paddock access to progress the winter crop harvest in southern Australia, while average moisture in the northern cropping regions likely encouraged plant germination and encourage planting activity.
Modelled upper layer soil moisture for December 2021
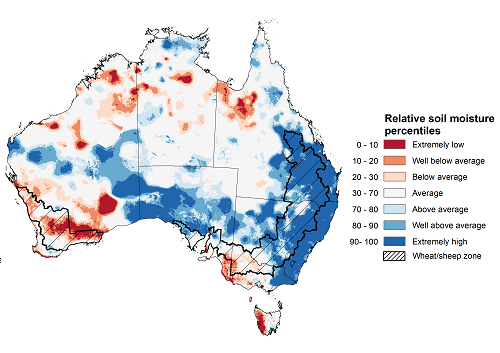
Lower layer soil moisture for December 2021 was well above average to extremely high for this time of year across large areas of eastern and southern Australia. Lower layer soil moisture was below average to well below average across western Tasmania and scattered areas of western and northern Australia, as well as along the southern border between South Australia and Victoria.
In cropping regions, lower layer soil moisture was well above average to extremely high for much of New South Wales and Queensland, and average to well below average for South Australia and Western Australia. High levels of lower layer soil moisture will continue to support above average yield prospects for summer crops and above average pasture growth rates for this time of year across New South Wales and southern Queensland.
Modelled lower layer soil moisture for December 2021
Pasture growth during the October to December period is typically low across large areas of Western Australia reflecting low rainfall totals at this time of year. Across southern Australia, October to December is the peak pasture growth period which typical provides a bulk of feed and allow for fodder conservation to maintain production through the low pasture growth months of late summer. It also influences the growth and branding and marking rates of lambs and calves, and the production of meat, milk, and wool over this peak production period.
For the 3 months to December 2021, above average rainfall totals and mild temperatures resulted in average to well above average pasture production for this time of year across most grazing regions in Queensland, New South Wales and Victoria. Extremely low to below average pasture growth rates were recorded across southern Western Australia, consistent with above average temperatures and below average rainfall.
Average to extremely high pasture production across much of New South Wales, Victoria and Queensland will likely enable farmers to continue to rebuild stock numbers and provide opportunities to replenish fodder supplies during spring and early summer. Below average pasture growth in Western Australia may have restricted late spring pasture growth, however it comes after extremely high pasture growth during winter that supplied average to above average pasture availability.
Relative pasture growth for 3-months ending December 2021 (1 October to 31 December 2021)
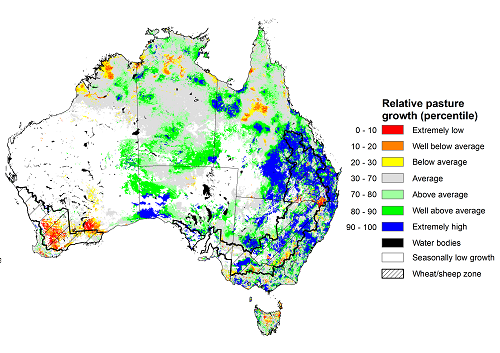
Source: Queensland Department of Science, Information Technology and Innovation
Throughout summer the climate drivers with the largest potential impact on Australia’s climate patterns are the El Niño–Southern Oscillation (ENSO), the Southern Annular Mode (SAM) and the Madden-Julian Oscillation (MJO). These climate drivers are likely to influence the growth and development of summer crops in northern growing regions and pasture growth across northern Australia with the onset of the northern wet season.
ENSO indicators suggest that La Niña remains active in the tropical Pacific. La Niña events are associated with above-average rainfall for northern and eastern Australia during summer. Climate models suggest the 2021–22 La Niña will persist until early in the southern hemisphere autumn. The presence of La Niña atmospheric and oceanic patterns is likely to influence rainfall patterns in northern and eastern Australia over the coming months.
The SAM currently neutral and the MJO is inactive in the Australian region reducing their influence on climatic conditions in Australia.
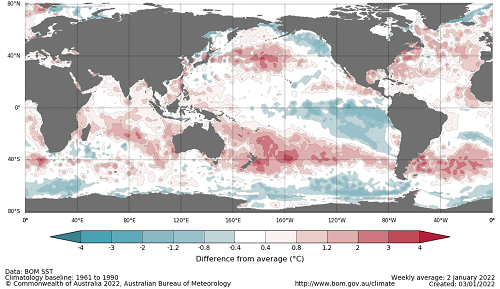
Both warm and cool sea surface temperature (SST) anomalies across the tropical Pacific Ocean remain similar to two weeks ago and show a well-developed La Niña pattern.
Difference from average sea surface temperature observations 27 December 2021 to 2 January 2022
International climate model outlooks for the NINO 3.4 region in February 2022
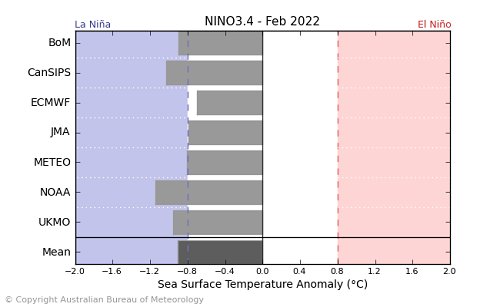
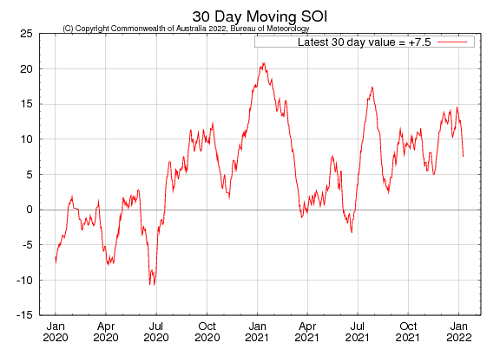
A La Niña event has become firmly established in the Pacific Ocean. Most climate models surveyed by the Bureau of Meteorology expect the La Niña event to continue into February. However, six of the seven models expect it to dissipate by March 2022. For the period ending 2 January 2022, the 30-day SOI was +12.7 and the 90-SOI was +10.7, both above the La Niña threshold of +7. Above average SST anomalies have continued across parts of the Maritime Continent and northern Australia. A slight strengthening of trade winds across parts of the central and western Pacific, while cloudiness near the Date Line has been consistently below average. All indications consistent with an ongoing La Niña event.
30-day Southern Oscillation Index (SOI) values ending 13 January 2022
These climate outlooks are generated by ACCESS–S (Australian Community Climate Earth-System Simulator–Seasonal). ACCESS–S is the Bureau of Meteorology's dynamical (physics-based) weather and climate model used for monthly, seasonal and longer-lead climate outlooks.
For further information, go to http://www.bom.gov.au/climate/ahead/about/
The Bureau of Meteorology’s latest rainfall outlook indicated wetter than average conditions are expected across parts of eastern Australia during February. The ACCESS-S climate model suggests there is close to a 60% chance of exceeding median February rainfall totals across parts of eastern New South Wales and Queensland.
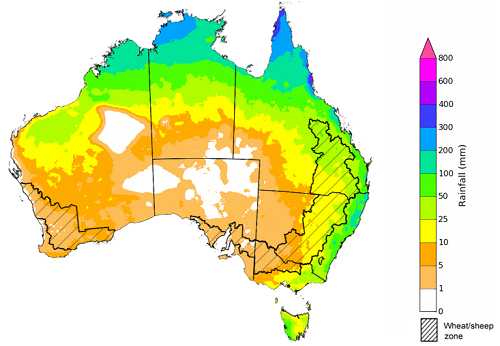
The outlook for February 2022 indicates that there is a 75% chance of rainfall totals between 10 and 100 millimetres across most of eastern New South Wales, eastern and northern Queensland, eastern Victoria, and the north of the Northern Territory and Western Australia. Rainfall totals in excess of 100 millimetres are expected in parts of north-eastern New South Wales, northern Queensland, and the north of the Northern Territory and Western Australia.
Across cropping regions there is a 75% chance of rainfall totals of between 10 and 50 millimetres across much of New South Wales and Queensland. There is a 75% chance of rainfall less than 10 millimetres for most remaining cropping regions. The wetter than average conditions expected for most eastern Australian cropping regions is likely to support the growth and development of early-planted summer crops, as well as the establishment of late-planted summer crops in New South Wales and Queensland.
Rainfall totals that have a 75% chance of occurring February 2022
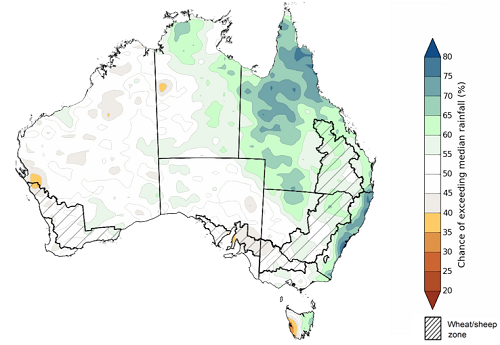
The rainfall outlook for February to April 2022 suggests there is a greater than 60% chance of exceeding median rainfall across parts of eastern and northern New South Wales, Queensland, and the north of the Northern Territory. For remaining regions of Australia, there is roughly an equal chance of above and below median rainfall, with only isolates areas of Western Australia and western Tasmania expecting to receive below average rainfall between February to April 2022 (Bureau of Meteorology ‘National Climate Outlook’, 6 January 2022).
Bureau of Meteorology rainfall outlooks for February to April have greater than 55% past accuracy across most of Australia. Outlook accuracy is greater than 65% across isolated parts of the country. However, there is low past accuracy for parts of north-western New South Wales, western Queensland, central Western Australia, as well as south-eastern parts of the Northern Territory.
Chance of exceeding the median rainfall February to April 2022
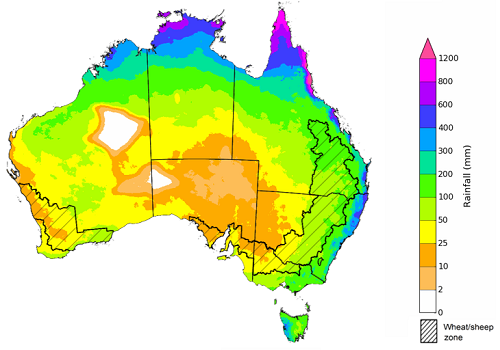
The outlook for February to April 2022 suggests there is a 75% chance of rainfall totals between 50 and 300 millimetres across much of eastern New South Wales, Queensland, southern Victoria, northern Western Australia, the Northern Territory and Tasmania. Rainfall totals in excess of 300 millimetres are forecast for north-eastern New South Wales and parts of eastern and northern Queensland, as well as northern parts of Western Australia and the Northern Territory.
Across cropping regions, there is a 75% chance of receiving between 50 and 200 millimetres across much of New South Wales, Queensland and eastern Victoria. Totals of less than 50 millimetres are expected across remaining cropping regions in Victoria, and South Australia and Western Australia.
These rainfall totals are below average for this three-month period across most cropping regions. Soil moisture levels across northern cropping regions are well above average due to the substantial rainfall in November and early December. Therefore, below average rainfall during the February to April period is unlikely to negatively impact summer crop growth and yield prospects.
Rainfall totals that have a 75% chance of occurring February to April 2022
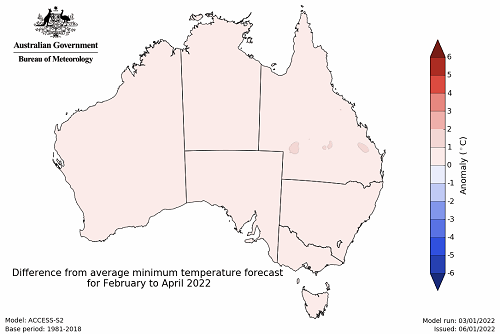
The temperature outlook for February to April 2022 indicates that maximum and minimum temperatures across most of Australia are likely to be close to the 1990-2012 average (- 1°C to 1°C), with isolated patches of above average maximum temperatures in Western Australia. Minimum temperatures are expected to be slightly above average for parts of central Queensland (Bureau of Meteorology ‘National Climate Outlook’, 6 January 2022).
Predicted maximum temperature anomaly for February to April 2022

Predicted minimum temperature anomaly for February to April 2022
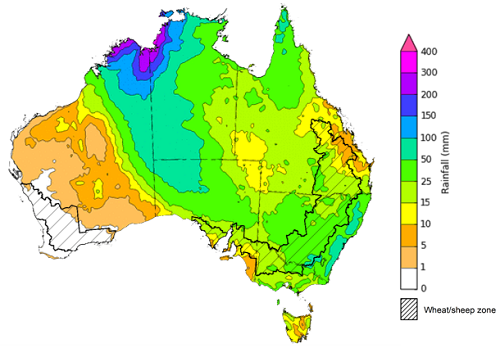
Over the 8-days to 20 January 2022, rainfall is expected across much of Australia. Ex-tropical cyclone Tiffany and low-pressure troughs are expected to bring heavy rain and storms to large areas of Australia’s tropical north, as well as large area of central and eastern Australia. Meanwhile, high pressure systems are expected to bring mostly dry conditions to much of Western Australia.
Rainfall totals of between 10 and 50 millimetres are forecast for New South Wales and Victoria, as well as Queensland, South Australia, the Northern Territory and eastern Western Australia. Rainfall in excess of 50 millimetres is expected across much of New South Wales, northern parts of Queensland and South Australia, the northeast of Western Australia and much of the Northern Territory.
In Australian cropping regions, rainfall totals of between 10 and 50 millimetres are expected across New South Wales and Victoria, as well as most of Queensland and South Australia. Little to no rainfall is forecast for remaining cropping regions in Queensland, as well as cropping regions of Western Australia during the next 8-days.
Soil moisture levels across eastern Australian cropping regions remain well above average. The forecast rainfall for parts of New South Wales, Queensland and Victorian cropping regions may saturate soil profiles and delay harvesting activities for those areas of New South Wales and Victoria yet to harvest winter crops. Likewise, further rainfall may prevent the harvest of early planted summer crops in northern New South Wales and southern Queensland. However, the falls are likely to benefit pasture growth across affected areas and extent the growing season across southern growing regions.
Total forecast rainfall (mm) for the period 13 January to 20 January 2022
Water
Water storages, water markets and water allocations - current week
The Tableau dashboard may not meet accessibility requirements. For information about the contents of these dashboards contact ABARES.

Commodities
Information on weekly price changes in agricultural commodities is now available at the Weekly commodity price update.