
Key issues
- During the 7 days to 24 February 2021, troughs, low-pressure systems, cold fronts and onshore flow generated showers and thunderstorm activity across parts of northern, western and eastern Australia. In those summer cropping regions that recorded rainfall this week, these falls are likely to benefit grain development in later sown crops planted from November onwards.
- Oceanic and atmospheric indicators suggest the La Niña event ongoing in the tropical Pacific has likely passed its peak. Increased soil moisture associated with an early onset of northern rainfall and the enhanced probability of a wetter than average autumn will likely continue to benefit summer crop production and pasture growth across eastern and northern Australia as the La Niña event weakens.
- There is a high chance that rainfall between March and May 2021 will be sufficient to sustain average to above average yield potential of later sown sorghum crops across most regions as the summer cropping season wraps up, and support planting opportunities across southern Australia as the winter cropping season begins.
- Over the next 8 days, troughs, low-pressure systems and cold fronts are expected to generate showers and storms over parts of northern, south-western and eastern Australia.
- In Australia’s summer cropping regions, rainfall totals of between 10 and 50 millimetres are expected for parts of northern and central New South Wales, southern and far northern Queensland and central and southern Western Australia over the next 8 days.
- Water storage levels in the Murray-Darling Basin (MDB) decreased by 123 gigalitres (GL) between 17 February 2021 and 24 February 2021. The current volume of water held in storage is 13,415 GL, which represents 53% of total capacity.
- Allocation prices in the Victorian Murray below the Barmah Choke increased from $95 per ML on 18 February 2021 to $100 per ML on 25 February 2021. Prices are lower in Murrumbidgee due to binding of the Murrumbidgee export limit.
Climate
[expand all]
Rainfall this week
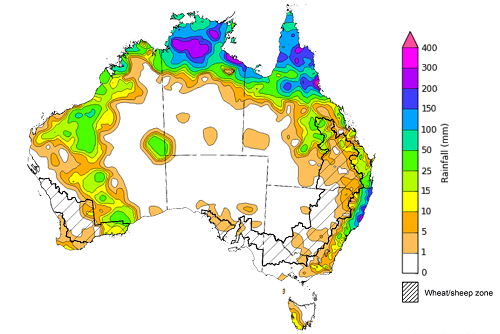
During the 7 days to 24 February 2021, troughs, low-pressure systems, cold fronts and onshore flow generated showers and thunderstorm activity across parts of northern, western and eastern Australia.
Rainfall totals of between 10 and 50 millimetres were recorded across parts of eastern New South Wales, central and eastern Queensland, eastern Victoria, north-western, central and eastern Western Australia and south-western Tasmania. Rainfall totals of between 50 and 300 millimetres were recorded across parts of north-eastern New South Wales, northern Queensland, the northern parts of the Northern Territory and isolated parts of northern Western Australia.
In Australia’s summer cropping regions, rainfall totals of between 10 and 50 millimetres were recorded across isolated northern areas of Queensland. Little to no rainfall was recorded across remaining summer cropping regions of Queensland and New South Wales and most winter cropping regions across southern Australian during the 7 days to 24 February 2021.
In those summer cropping regions that recorded rainfall during the 7 days to 24 February 2021, these falls are likely to benefit grain fill in later sown crops planted from November onwards.
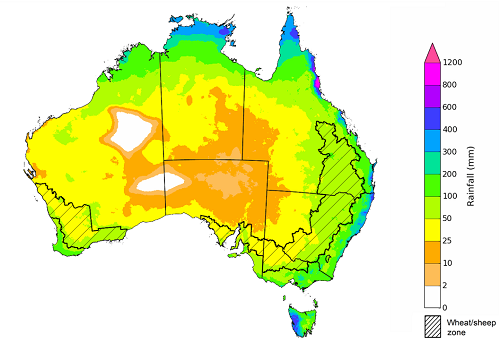
Rainfall for the week ending 24 February 2021
©Commonwealth of Australia 2021, Australian Bureau of Meteorology - Issued: 17/02/2021
Note: The rainfall analyses and associated maps utilise data contained in the Bureau of Meteorology climate database, the Australian Data Archive for Meteorology (ADAM). The analyses are initially produced automatically from real-time data with limited quality control. They are intended to provide a general overview of rainfall across Australia as quickly as possible after the observations are received. For further information go to http://www.bom.gov.au/climate/rainfall/
Climate Drivers
As the generally favourable summer cropping and northern pasture production season starts to wrap up, interest moves to the prospects for autumn and the start of the winter cropping season. To gain some insight, it is important to look at the climate drivers—the El Niño–Southern Oscillation (ENSO) and the Madden–Julian Oscillation (MJO)—that can influence autumn rainfall across Australia.
Oceanic and atmospheric indicators suggest the La Niña event in the tropical Pacific has likely passed its peak. La Niña events typically generates the favourable growing conditions for summer crop and pasture production. This has been evident across most of northern and eastern Australia during summer. These favourable growing conditions were central in developing ABARES summer crop and livestock production forecasts embodied in the ABARES December 2020 edition of the Agricultural commodities and February 2021 edition of the Australian crop report. These favourable agricultural production conditions are likely to continue though the autumn period as enhanced rainfall associated with La Niña typically continues as the event starts to weaken.
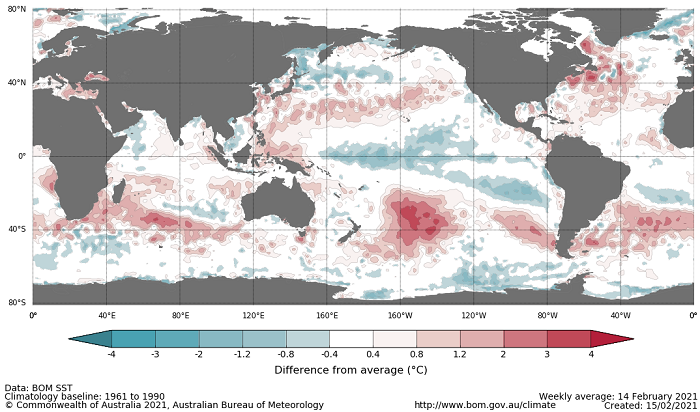
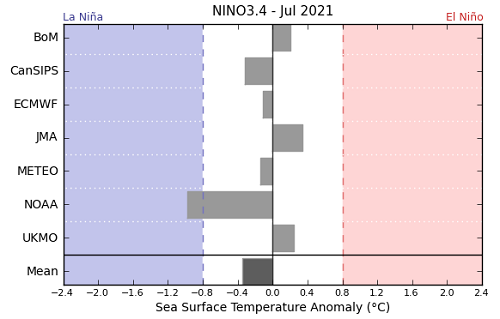
In the past fortnight, sea surface temperature anomalies in the tropical Pacific Ocean have generally remained steady. Cool sea surface temperature anomalies persist in the central and western Pacific and warm sea surface temperature anomalies persist in the waters near Indonesia, Papua New Guinea and the Philippines. Warm anomalies in the waters near north-eastern, western and south-eastern Australia have weakened slightly. As at 16 February 2021 all of the international climate models surveyed suggest the La Niña event has likely passed its peak, and oceanic and atmospheric conditions will return to neutral or close to neutral levels by mid-autumn 2021.
Difference from average sea surface temperature observations 25 January to 31 January 2021
International climate model outlooks for the NINO 3.4 region in July 2021
©Commonwealth of Australia 2021, Australian Bureau of Meteorology - Issued: 16/02/2021
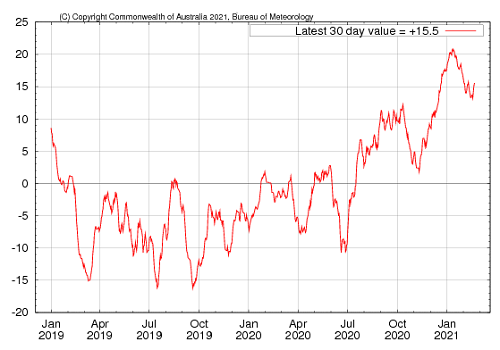
Atmospheric indicators are generally consistent with a La Niña event, with stronger than average to near average trade winds and decreased cloudiness near the Date Line. For the period ending 22 February the 30‑day Southern Oscillation Index (SOI) value was 15.5 and for the period ending 14 February the 90‑day value was 15.3.
30-day Southern Oscillation Index (SOI) values ending 22 February 2021
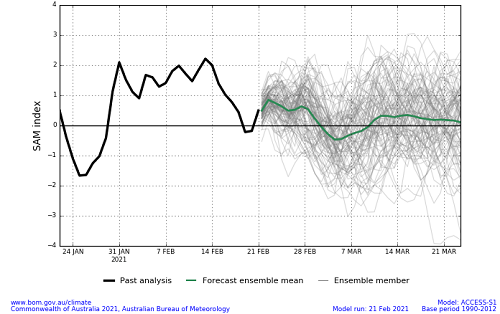
The Southern Annular Mode (SAM) is currently neutral and expected to remain neutral until at least early March. The SAM refers to the north-south shift of the band of rain-bearing westerly winds and weather systems in the Southern Ocean compared to the usual position. When SAM is neutral during summer, the band of westerly winds is further south than in winter and has less influence on rainfall. The SAM typically has little influence on Australia’s climate during autumn.
Southern Annular Mode (SAM) daily index
As at 21 February 2021 the Madden–Julian Oscillation (MJO) was weak in strength and located above the western Pacific Ocean. The MJO is a pulse of cloud and rainfall that moves eastward along the equator. It is unlikely that the MJO will influence Australian rainfall over the next week. Models suggest the MJO may strengthen as it moves over the Americas in about a week, which would likely influence below average rainfall across northern Australia.
Madden–Julian Oscillation (MJO) daily index
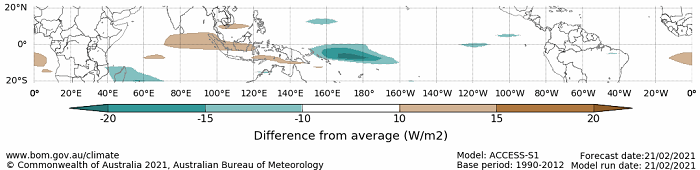
Note: This map displays the forecast outgoing longwave radiation (OLR) difference from expected cloudiness to identify convective rain clouds and the position of the Madden–Julian Oscillation (MJO). The blue shading indicates higher than normal, active or enhanced tropical weather and the brown shading indicates lower than normal clouds or suppressed conditions.
National Climate Outlook
These climate outlooks are generated by ACCESS–S (Australian Community Climate Earth-System Simulator–Seasonal). ACCESS–S is the Bureau of Meteorology's dynamical (physics-based) weather and climate model used for monthly, seasonal and longer-lead climate outlooks.
For further information, go to http://www.bom.gov.au/climate/ahead/about/
The latest rainfall outlook released by the Bureau of Meteorology suggests that wetter than average conditions are slightly more likely for parts of eastern Australia during March 2021, consistent with a weakening La Niña event.
The outlook for March 2021 suggests that there is a 75% chance of rainfall totals between 10 and 100 millimetres across parts of northern and eastern Australia. There is a 75% chance of rainfall totals between 1 and 10 millimetres across much of the remainder of western, eastern and southern Australia. Rainfall totals in excess of 100 millimetres are likely across the far tropical north.
In northern cropping regions there is a 75% chance of rainfall totals between 10 and 50 millimetres across much of New South Wales and Queensland. Across most southern cropping regions there is a 75% chance of rainfall totals between 1 and 10 millimetres and up to 25 millimetres across parts of eastern and central New South Wales, southern Victoria and eastern Western Australia.
The ACCESS–S climate model suggests there is a 50% chance of recording close to average March rainfall across much of Australia, including across cropping regions. In areas with average or better levels of soil moisture, these possible rainfall totals are likely to support average pasture growth potentials, average summer crop production and increase planting confidence across northern winter cropping regions.
Rainfall totals that have a 75% chance of occurring March 2021
©Commonwealth of Australia 2021, Australian Bureau of Meteorology - Issued: 18/02/2021
The rainfall outlook for March to May 2021 suggests that wetter than average conditions are likely for much of Australia. There is a greater than 65% chance of above average rainfall across parts of eastern Australia, and across isolated parts of northern Australia (Bureau of Meteorology ‘National Climate Outlook’, 18 February 2021). Bureau of Meteorology rainfall outlooks for March to May have greater than 55% past accuracy across most of Australia and greater than 65% accuracy across parts of central New South Wales, northern and central Queensland, eastern South Australia, the west of Western Australia and the north of the Northern Territory.
Chance of exceeding the median rainfall March to May 2021
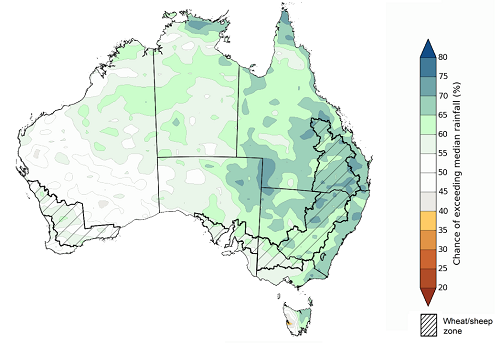
©Commonwealth of Australia 2021, Australian Bureau of Meteorology - Issued: 18/02/2021
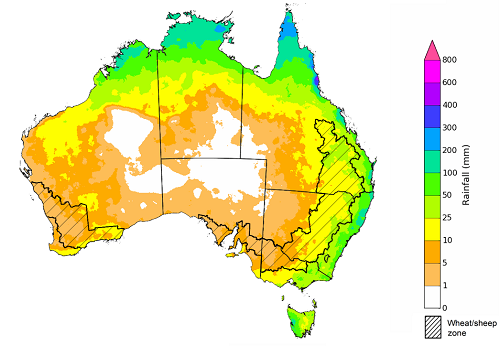
The outlook for March to May 2021 suggests there is a 75% chance of rainfall totals between 50 and 200 millimetres across parts of eastern, northern and far southern Australia. Lower rainfall totals between 10 and 50 millimetres are likely across much of Western Australia and central Australia. Rainfall totals in excess of 200 millimetres are likely across the tropical north and parts of the eastern coastline of Australia and western Tasmania.
Across cropping regions, there is a 75% chance of receiving between 50 and 100 millimetres across most of New South Wales and Queensland, with lower totals between 25 and 50 millimetres across south-western New South Wales cropping regions between March and May 2021. There is a 75% chance of receiving between 25 and 100 millimetres across most cropping regions in Victoria, South Australia and Western Australia between March and May 2021.
The ACCESS–S climate model suggests there is a high chance of recording close to average March to May rainfall totals across parts of northern and eastern Australia. If realised, these totals are likely to support average pasture growth potentials in parts of northern Australia and average crop production in parts of northern and southern Queensland and western New South Wales.
Across eastern New South Wales and central Queensland summer cropping regions, there is a 50% chance of recording close to average March to May rainfall. With average or better levels of soil moisture across cropping regions in New South Wales, these totals are likely to be sufficient to support close to average pasture production and sorghum, cotton and rice production as the summer cropping season wraps up. By recharging soil moisture profiles, this rainfall is also expected to support planting opportunities for wheat and canola as winter crop sowing begins. These forecast rainfall totals may not be sufficient to support average crop production in parts of central and western Queensland cropping regions where soil moisture levels are below average.
Rainfall totals that have a 75% chance of occurring March to May 2021
©Commonwealth of Australia 2021, Australian Bureau of Meteorology - Issued: 18/02/2021
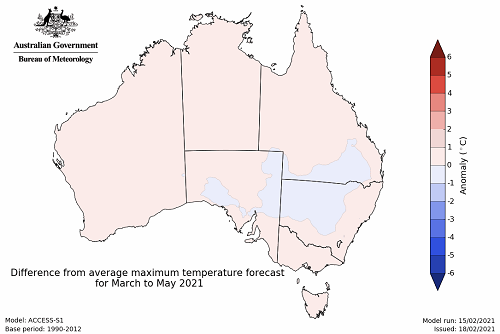
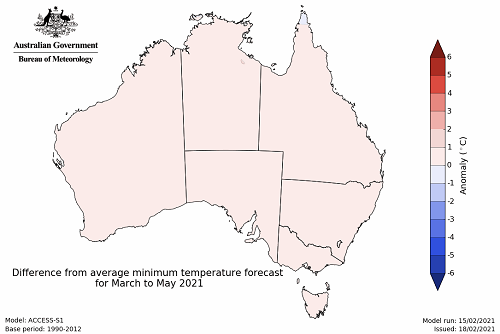
The temperature outlook for March to May 2021 indicates that day-time and night-time temperatures across Australia are likely to be close to the 1990-2012 average (- 1°C to 1°C) (Bureau of Meteorology ‘National Climate Outlook’, 18 February 2021).
Predicted maximum temperature anomaly for March to May 2021
Predicted minimum temperature anomaly for March to May 2021
Rainfall forecast for the next eight days
Troughs, low-pressure systems and cold fronts are expected to generate showers and storms over parts of northern, south-western and eastern Australia during the next 8 days.
Rainfall totals of between 10 and 50 millimetres are forecast for parts of north-eastern New South Wales, southern and north-eastern Queensland, southern and far northern Western Australia, the north of the Northern Territory and western Tasmania. Rainfall totals in excess of 100 millimetres are expected across parts of north-eastern Queensland and isolated parts of north-eastern New South Wales, the north of the Northern Territory and western Tasmania.
In Australia’s cropping regions, rainfall of between 10 and 50 millimetres are expected for parts of northern and central New South Wales, southern and far northern Queensland and central and southern Western Australia.
Total forecast rainfall (mm) for the period 25 February to 4 March 2021
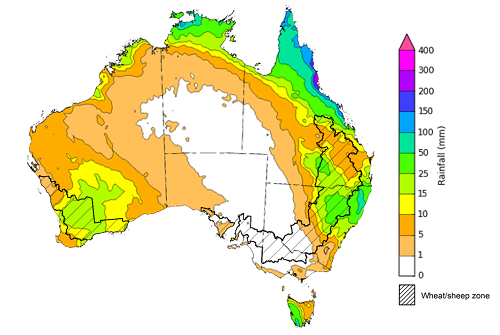
©Commonwealth of Australia 2021, Australian Bureau of Meteorology - Issued: 25/02/2021
Note: This rainfall forecast is produced from computer models. As the model outputs are not altered by weather forecasters, it is important to check local forecasts and warnings issued by the Bureau of Meteorology.
Water
Water storages, water markets and water allocations - current week
The Tableau dashboard may not meet accessibility requirements. For information about the contents of these dashboards contact ABARES.

Commodities
Information on weekly price changes in agricultural commodities is now available at the Weekly commodity price update.