
Key issues
- For the week ending 26 January 2023, low-pressure troughs were active over most of the country and resulted in widespread rainfall and thunderstorm activity across the northern tropics and the southeast of Australia.
- The persistence of dry conditions across cropping regions of Victoria, South Australia and Western Australia would have supported the finalisation of the winter crop harvest. Little to no rainfall across much of northern New South Wales would have allowed field access for crop maintenance activities. However, rainfall across southern Queensland may have prevented the harvest of early planted summer crops (see Section 1.1).
- The La Niña event underway in the tropical Pacific has weakened from its peak in spring 2022. The Madden-Julian Oscillation is forecast to move eastward towards the western Maritime Continent before it likely weakens in early February. Warmer than average sea surface temperatures persist to the south of Australia from the eastern Great Australian Bight to waters east of New Zealand, as well as over the northern Maritime continent. Those climate drivers are likely to bring above average rainfall to northern and eastern Australia and below average rainfall for western Tasmania during summer (see Section 1.2).
- The rainfall outlook for February to April 2023 suggests most of the country has close to equal chance of above or below median rainfall. Soil moisture levels across both northern and southern cropping regions are above average during November, December, and early January. Therefore, below average rainfall during this period is unlikely to negatively impact summer crops growth and yield prospects (see Section 1.3).
- Over the 8-days to 3 February 2023, widespread rainfall is expected to continue across northern, central and south-eastern Australia under the influence of a low-pressure system and troughs. Across Australian cropping regions, moderate rainfall for parts of New South Wales and Queensland is expected to improve soil moisture conditions and benefit the growth of summer crops. Little to no rainfall forecast across other cropping regions will provide favourable conditions for summer crops maintenance. Rainfall over much of northern and central Australia would likely benefit pasture growth and enhance soil moisture conditions (see Section 1.4).
- Water storage levels in the Murray-Darling Basin decreased between 19 January and 26 January 2023 by 144 gigalitres (GL). Current volume of water held in storage is 23 454 GL, representing 94 percent of total capacity. This is 4 percent or 811 GL more than at the same time last year.
- Allocation prices in the Victorian Murray below the Barmah Choke decreased from $38 per ML on 13 January to $32 per ML on 20 January 2023. Prices are lower in the Murrumbidgee and regions above the Barmah choke due to the binding of the Murrumbidgee export limit and Barmah choke trade constraint.
Climate
For the week ending 26 January 2023, low-pressure troughs remained active over most of the country and resulted in widespread rainfall and localised thunderstorm activity across northern and south-eastern Australia.
Weekly rainfall totals of more than 25 millimetres were recorded in the tropical north, south-eastern coast and alpine regions of Australia, central Queensland, and Gascoyne and Murchison regions of Western Australia, as well as western Tasmania. Rainfall totals greater than 150 millimetres were recorded in areas of the Cape York region and southern inland district of Queensland and Pilbara region of Western Australia and northern areas of the Northern Territory.
Across Australian cropping regions, rainfall totals of between 10 and 100 millimetres were recorded across much of central and southern Queensland, central New South Wales and small areas of north-western Victoria. Little to no rainfall was recorded in the remaining cropping regions.
The impact of heavy rainfall and localised flooding across western Queensland cropping regions would have slowed sowing of summer crops, degraded grain quality in some crops and downgraded crop production prospects of summer crops in the worst affected areas. The persistence of dry conditions across cropping regions of Victoria, South Australia and Western Australia would have supported the finalisation of the winter crop harvest. Little to no rainfall across much of northern New South Wales would have allowed field access for crop maintenance activities. However, rainfall across southern Queensland may have prevented the harvest of early planted summer crops.
Rainfall for the week ending 26 January 2023
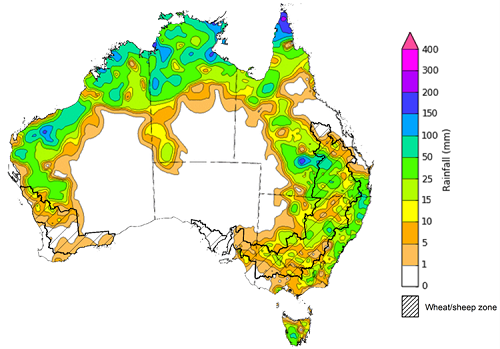
Note: The rainfall analyses and associated maps utilise data contained in the Bureau of Meteorology climate database, the Australian Data Archive for Meteorology (ADAM). The analyses are initially produced automatically from real-time data with limited quality control. They are intended to provide a general overview of rainfall across Australia as quickly as possible after the observations are received. For further information go to http://www.bom.gov.au/climate/rainfall/
Throughout Australia’s summer period, the climate drivers with the largest potential impact on Australia’s climate patterns are the El Niño–Southern Oscillation (ENSO), the positive Southern Annular Mode (SAM), warm ocean temperatures around Australia and the Madden-Julian Oscillation (MJO). These climate drivers are likely to influence the growth and development of summer crops in northern growing regions and pasture growth across northern Australia with the onset of the northern wet season.
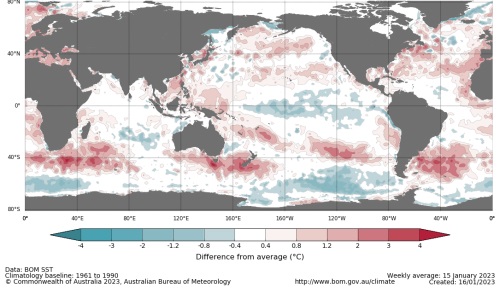
La Niña continues in the tropical Pacific but has weakened from its peak in spring 2022. It is expected to a return to ENSO-neutral in February 2023. Cool sea surface temperature (SST) anomalies have persisted in the central and eastern tropical Pacific Ocean in recent weeks. Cool SST anomalies are strongest in the eastern Pacific just to the south of the equator. However, the strength of cool SST anomalies has weakened in the eastern equatorial Pacific. Warmer than average temperatures continue in the far-west of the Pacific, with generally small anomalies over the Maritime Continent, and larger anomalies to the northeast of Australia. Warm temperature anomalies have also reduced in strength over the Coral Sea (to the north-east of Australia), especially off the Queensland coast. Trade winds have been stronger than average in the western and central tropic Pacific Ocean. Elsewhere, trade wind strength was close to average. Cloudiness near the Date Line has been mostly below average with values over the last fortnight being consistently well below average, which reflects the La Niña event.
The SAM is close to neutral but is likely to return to positive values during the remainder of January before decreasing back to neutral values during February. An MJO is in the eastern Indian Ocean and moderate to strong in strength. The MJO is forecast to move eastward towards the western Maritime Continent before it likely weakens in early February. A strong MJO will likely see enhanced easterly winds in the lower atmosphere levels across the northern Australian regions, thus the monsoon break is expected to persist over the next fortnight.
Given current and expected conditions, including the La Niña event and warm ocean temperatures around Australia, above average rainfall is expected to persist across northern and eastern Australia and below average rainfall for western Tasmania during summer.
Difference from average sea surface temperature observations 9 January to 15 January 2023
International climate model outlooks for the NINO 3.4 region in February 2023
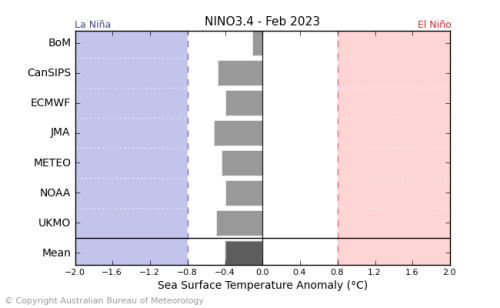
Issued: 17/01/2023
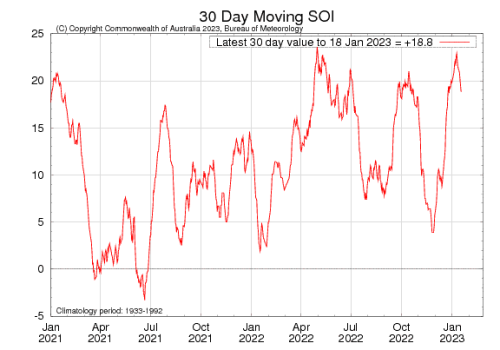
The La Niña event currently underway in the Pacific Ocean is slowly easing and expected to ease over summer 2023. All seven of the international models surveyed predict an easing La Niña event in January and all models expect the La Niña event to dissipate by February 2023. For the period ending 15 January 2023, the 30-day Southern Oscillation Index (SOI) value was +20.9 and the 90-day value was +13.1. Both have remained relative similar over last fortnight. La Niña events are associated with above average rainfall across eastern and northern Australia during early summer.
30-day Southern Oscillation Index (SOI) values ending 18 January 2023
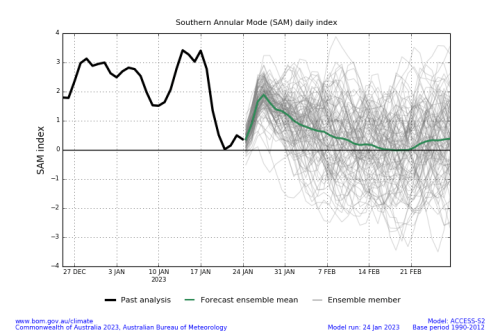
The Southern Annular Mode (SAM) is close to neutral but likely to return to positive values during the remainder of January before decreasing back to neutral values during February. The SAM refers to the north-south shift of the band of rain-bearing westerly winds and weather systems in the Southern Ocean compared to the usual position. A positive SAM in summer months is associated with increased rainfall for parts of north-eastern Tasmania, eastern Victoria, eastern New South Wales, and south-eastern Queensland. It is also associated with decreased rainfall for western Tasmania.
Southern Annular Mode (SAM) daily index
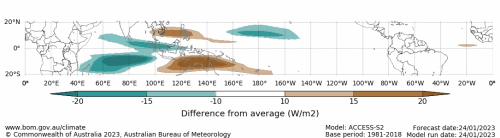
The Madden–Julian Oscillation (MJO) is in the eastern Indian Ocean and moderate to strong in strength. The MJO is forecast to move eastward towards the western Maritime Continent before it likely weakens in early February. A strong MJO will likely see enhanced easterly winds in the lower atmosphere levels across the northern Australian regions, thus the monsoon break is expected to persist over the next fortnight.
Madden–Julian Oscillation (MJO) daily index /h4>
These climate outlooks are generated by ACCESS–S (Australian Community Climate Earth-System Simulator–Seasonal). ACCESS–S is the Bureau of Meteorology's dynamic (physics-based) weather and climate model used for monthly, seasonal, and longer-lead climate outlooks. For further information, go to http://www.bom.gov.au/climate/ahead/about/.
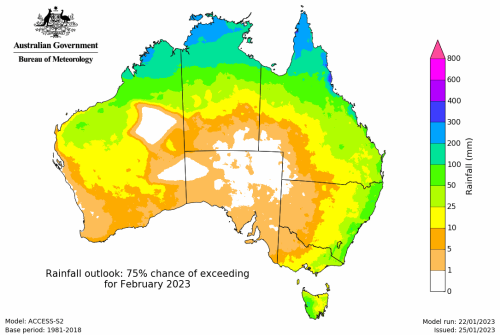
The Bureau of Meteorology’s latest rainfall outlook for February 2023 indicates that there is around a 60% to 70% chance of above median rainfall for Tasmania and southern Victoria, western parts of Western Australia and northern parts of the Northern Territory. However, below median rainfall is likely (around 60% chance) for small inland areas of eastern South Australia and adjacent area of New South Wales, the central Northern Territory, north-western, central Cape York Peninsula and the south-east coast of Queensland.
The outlook for February 2023 indicates that there is a 75% chance of rainfall totals between 10 and 200 millimetres across central and eastern New South Wales, much of Queensland, southern Victoria, the northern two-thirds of the Northern Territory, and northern Western Australia, as well as Tasmania. Rainfall totals in excess of 200 millimetres are expected across far northern areas of Queensland, Western Australia and the Northern Territory. For the remainder of Australia, rainfall totals are not expected to exceed 10 millimetres.
Across cropping regions there is a 75% chance of rainfall totals of between 10 and 50 millimetres across Queensland and much of New South Wales. There is a 75% chance of less than 10 millimetres of rainfall for the cropping regions in Western Australia, South Australia, and most of Victoria, and the far southwest of New South Wales.
Rainfall totals that have a 75% chance of occurring February 2023
Issued:25/01/2023
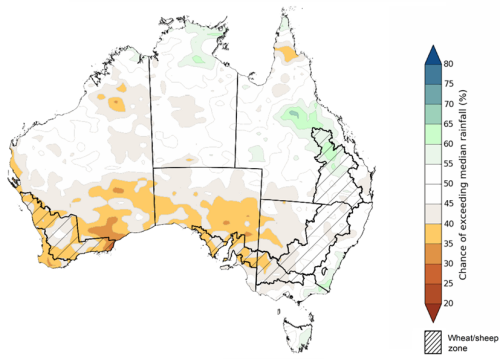
The rainfall outlook for February to April 2023 suggests most of the country has close to equal chance of above and below median rainfall. There is around a 60% chance of exceeding median rainfall for parts of eastern Queensland, the far north of the Northern Territory, as well as south-eastern corner of New South Wales. However, below median rainfall is more likely for large parts of southern Western Australia, South Australia and adjacent areas of New South Wales and Victoria between February and April.
Bureau of Meteorology rainfall outlooks for February to April have greater than 55% past accuracy across most of Australia. Outlook accuracy is greater than 65% across parts of Queensland, New South Wales, South Australia, and the north-west and northern parts of Western Australia, as well as northern parts of the Northern Territory. Past accuracy is low (less than 50%) for small parts of southern Western Australia, southern Queensland, and southern Tasmania.
Chance of exceeding the median rainfall February to April 2023
Issued: 25/01/2023
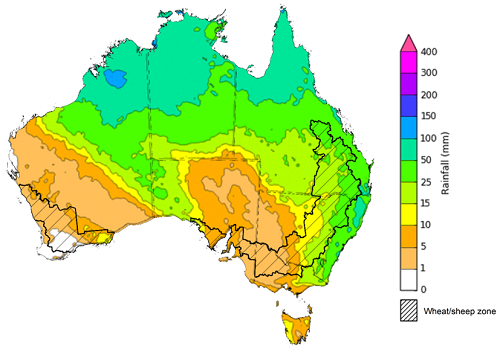
The outlook for February to April 2023 suggests there is a 75% chance of rainfall totals between 25 and 200 millimetres across most of Queensland, New South Wales, Victoria, the Northern Territory, Tasmania, as well as large areas of Western Australia. Rainfall totals in excess of 200 millimetres are forecast for tropical north, alpine and eastern coastal areas of Australia, and south-west Tasmania.
Across cropping regions, there is a 75% chance of receiving between 10 and 50 millimetres in the cropping regions of south-western New South Wales, most of Victoria, South Australia and Western Australia. There is a 75% chance of receiving between 50 and 200 millimetres across the remainder of New South Wales and Queensland.
These rainfall totals are below average for this three-month period across most cropping regions. Root zone soil moisture levels across both northern and southern cropping regions were above average during November, December and early January. Therefore, below average rainfall during the February to April period is unlikely to negatively impact summer crops growth and yield prospects.
Rainfall totals that have a 75% chance of occurring February to April 2023
Issued: 25/01/2023
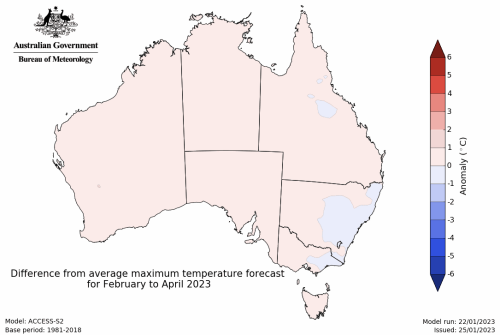
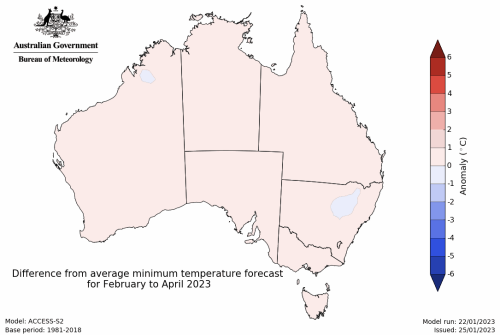
The temperature outlook for February to April 2023 indicates that maximum temperatures across most of Australia are close to the 1990-2012 average (the difference in the range of - 1°C to +1°C), with slightly higher than average maximum temperatures in the small areas of south-western Western Australia. Minimum temperatures across most of Australia are also expected to be close to the 1990-2012 average (the difference in the range of -1°C to +1°C) (Bureau of Meteorology ‘National Climate Outlook’, 25 January 2023).
Predicted maximum temperature anomaly for February to April 2023
Predicted minimum temperature anomaly for February to April 2023
Over the 8-days to 3 February 2023, widespread rainfall is expected to continue across northern, central and south-eastern Australia under the influence of low-pressure system and troughs.
Rainfall totals exceeding 15 millimetres are expected across most of the Northern Territory and Queensland, the northern rangelands of Western Australia, eastern New South Wales, eastern Victoria and western South Australia. Rainfall totals in excess of 50 millimetres is forecast for northern Queensland, the north of the Northern Territory and through the Kimberley region of Western Australia, as well as north-eastern corner of New South Wales. Little to no rainfall is forecast for the remaining area of Australia for the next eight days.
Across most of Australian cropping regions, rainfall between 10 and 50 millimetres is expected for Queensland, and the north and south-east of New South Wales. Little to no rainfall is expected for the remaining cropping regions in the next eight days.
If realised the moderate rainfall total (25 to 50 millimetres) forecast for flood-affected cropping regions of northern Queensland may exacerbate existing flooding and increase the risk of waterlogging and reduce the access to fields for summer crop planting and maintenance activities. The moderate rainfall for parts of New South Wales and southern Queensland is expected to improve soil moisture levels and benefit the summer crops growth. Flood conditions are slowly easing in western New South Wales and along the River Murray in South Australia, likely allowing saturated soil to drain. Little to no rainfall forecast across most other cropping regions will provide favourable conditions for summer crop maintenance. The forecast rainfall over much of northern and central Australia are likely to benefit pasture growth and enhance soil moisture conditions.
Total forecast rainfall for the period 27 January to 3 February 2023
Note: This rainfall forecast is produced from computer models. As the model outputs are not altered by weather forecasters, it is important to check local forecasts and warnings issued by the Bureau of Meteorology.
Water
Water storages, water markets and water allocations - current week
The Tableau dashboard may not meet accessibility requirements. For information about the contents of these dashboards contact ABARES.

Commodities
Information on weekly price changes in agricultural commodities is now available at the Weekly commodity price update.