
Key issues
- For the week ending 30 August 2023, fronts and troughs brought isolated showers to south-eastern parts of the country. A high-pressure system kept the remainder of the country dry and clear.
- Across cropping regions, rainfall totals of up to 15 millimetres were recorded in isolated areas in north-eastern New South Wales. Little to no rainfall was recorded in the remaining cropping regions. Given the lack of rainfall across many cropping regions in New South Wales, Queensland and Western Australia, these regions are continuing to see a gradual decline in soil moisture reserves. This represents an increased risk of declines in crop yields if follow-up rainfall is not received in the next few weeks (see Section 1.1).
- The Bureau of Meteorology’s ENSO outlook remains at El Niño ALERT given that not all atmospheric indicators have reached El Niño thresholds. The sea surface temperature has exceeded El Niño thresholds in the tropical Pacific. The Southern Oscillation Index is just below El Niño thresholds. In contrast, trade winds and cloudiness near Date Line are fluctuating closer to average and are yet to reach El Niño thresholds (see Section 1.2).
- The Indian Ocean Dipole (IOD) index has been in the positive phase for the past two weeks, but this has to persist for several weeks to be declared a positive IOD event. A positive IOD, together with an El Niño, typically suppresses spring rainfall in central and eastern Australia. The expected onset of these climate drivers is influencing the hot and dry outlook for spring (see Section 1.2).
- Over the 8-days to 7 September 2023, fronts and troughs are expected to bring isolated showers to southern parts of the country. A high-pressure system is expected to bring mainly dry conditions to the remainder of the country (see Section 1.3).
- Across most cropping regions, minimal rainfall totals of up to 10 millimetres are expected. These falls are not expected to have much benefit to crops and pastures as they are unlikely to be sufficient to offset evaporative losses. Cropping regions in Queensland, northern New South Wales, northern Western Australia and western South Australia have experienced a dry August to date and have well below average levels of soil moisture. Crops and pastures in these areas will be disposed to heat and moisture stress, negatively affecting production potential (see Section 1.3).
- Water storage levels in the Murray-Darling Basin (MDB) increased between 24 August 2023 and 31 August 2023 by 36 gigalitres (GL). Current volume of water held in storage is 21 026 GL. This is 2 percent or 457 GL less than at the same time last year.
- Allocation prices in the Victorian Murray below the Barmah Choke remained steady at $155 from 24 August 2023 to 31 August 2023. Prices are lower in the Goulburn-Broken and regions above the Barmah choke due to the binding of the Goulburn intervalley trade limit and Barmah choke trade constraint.
Climate
For the week ending 30 August 2023, fronts and troughs brought isolated showers to south-eastern parts of the country. A high-pressure system kept the remainder of the country dry and clear.
Across cropping regions, rainfall totals of up to 15 millimetres were recorded in isolated areas in north-eastern New South Wales. Little to no rainfall was recorded in the remaining cropping regions. Given the lack of rainfall across most cropping regions in New South Wales, Queensland and Western Australia, these regions are continuing to see a gradual decline in soil moisture reserves. This represents an increased risk of declines in crop yields if follow-up rainfall is not received in the next few weeks.
Rainfall for the week ending 30 August 2023
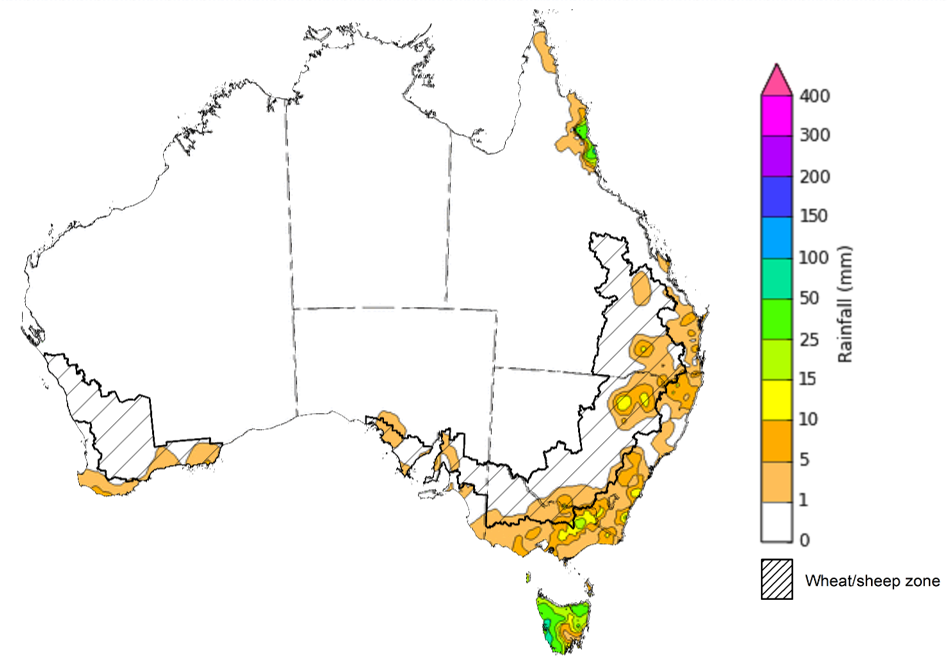
Note: The rainfall analyses and associated maps utilise data contained in the Bureau of Meteorology climate database, the Australian Data Archive for Meteorology (ADAM). The analyses are initially produced automatically from real-time data with limited quality control. They are intended to provide a general overview of rainfall across Australia as quickly as possible after the observations are received. For further information go to http://www.bom.gov.au/climate/rainfall/
The climate drivers with the largest potential impact on Australia’s climate patterns are the El Niño–Southern Oscillation (ENSO), Madden-Julian Oscillation (MJO), Indian Ocean Dipole (IOD) and Southern Annular Mode (SAM). These climate drivers are likely to influence pasture growth across southern Australia and the growth and yield prospects for winter crops.
The Madden–Julian Oscillation (MJO) pulse is currently indiscernible. At this time of the year MJO has little influence on northern Australia rainfall.
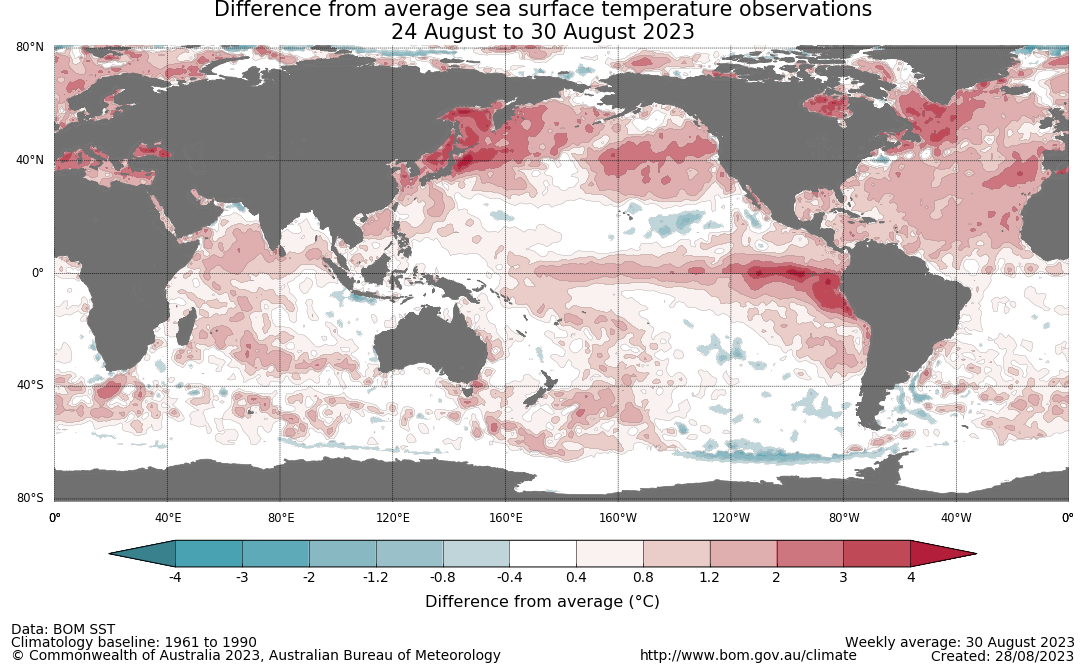
The Bureau of Meteorology’s ENSO outlook remains at El Niño ALERT, indicating that there is a 70% chance of El Niño developing in 2023. Oceanic indicators are measured in terms of the sea surface temperature (SST) anomalies, which have warmed to and remains in the El Niño thresholds. For the week ending 30 August, SST anomalies were warmer than average across almost all of the equatorial Pacific. Typically, during El Niño events, waters off eastern Australia are cooler than average, pushing moisture flow from this region away from Australia. All international climate model surveyed by the Australian Bureau of Meteorology indicate the SST anomaly values will remain above El Niño threshold levels through spring and at least to the end of 2023. Note: the World Meteorological Organisation and other international agencies have declared that an El Niño event has already become established.
Weekly sea surface temperature anomaly
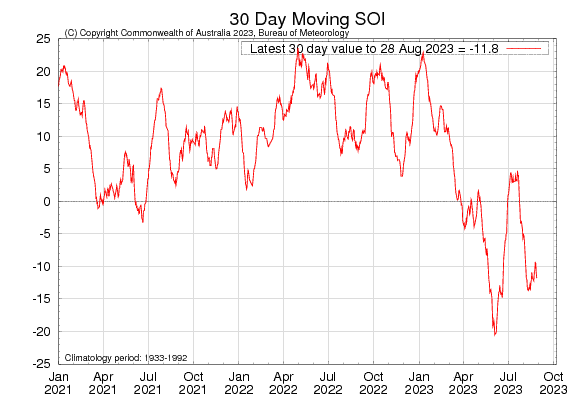
Atmospheric indicators are measured in terms of the surface air pressure difference between Tahiti and Darwin, called the Southern Oscillation Index (SOI), the direction and strength of the trade winds and cloudiness at the date line.
The 30-day SOI had returned to El Niño threshold to a value of -11 for the period ending 27 August 2023. The 60- and 90-day SOI values were -7.1 and -6.0, respectively. The 90-day SOI values were just below the El Niño threshold.
30-day Southern Oscillation Index (SOI) values ending 28 August 2023
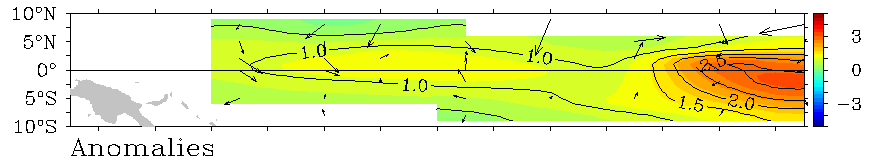
The direction and strength of the trade winds are another indicator for ENSO phases. During El Niño, there is a sustained weakening, or even reversal, of trade winds across much of the tropical Pacific, while during La Niña there is a sustained strengthening of trade winds. Trade winds for the 5 days ending 27 August 2023 were slightly weaker than average over the far western tropical Pacific, but closer to average elsewhere. Trade winds are yet to fully complement the SST response to the El Niño phase.
Wind anomaly on August 27 2023
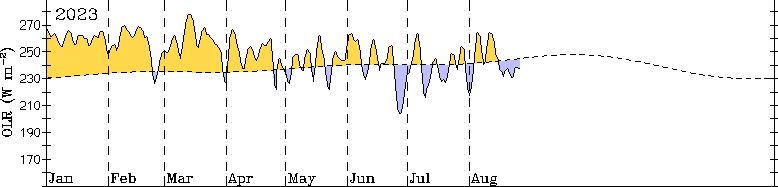
The cloudiness along the international Date Line (7.5S–7.5N, 170E–170W) is another indicator for ENSO phases. During an El Niño the cloudiness increases along the Date Line (indicated by the negative Outgoing Longwave Radiation (OLR)), and vice versa for during La Niña. Since April 2023, the cloudiness has been fluctuating around average levels and have yet to meet the thresholds for an El Niño phase.
Cloudiness averaged for area 7.5S–7.5N, 170E–170W
The Indian Ocean Dipole (IOD) index was in the positive phase for the second week in a row and was +1.05°C for the week ending 27 August 2023. Weekly sea surface temperatures (SSTs) are above average across large areas of the tropical and southern Indian Ocean, especially in the mid-latitudes where anomalies are up to 3°C warmer than average. Closer to Australia, SSTs have cooled down south of the Maritime Continent and continue to be cooler than average around the western and southern coasts of the Western Australia. For a positive IOD phase to be declared, the IOD index values must persist in the positive phase range for at least 8 weeks. A positive IOD can supress winter and spring rainfall over much of central and south-eastern Australia, potentially exacerbating any drying effect of El Niño.
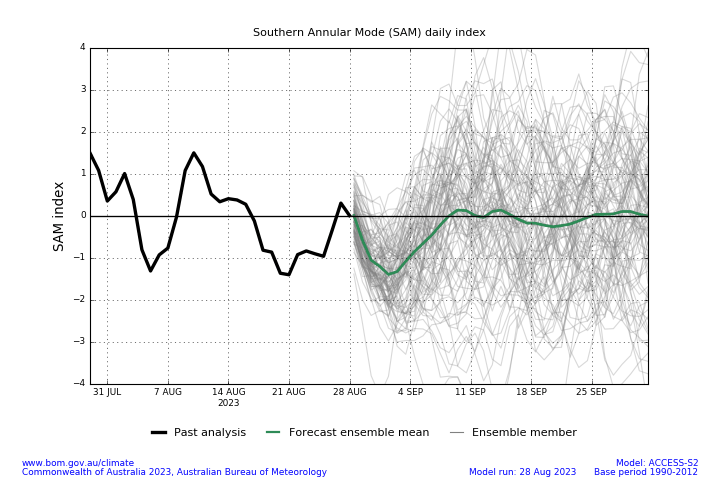
The Southern Annular Mode (SAM) index is currently neutral and is expected to become slightly negative before returning to neutral levels during September. A neutral SAM has little influence on Australian climate.
Southern Annular Mode (SAM) daily index
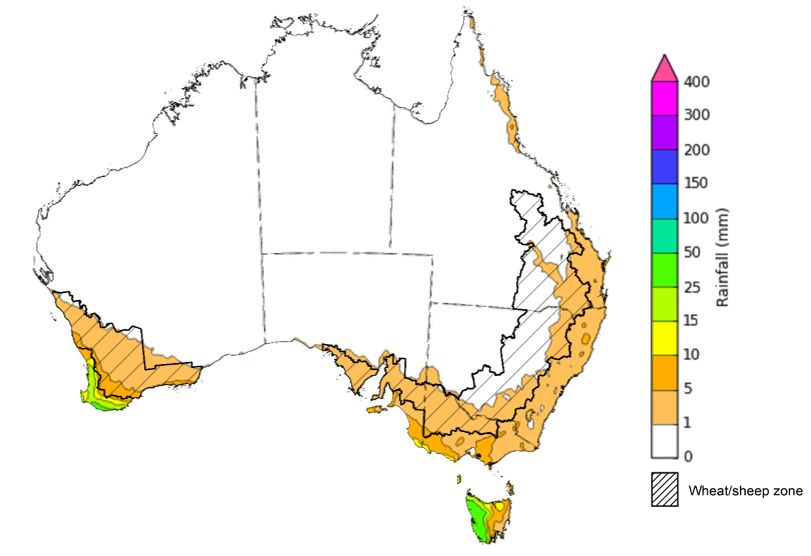
Over the 8-days to 7 September 2023, fronts and troughs are expected to bring isolated showers to southern parts of the country. A high-pressure system is expected to bring mainly dry conditions to the remainder of the country.
Across most cropping regions, minimal rainfall totals of up to 10 millimetres are expected. These falls are not expected to have much benefit to crops and pastures as they are unlikely to be sufficient to offset evaporative losses. Following a dry August so far cropping regions in Queensland, northern New South Wales, northern Western Australia and western South Australia and given the current well below average levels of soil moisture, crops and pastures is these areas will be disposed to heat and moisture stress, negatively affecting production potential.
Total forecast rainfall for the period 31 August 2023 to 7 September 2023
Note: This rainfall forecast is produced from computer models. As the model outputs are not altered by weather forecasters, it is important to check local forecasts and warnings issued by the Bureau of Meteorology.
Water
Water storages, water markets and water allocations - current week
The Tableau dashboard may not meet accessibility requirements. For information about the contents of these dashboards contact ABARES.

Commodities
Information on weekly price changes in agricultural commodities is now available at the Weekly commodity price update.