
Key issues
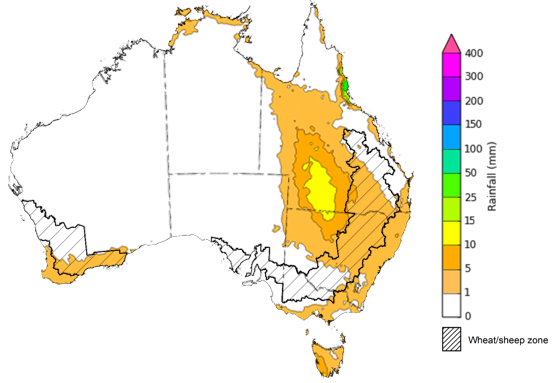
- For the week ending 4 October 2023, a low-pressure system brought heavy rainfall and damaging winds to much of Victoria, south-western New South Wales and parts of eastern South Australia. Cold fronts brought showers to southwest Western Australia and western Tasmania. A high-pressure system kept the remainder of the country dry.
- Across cropping regions, rainfall totals of up to 100 millimetres were recorded in southern New South Wales and across much of Victoria. This rainfall would have boosted the subsoil moisture reserve for crops and pastures. Little to no rainfall was received in the remaining cropping areas. Given the lack of rainfall across most cropping regions and continuous decline in soil moisture reserves, there is an increased risk of reductions in crop yields (see Section 1.1).
- For the week ending 3 October 2023, most cropping regions experienced maximum temperature in excess of 30°C, with temperatures in excess of 36°C being recorded in western New South Wales. These well above average day-time temperatures, in addition to the lack of recent rainfall and declining soil moisture levels will likely have contributed to increased moisture stress to the winter crops and spring pastures. Depending on the growth stage of winter cereals crops, this week’s extreme temperatures may have resulted in a decline in wheat crop yields in some regions (see Section 1.2).
- In cropping regions, September rainfall was extremely low to below average, except for in central Western Australia where it was average. With a continuous decline in the sub-soil moisture seen across numerous regions and above average day-and night-time temperatures, below average September rainfall has exposed crops to increased moisture stress and significant reductions in yield potential (see Section 1.3).
- For the 3 months to September 2023, modelled pasture growth was above average to extremely high in parts of western New South Wales, southern Victoria, in scattered areas of South Australia, Northern Territory and northern Western Australia, and across much of Tasmania. This growth is likely to enable farmers to continue to maintain stock numbers and provide opportunities to replenish fodder supplies during spring. However, extremely low to below average pasture growth across large areas of western and eastern parts of the country have seen a shift from maintaining livestock number to a period of destocking (see Section 1.5).
- Over the next 8-days, a low-pressure system, fronts and troughs will generate showers and storms across the eastern states with eastern Victoria and southern New South Wales receiving up to 100 millimetres of rainfall. Dry conditions are expected elsewhere (see Section 1.6).
- Across most cropping regions, falls of between 10 and 100 millimetres are forecast for much of New South Wales and central and eastern Victoria. If realised these falls are likely to benefit yield prospects for winter crops in the flowering and grain fill stages of growth, but unfortunately may arrive too late to improve the yield prospected in crops that have already started to ripen. Also following this week extreme heat these falls are likely to arrest any further declines in yield but are not likely to boost loss yield due to the heat (see Section 1.6).
- Water storage levels in the Murray-Darling Basin (MDB) decreased between 27 September 2023 and 4 October 2023 by 43 gigalitres (GL). Current volume of water held in storage is 20 729 GL. This is 6 percent or 1236 GL less than at the same time last year.
- Allocation prices in the Victorian Murray below the Barmah Choke decreased from $216 on 28 September 2023 to $202 on 5 October 2023. Prices are lower in the Goulburn-Broken and regions above the Barmah choke due to the binding of the Goulburn intervalley trade limit and Barmah choke trade constraint.
Climate
For the week ending 4 October 2023, a low-pressure system brought heavy rainfall and damaging winds to much of Victoria, south-western New South Wales and parts of eastern South Australia. Cold fronts brought showers to southwest Western Australia and western Tasmania. A high-pressure system kept the remainder of the country dry.
Across cropping regions, rainfall totals of up to 100 millimetres were recorded in southern New South Wales and across much of Victoria. This rainfall would have boosted the subsoil moisture reserve for crops and pastures. Little to no rainfall was received in the remaining cropping areas. Given the lack of rainfall across most cropping regions and continuous decline in soil moisture reserves, there is an increased risk of reductions in crop yields.
Rainfall for the week ending 4 October 2023
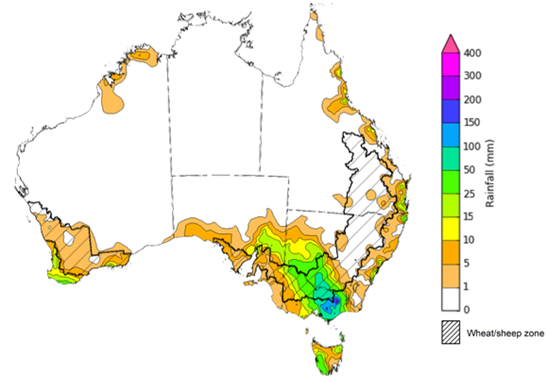
Issued: 4/10/2023
Note: The rainfall analyses and associated maps utilise data contained in the Bureau of Meteorology climate database, the Australian Data Archive for Meteorology (ADAM). The analyses are initially produced automatically from real-time data with limited quality control. They are intended to provide a general overview of rainfall across Australia as quickly as possible after the observations are received. For further information go to http://www.bom.gov.au/climate/rainfall/
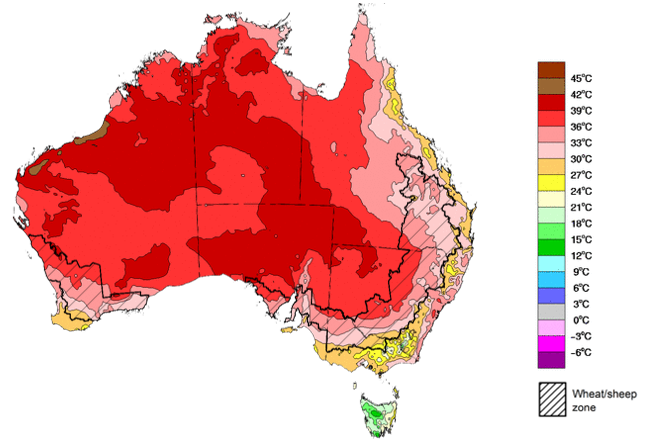
Winter crops such as wheat are highly sensitive to extreme heat during anthesis (flowering) and grain fill growth stages. This can have a significant impact on final crop yield and quality. Heat stress at anthesis often affects pollen fertility which reduces the number of kernels produced by each spike. For every one degree rise in the average maximum temperature above the optimum (5°C to 28°C), it is estimated that kernel number can decrease by up to 5%.
For the week ending 3 October 2023, most cropping regions experienced maximum temperature in excess of 30°C, with temperatures in excess of 36°C being recorded in western New South Wales. These well above average day-time temperatures, in addition to the lack of recent rainfall and declining soil moisture levels will likely have contributed to increased moisture stress to the winter crops and spring pastures. Depending on the growth stage of winter cereals crops, this week’s extreme temperatures may have resulted in additional significant decline in crop yield in wheat crops in some regions.
Highest daily maximum temperature for the week ending 3 October 2023
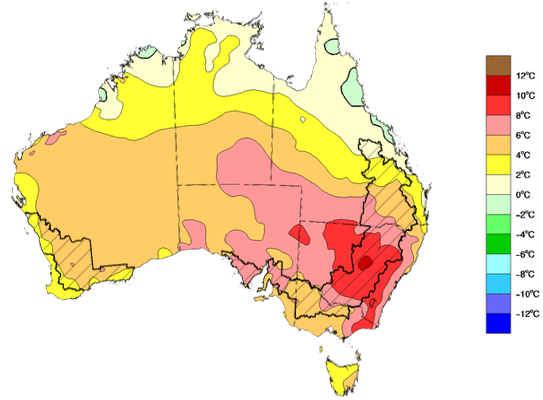
The maximum temperatures for the week ending 4 October 2023 were extremely high across much of southern two-thirds of Australia, with the highest temperature anomalies recorded across south-eastern parts of the country. Across cropping regions, day-time temperatures were at least 2°C warmer than average while central New South Wales recorded maximum temperature up to 12°C above average for this time of year.
The combination of reduced crop prospects associated with these well above average temperatures and strong fodder prices may be providing producers in regions with declining grain yield potentials. This will provide a strong incentive to cut some crops that were planted for grain production for hay. In some regions, particularly in Queensland and northern New South Wales, some crops may not have produced sufficient biomass to warrant fodder conservation and may instead be grazed off to allow for economic return to some farmers.
Maximum temperature anomaly for the week ending 4 October 2023
Issued: 4/10/2023
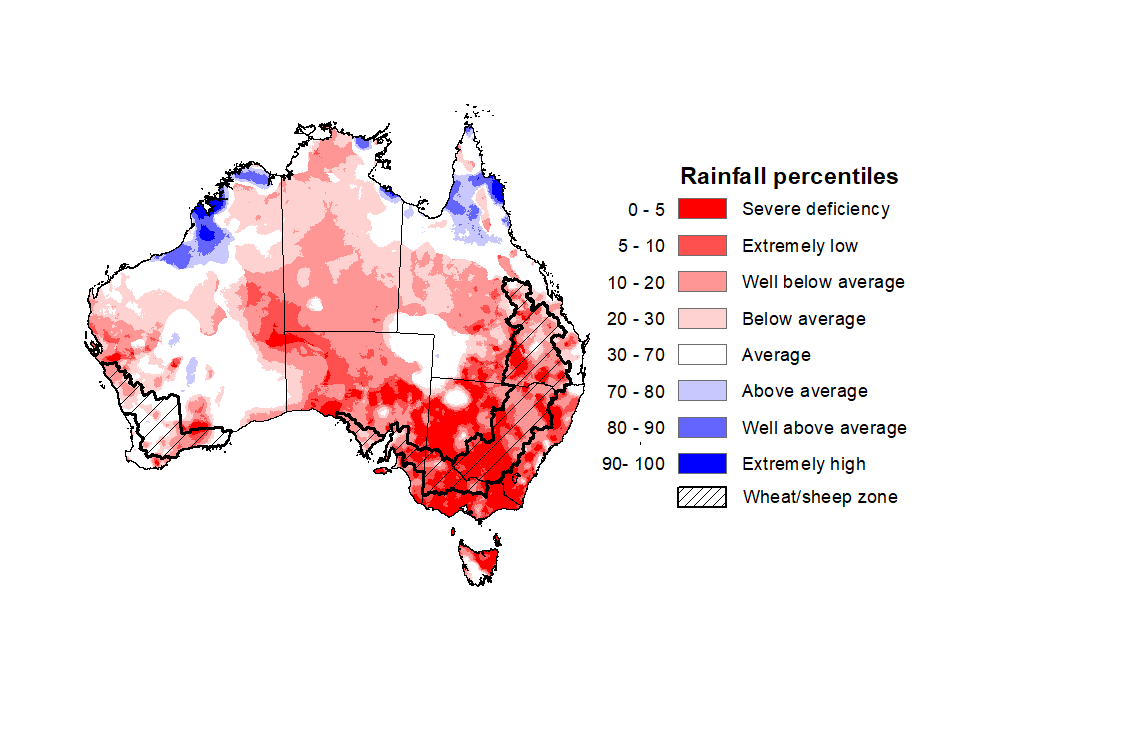
September 2023 was the driest September on record with total rainfall 71% below long-term average. It was severely deficient to below average for much of the southern two-thirds of the country and above average for parts of northern Queensland, Northern Territory and Western Australia.
In cropping regions, September rainfall was extremely low to below average, except for in central Western Australia where it was average. With a continuous decline in the sub-soil moisture seen across numerous regions and above average day-and night-time temperatures, below average September rainfall has exposed crops to increased moisture stress and could cause significant reductions in yield potential.
Rainfall percentiles for September 2023
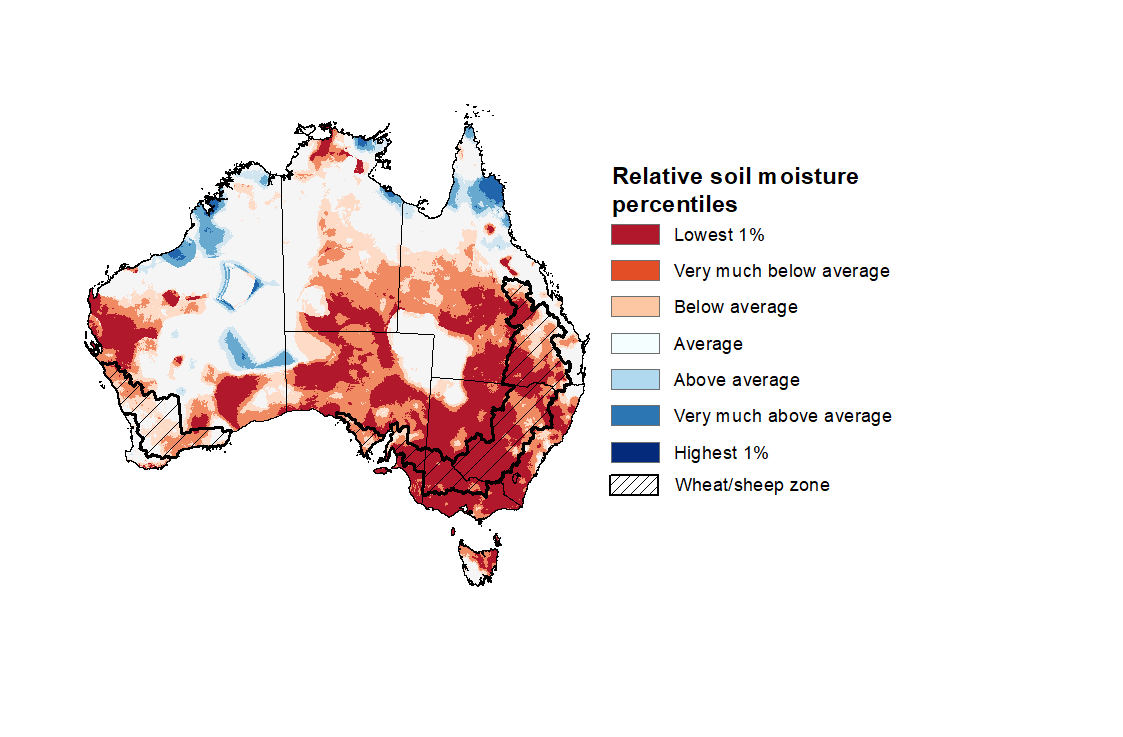
Upper layer soil moisture in September 2023 was above average to extremely high for the northern Australia and central Western Australia. It was extremely low to below average across much of the remainder of the country.
At this time of year, upper layer soil moisture is less critical for well-established winter crops. However, upper layer soil moisture will be critical for supporting the germination and establishment of summer crops in the coming months. In cropping regions, upper layer soil moisture was generally below average to extremely low and presents a significant production risk to summer crops and pasture growth. However, it was close to average across parts of Western Australia.
Modelled upper layer soil moisture for September 2023
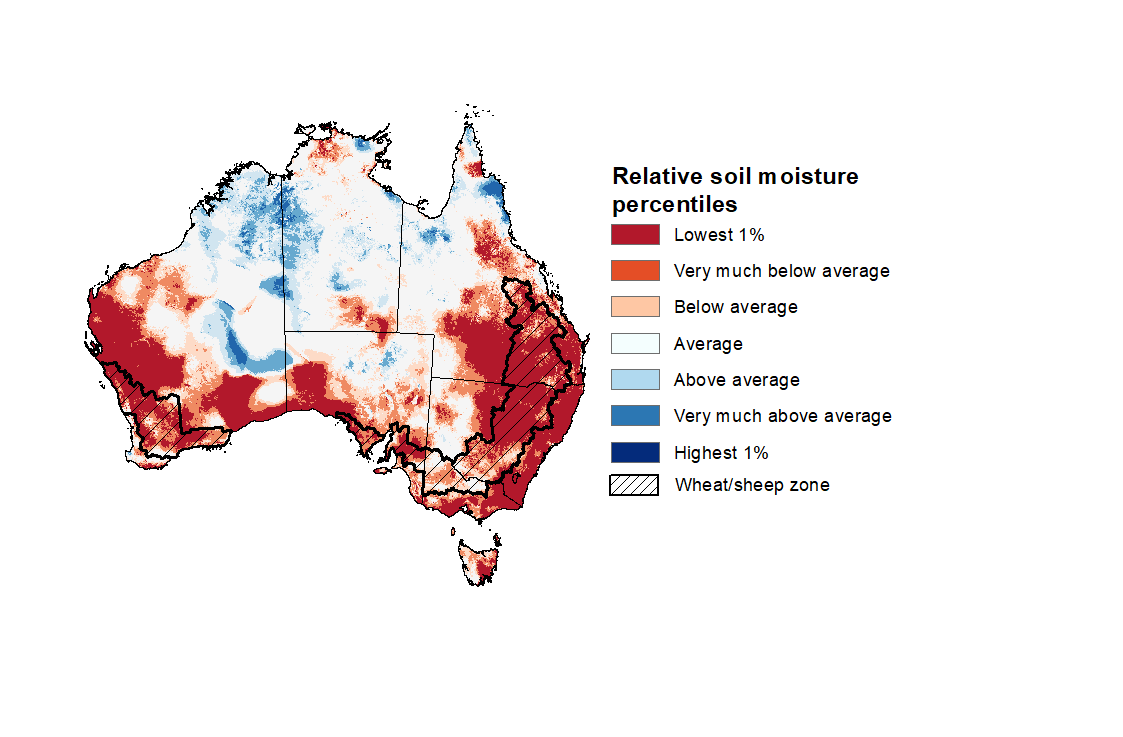
Relative lower layer soil moisture for September 2023 was average to above average across most of northern and central Australia while it was very much below average across much of southern, western and eastern Australia.
Lower layer soil moisture is a larger, deeper store that is slower to respond to seasonal conditions and tends to reflect the accumulated effects of events that have occurred over longer periods. Lower layer soil moisture is important for winter crops as they enter flowering and grain filling in spring season, particularly given the warm and dry spring rainfall outlook.
In cropping regions, lower layer soil moisture was extremely low to below average, except for in parts of northern and southern Victoria where it was generally average. Areas with persistent below average levels of lower layer soil in recent months would weigh on crop and livestock producers’ decision-making as we enter the spring and summer crop planting season and peak pasture growth period.
Modelled lower layer soil moisture for September 2023
Pasture growth during the July to September period is typically low across large areas of central and northern Australia as it is in the dry season. Across southern Australia, July to September pasture growth influences the number of livestock than can be supported without supplementary feeding over winter and the level of reliance on hay and grain during this period.
Modelled pasture growth was above average to extremely high in parts of western New South Wales, southern Victoria, in scattered areas of South Australia, Northern Territory and northern Western Australia, and across much of Tasmania. This growth is likely to enable farmers to continue to maintain stock numbers and provide opportunities to replenish fodder supplies during spring.
In contrast, modelled pasture growth was extremely low to below average across large areas of western and eastern parts of the country. These below average levels of pasture growth have seen a shift from maintaining livestock number to a period of destocking. Given a relatively dry winter season, livestock producers in areas with below average pasture availability will require substantial rainfalls through spring to build soil moisture level and encourage pasture growth during the springtime peak, or switch to an extensive supplementary feeding program to maintain current stock numbers and avoid further destocking.
Relative pasture growth for 3-months ending September 2023 (1 July 2023 to 30 September 2023)
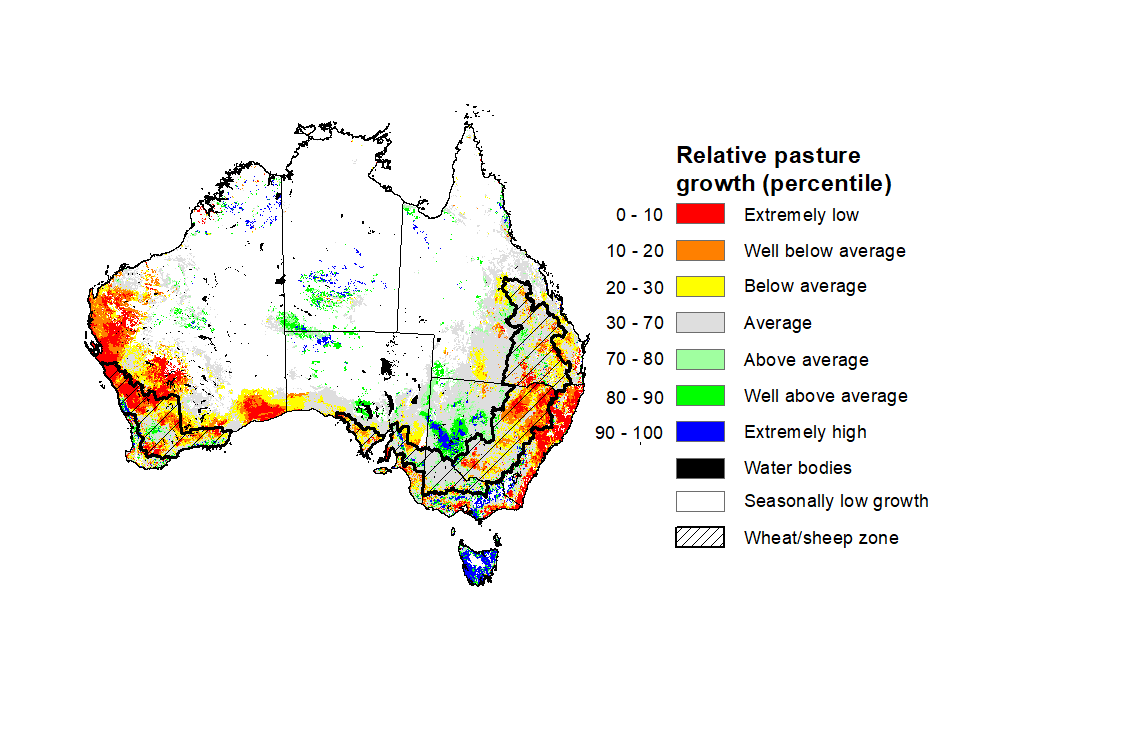
Source: Queensland Department of Science, Information Technology, and Innovation.
Over the 8-days to 11 October 2023, a low-pressure system, fronts and troughs will generate showers and storms across the eastern states with eastern Victoria and southern New South Wales receiving up to 100 millimetres of rainfall. Dry conditions are expected elsewhere.
Across cropping regions, falls of between 10 and 100 millimetres are forecast for much of New South Wales and central and eastern Victoria. If realised these falls are likely to benefit yield prospects for winter crops in the flowering and grain fill stages of growth, but unfortunately may arrive too late to improve the yield prospected in crops that have already started to ripen. Also following this week of extreme heat, the rainfall is likely to arrest any further declines in yield but are not likely to boost loss yield due to the heat.
ln contrast, minimal rainfall totals of up to 10 millimetres are expected in Queensland, South Australia, southern Western Australia and western Victoria. Following a very dry September in many regions and given the current well below average levels of soil moisture, crops and pastures in Queensland, northern New South Wales and northern Western Australia will be disposed to heat and moisture stress, negatively affecting production potential.
Total forecast rainfall for the period 4 October 2023 to 7 October 2023
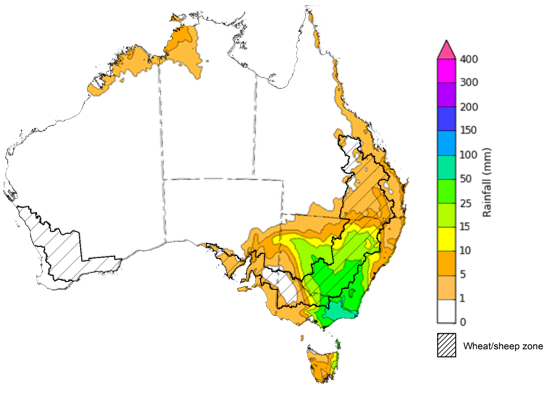
Issued 4/10/2023
Note: This rainfall forecast is produced from computer models. As the model outputs are not altered by weather forecasters, it is important to check local forecasts and warnings issued by the Bureau of Meteorology.
Total forecast rainfall for the period 8 October 2023 to 11 October 2023
Issued 4/10/2023
Note: This rainfall forecast is produced from computer models. As the model outputs are not altered by weather forecasters, it is important to check local forecasts and warnings issued by the Bureau of Meteorology.
Water
Water storages, water markets and water allocations - current week
The Tableau dashboard may not meet accessibility requirements. For information about the contents of these dashboards contact ABARES.

Commodities
Information on weekly price changes in agricultural commodities is now available at the Weekly commodity price update.