
Key issues
- For the week ending 5 April 2023, a low-pressure trough extending from west to east across the country was responsible for thunderstorms and heavy rainfall across large parts of central western and eastern Australia. In the Western Australia, another low-pressure system offshore from the Pilbara brought showers, thunderstorms, and heavy rainfall.
- In cropping regions, rainfall totals of between 25 and 100 millimetres were recorded across northern and central Western Australia. Rainfall totals between 10 and 25 millimetres were recorded across isolated areas of northeast and southeast New South Wales, and in the northern and south-eastern Queensland. Little to no rainfall was recorded across the remaining cropping regions over the past 7 days (see Section 1.1).
- Rainfall during March 2023 was around 7% below the long-term average. Rainfall was above average for much of the central Northern Territory extending through the Gulf Country into western and central Queensland, large areas of western to central Western Australia, across pockets of eastern Australia, and the northern half of Tasmania. In contrast, rainfall was below average for much of the Top End and areas between Western Australia's Kimberley and the south-east of the Northern Territory, and an area spanning eastern South Australia, north-western New South Wales, and far south-west Queensland (see Section 1.2).
- For the 3 months to March 2023, above average rainfall totals and below average summer temperatures resulted in above average to extremely high pasture production for this time of year across much of northern Australia. Extremely low to below average pasture growth rates were recorded across isolated parts southern Western Australia, much of Victoria, much of New South Wales, except for in the southern cropping region, southern Queensland and in the tropical Northern Territory and Queensland owing to above average temperatures and/or below average rainfall (see Section 1.4).
- Over the 8-days to 13 April 2023, a series of troughs and lows is expected to trigger scattered showers and storms, some intense, across parts of all states and territories of Australia. A high-pressure system will bring more settled and dry condition to large areas of the interior of Australia. Across Australian cropping regions, rainfall totals of up to 15 millimetres are expected for central Western Australia and between 15 and 25 millimetres for parts of south-eastern Queensland, eastern New South Wales, eastern Victoria, and southern South Australia. Little to no rainfall is expected for the remaining cropping regions. If realised, the rainfall in the cropping regions is likely to result in some harvest delays for summer crops while also likely to build soil moisture levels in the led up to the winter cropping season and also benefit pasture growth rates and availability (see Section 1.5).
- Water storage levels in the Murray-Darling Basin (MDB) decreased between 30 March 2023 and 6 April 2023 by 83 gigalitres (GL). Current volume of water held in storage is 19 936 GL which represents 89 per cent of total capacity. This is 0.2 percent or 36 GL more than at the same time last year.
- Allocation prices in the Victorian Murray below the Barmah Choke decreased from $17 on 29 March 2023 to $16 on 6 April 2023. Prices are lower in the Murrumbidgee due to the binding of the Murrumbidgee export limit.
Climate
For the week ending 5 April 2023, a low-pressure trough extending from west to east across the country was responsible for thunderstorms and heavy rainfall across large parts of central western and eastern Australia. In the Western Australia, another low-pressure system offshore from the Pilbara brought showers, thunderstorms, and heavy rainfall.
Weekly rainfall totals greater than 25 millimetres were recorded across the Gascoyne and into Southern Interior districts, as well in the coastal parts of the Kimberly in Western Australia. Rainfall totals above 25 millimetres were also recorded in western and north-eastern Tasmania, along the ranges in Victoria and New South Wales, and in areas of coastal Queensland. A large area within the Gascoyne district of Western Australia received rainfall in excess of 100 millimetres. Dry conditions were recorded elsewhere.
In cropping regions, rainfall totals of between 25 and 100 millimetres were recorded across northern and central Western Australia. Rainfall total between 10 and 25 millimetres were recorded across isolated areas of northeast and southeast New South Wales, and in the northern and south-eastern Queensland. Little to no rainfall was recorded across the remaining cropping regions over the past 7 days. The heavy rainfalls across cropping regions in northern New South Wales and southern Queensland will have prevented field access for harvesting of what remains of early sown summer crops.
Rainfall for the week ending 5 April 2023
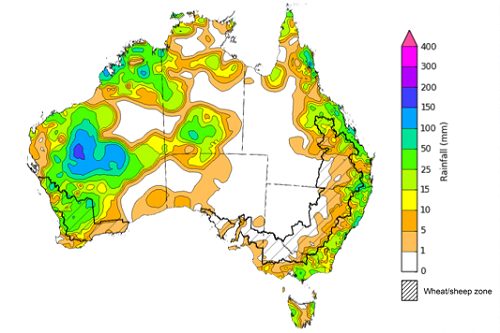
Note: The rainfall analyses and associated maps utilise data contained in the Bureau of Meteorology climate database, the Australian Data Archive for Meteorology (ADAM). The analyses are initially produced automatically from real-time data with limited quality control. They are intended to provide a general overview of rainfall across Australia as quickly as possible after the observations are received. For further information go to http://www.bom.gov.au/climate/rainfall/
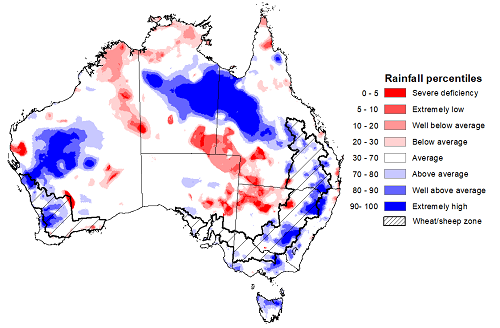
For Australia as a whole, rainfall during March 2023 was around 7% below the long-term average. Rainfall was above average for much of the central Northern Territory extending through the Gulf Country into western and central Queensland, large areas of western to central Western Australia, across pockets of eastern Australia, and the northern half of Tasmania. In contrast, rainfall was below average for much of the Top End and areas between Western Australia's Kimberley and the south-east of the Northern Territory, and an area spanning eastern South Australia, north-western New South Wales, and far south-west Queensland.
Rainfall across Australia in March was mainly attributed to a series of surface troughs and lows and embedded thunderstorms. Towards the end of March, tropical moisture combined with a tropical low to the west of Western Australia, brought several days of widespread rainfall, showers and storms to large parts of Australia. The heavy rainfall was particularly concentrated in the southwest and the Gascoyne regions in Western Australia and in the isolated parts of eastern Australia, resulting in floodings.
March rainfall was generally average to above average across cropping regions. It was above average across parts of northern and south-eastern Queensland, northeast and southern New South Wales, and central and northern Western Australia. Average rainfall was recorded across much of the remaining cropping regions. These average to above average falls across most cropping regions would have provided a boost to soil moisture levels follow a dry January and February particularly across the summer cropping regions across Queensland and northern New South Wales. This has likely benefited the growth and yield prospects of later sown summer crops, but likely to have delayed the harvest of earlier sown crops.
Rainfall percentiles for March 2023
Upper layer soil moisture in March 2023 was average to very much above average for this time of year across much of the country. Extremely high upper layer soil moisture was evident across large areas of the Gulf Country, central and western parts of Western Australia, parts of south-east Queensland, eastern and southern New South Wales and Victoria, central and southern South Australia, as well as in the northern Tasmania reflecting heavy rainfall events towards the end of March.
At this time of year, upper layer soil moisture is important for the establishment and vegetative growth of late planted summer crops in the Central Queensland growing region and for pasture growth across northern Australia. It is also important indicator of the ability to access paddocks to undertake harvest of summer crops and planting activities for long season winter crops.
Upper layer soil moisture was average to above average for this time of year across most cropping regions. Upper layer soil moisture was below average for isolated parts of northwest New South Wales and eastern Western Australia. Extremely high upper layer soil moisture was evident across eastern Queensland, northeast and southeast New South Wales, eastern Victoria and northern and parts of northwest Western Australia. Extremely high upper layer soil moisture may have prevented field access for growers across parts of New South Wales and south-east Queensland. The above average to average upper layer soil moisture in parts of northern Queensland is likely to have benefited have late sown summer crops, but likely negatively affected field access for cotton harvesting to commence and field preparation for winter sowing.
Modelled upper layer soil moisture for March 2023
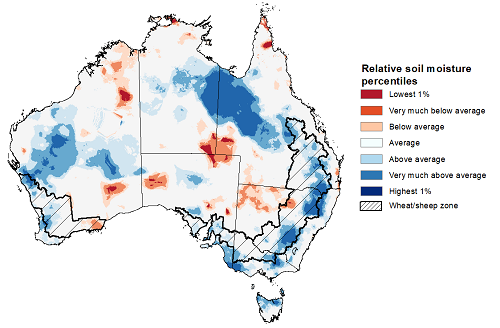
Source: Bureau of Meteorology (Australian Water Resources Assessment Landscape model)
Lower layer soil moisture for March 2023 was well below average to average across much of the southern Australia, while it was extremely high across large areas of northern Australia. Lower layer soil moisture is a larger, deeper store that is slower to respond to seasonal conditions and tends to reflect the accumulated effects of events that have occurred over longer periods. Crop development and pasture growth in areas of above average lower layer soil moisture are typically less reliant on in-season rainfall than in areas with below average lower layer soil moisture.
In cropping regions, lower layer soil moisture was generally average. However, it was extremely low to below average in the isolated parts of Queensland, northwest and southern New South Wales, parts of northern Victoria, and in the western, southern and eastern Western Australia. March rainfall has generally benefitted lower layer soil moisture levels across most growing regions, this is likely to arrest further declined in the yield potential in later sown summer crops and provide increased confidence to plant longer season winter crops. Pasture growth in northern parts of Queensland and the Northern Territory has likely benefited from high lower layer soil moisture.
Modelled lower layer soil moisture for March 2023
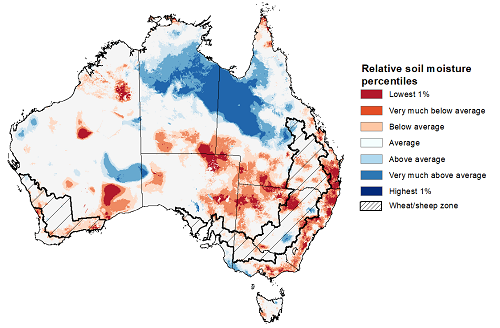
Source: Bureau of Meteorology (Australian Water Resources Assessment Landscape model)
January to March is the peak pasture growth period across much of northern Australia which typically provides the bulk of feed to maintain production through the low pasture growth months of the northern dry season. Across southern Australia, January to March pasture growth is typically low reflecting lower rainfall totals, high temperatures and high evapotranspiration rates at this time of year. Pasture availability during this period influences the growth and branding and marking rates of lambs and calves, livestock turnoff and the production of meat, milk, and wool.
For the 3 months to March 2023, above average rainfall totals and below average summer temperatures resulted in above average to extremely high pasture production for this time of year across much of northern Australia. Extremely low to below average pasture growth rates were recorded across isolated parts of southern Western Australia and the Kimberley, much of Victoria and New South Wales (except for in the southern New South Wales cropping region), southern Queensland and in the tropical Northern Territory and Queensland owing to above average temperatures and/or below average rainfall.
Average to extremely high pasture production across much of northern Australia and isolated parts in the New South Wales and Victoria will likely enable farmers to continue to rebuild stock numbers and provide opportunities to build standing dry matter availability. Above average temperatures and below average rainfall across eastern New South Wales and south-eastern Queensland may have restricted summer pasture growth, however, it comes after extremely high pasture growth during winter and spring that supplied average to above average pasture availability and ample opportunities to conserve excess fodder.
Relative pasture growth for 3-months ending March 2023 (1 January 2023 to 31 March 2023)
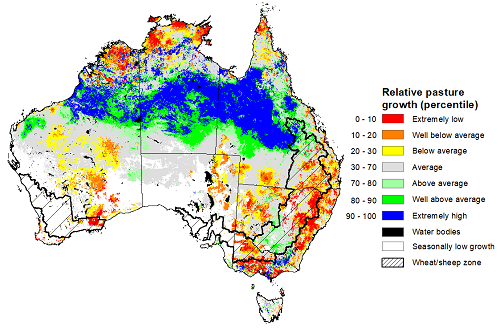
Source: Queensland Department of Science, Information Technology, and Innovation
Over the 8-days to 13 April 2023, a series of troughs and lows is expected to trigger scattered showers and storms, some intense, across parts of all states and territories of Australia. A high-pressure system will bring more settled and dry condition to large areas of the interior of Australia.
Rainfall between 15 and 50 millimetres is expected across inland and northern Western Australia, including the Gascoyne, Pilbara, and Kimberley. Similar rainfall totals are likely across the tropical north and southeast of the country, including much of eastern Victoria, Tasmania, and across and around the Great Diving Range in the New South Wales and southeast Queensland. Around 10 to 15 millimetres of rainfall is expected in the Eyre and Yorke Peninsula regions in South Australia and in the southwest Western Australia. Rainfall in excess of 50 millimetres is expected in the coastal northwest Western Australia and in parts of southeast Victoria. Little to no rain is expected elsewhere.
Across Australian cropping regions, rainfall totals of up to 15 millimetres are expected for central Western Australia and between 15 and 25 millimetres for parts of south-eastern Queensland, eastern New South Wales, eastern Victoria, and southern South Australia. Little to no rainfall is expected for the remaining cropping regions in the next eight days. If realised, the rainfall in the cropping regions is likely to result in some harvest delays for summer crops. For those area of the Australian wheatbelt where rainfall is forecast over the coming 8-days it is likely to build soil moisture levels in the led up to the winter cropping season and also benefit pasture growth rates and availability.
Total forecast rainfall for the period 6 April to 13 April 2023
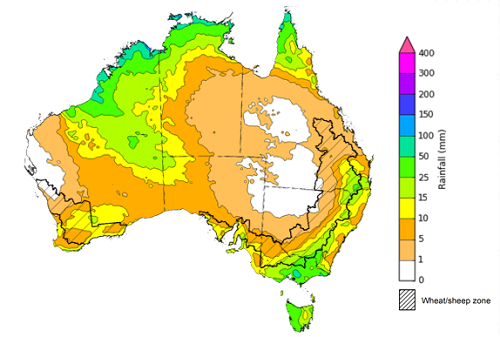
Note: This rainfall forecast is produced from computer models. As the model outputs are not altered by weather forecasters, it is important to check local forecasts and warnings issued by the Bureau of Meteorology.
Water
Water storages, water markets and water allocations - current week
The Tableau dashboard may not meet accessibility requirements. For information about the contents of these dashboards contact ABARES.

Commodities
Information on weekly price changes in agricultural commodities is now available at the Weekly commodity price update.