
Key issues
- In the week ending 7 February 2024, passage of ex-Tropical Cyclone Kirrily brought heavy falls across Queensland, New South Wales and parts of eastern Victoria. A high-pressure system kept remainder of the country generally dry.
- Over the coming days, troughs will generate showers in the tropics, extending into southern Queensland and northern New South Wales. Onshore winds are expected to bring showers to the coastal east. A high-pressure system will keep elsewhere dry.
- Rainfall where expected will support development of summer crops and pasture growth but dry conditions elsewhere, particularly in Western Australia, will continue to see a decline in soil moisture levels. Significant rainfall in autumn will be required in these areas to support the planting of winter crops.
- Upper and lower levels of soil moisture are average to extremely high across Australia with exceptions along coastal west. This will support above average yield prospects for summer crops and above average pasture growth for this time of year across New South Wales and southern Queensland, as well as provide confidence for planting winter crops in months to come.
- Average to extremely high pasture production across much of New South Wales, Victoria Queensland, South Australia, and the Northern Territory will likely enable farmers cease destocking activities and maintain or rebuild stock numbers and provide opportunities to replenish fodder supplies during late spring and early summer.
- An El Niño continues to weaken and the IOD returned to neutral state.
- Autumn 2024 rainfall is likely to be above median across interior parts of Australia, below median across much of Queensland, Northern Territory, New South Wales and northern parts of Western Australia and Tasmania.
- Water storage levels in the Murray-Darling Basin (MDB) decreased between 1 February 2024 and 8 February 2024 by 120 gigalitres (GL). Current volume of water held in storage is 18 633 GL. This is 13 percent or 2790 GL less than at the same time last year.
- Allocation prices in the Victorian Murray below the Barmah Choke decreased from $61 on 1 February 2024 to $42 on 8 February 2024. Prices are lower in the Murrumbidgee and the Goulburn-Broken due to the binding of the Murrumbidgee export limit and the Goulburn intervalley trade limit.
Climate
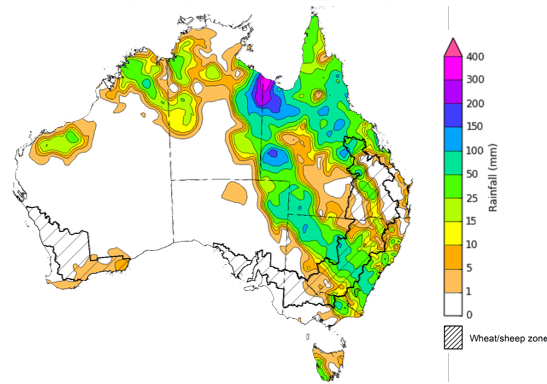
For the week ending 7 February 2024, the passage of ex-Tropical Cyclone Kirrily brought heavy falls across Queensland, New South Wales, and parts of eastern Victoria. A high-pressure system kept remainder of the country generally dry. An active monsoon trough generated storms and heavy falls in northern areas of Northern Territory and Western Australia. A front brought showers to Tasmania.
Across cropping regions, rainfall totals of up to 100 millimetres were recorded in Queensland and New South Wales. These falls will continue to support the ongoing growth and lift the yield potential of summer crops across eastern Australia. Additionally, these falls will help maintain soil moisture levels to support pasture growth and build reserves ahead of the upcoming winter cropping season. By contrast, Western Australia, South Australia, and Victoria remained dry.
Rainfall for the week ending 31 January 2024
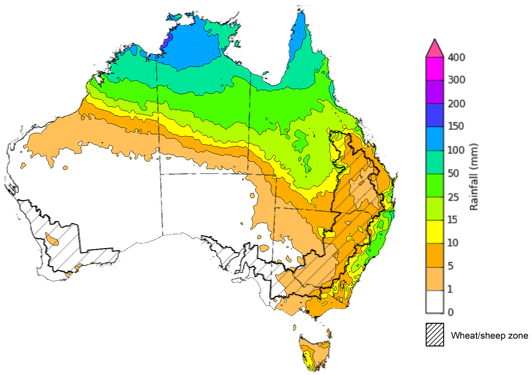
Over the 8 days to 15 February 2024, troughs will generate showers in the tropics, extending into southern Queensland and northern New South Wales. Onshore winds are expected to bring showers to the coastal region of southeast Queensland and New South Wales. A high-pressure system will keep elsewhere dry.
Across cropping regions, rainfall totals up to 25 millimetres are forecast for Queensland and up to 15 millimetres in New South Wales. If realised, these falls will continue to benefit soil moisture levels for pasture growth and support summer crops. Little to no rainfall is expected across remaining cropping regions. Western Australian cropping regions continue to experience dry conditions and declining soil moisture levels and will require significant rainfall during autumn to support the planting of winter crops.
Total forecast rainfall for the period 8 February to 15 February 2024
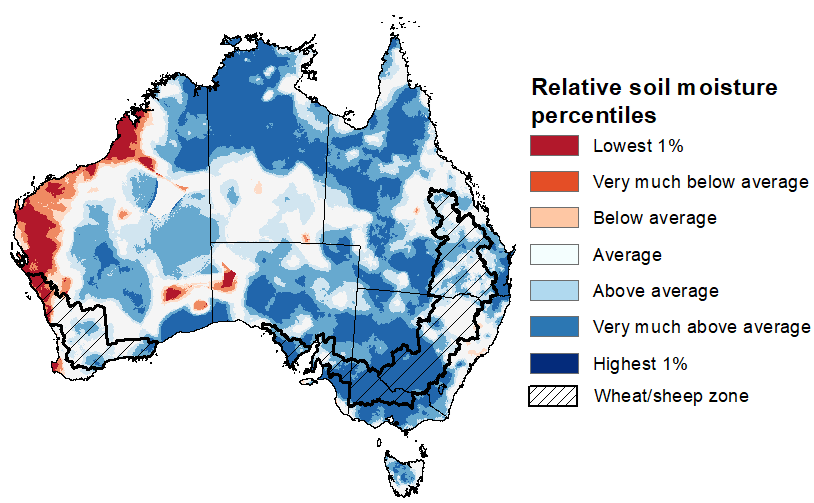
Upper layer soil moisture for January 2024 varied across Australia. Extremely low upper soil moisture was modelled for Western Australia. In contrast, extremely high upper layer moisture was evident across large areas of South Australia and Victoria, southern New South Wales, southern and eastern Queensland and in isolated areas of northern Territory, eastern Western Australia and Tasmania.
At this time of year, upper layer soil moisture is important for late planted summer crops in northern New South Wales and Queensland and for pasture growth across northern Australia since plant germination and establishment utilise this moisture. It is also an important indicator of the ability to access paddocks for the harvesting of early planted summer crops.
Upper layer soil moisture was average to above average for this time of year across most cropping regions in Queensland, New South Wales, Victoria, and South Australia, while average to below average in Western Australia. Average to above average soil moisture would have encouraged crop planting and germination for northern cropping regions.
Modelled upper layer soil moisture for January 2024
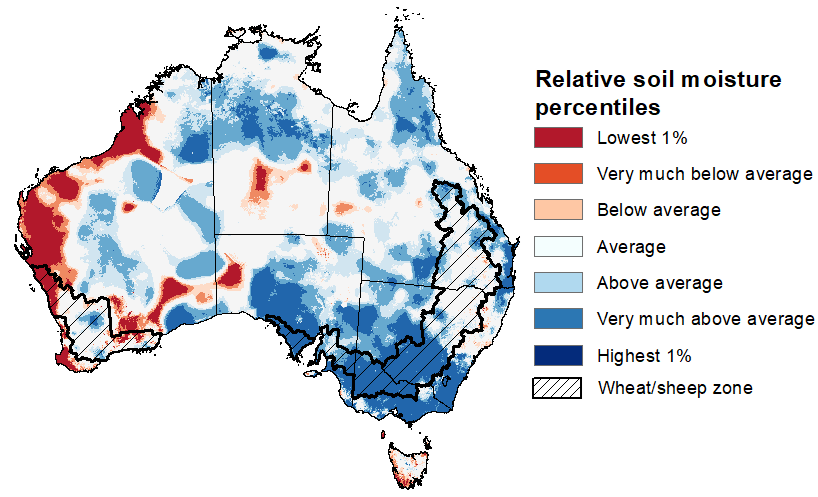
Lower layer soil moisture for January 2024 saw a similar pattern to upper layer soil moisture.
Lower layer soil moisture is important to support summer crops and pasture growth during the peak growth period. In Australian cropping regions, lower layer soil moisture was average to extremely high across much of New South Wales, Queensland, Victoria, and South Australia. Lower layer soil moisture was average to extremely low across coastal Western Australia. High levels of lower layer soil moisture will continue to support above average yield prospects for summer crops and above average pasture growth for this time of year across New South Wales and southern Queensland.
Modelled lower layer soil moisture for January 2024
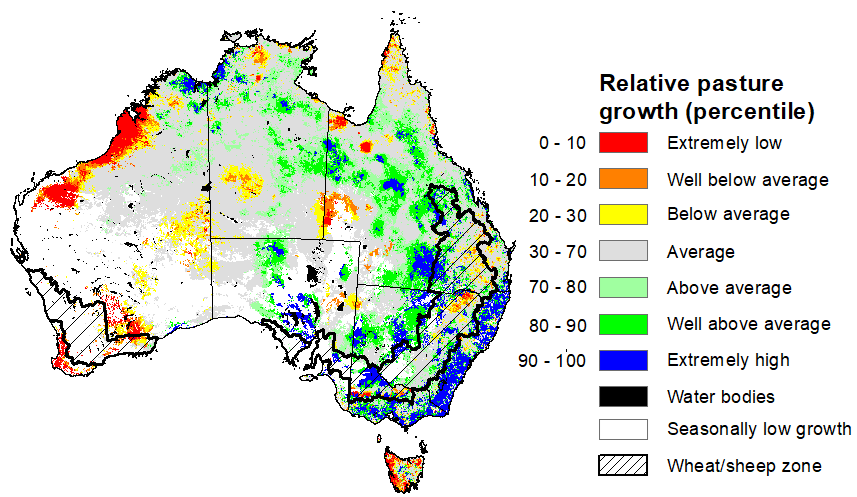
Pasture growth during the November to January period is the peak pasture growth period for northern Australia, which typical provides a bulk of feed to maintain production through the low pasture growth months of the northern dry season. Across southern Australia, November to January pasture growth is typically low reflecting lower rainfall totals, high temperature and high evapotranspiration rates at this time of year. Pasture availability during this period influences the growth and branding and marking rates of lambs and calves, livestock turnoff and the production of meat, milk, and wool.
For the 3 months to January 2024, above average rainfall totals resulted in average to well above average pasture production for this time of year across most grazing regions in New South Wales, Queensland, Victoria, South Australia, northern Western Australia, and the Northern Territory. Extremely low to below average pasture growth rates were recorded across Tasmania and southern and north-western parts of Western Australia, as well as in the interior parts of the country, consistent with above average temperatures and below average rainfall.
Average to extremely high pasture production across much of New South Wales, Victoria Queensland, South Australia, and the Northern Territory will likely enable farmers cease destocking activities and maintain or rebuild stock numbers and provide opportunities to replenish fodder supplies during late spring and early summer. Below average rainfall and well above average temperatures in Western Australia may have restricted late spring pasture growth, however, it comes after extremely high pasture growth during winter that supplied average to above average pasture availability.
Relative pasture growth for 3-months ending January 2024 (1 November to 31 January 2024)
The Bureau of Meteorology’s latest rainfall outlook for March 2024 indicates that rainfall is likely (60 to 80% chance) to be above median for central parts of the country. Below median rainfall is likely to very likely (60% to greater than 80% chance) across much of Queensland, tropics and in eastern and western coastal areas. Equal chances of below or above median rainfall is likely elsewhere.
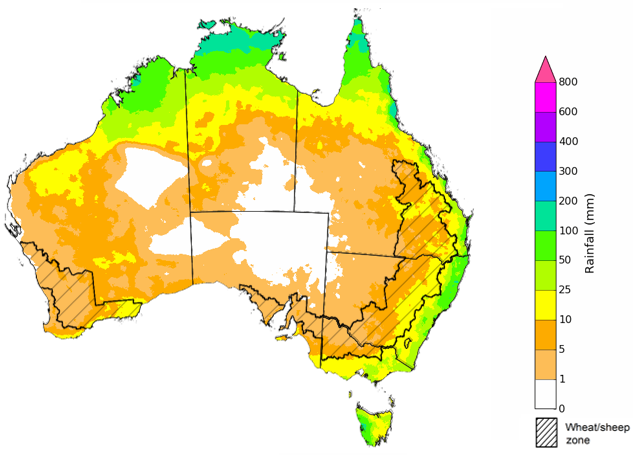
The Bureau of Meteorology’s climate model suggests that for March 2024, there is a 75% chance of rainfall totals being over 25 millimetres across coastal east and northern Australia, as well as in western Tasmania and southern Victoria. Rainfall totals in excess of 100 millimetres are expected northern Queensland and Northern Territory.
Across cropping regions, there is at least a 75% chance of rainfall totals above 10 millimetres in parts of New South Wales, Queensland, and southern Western Australia. March rainfall totals are expected to be below 10 millimetres for the remaining cropping regions.
If realised these forecast rainfall totals for March will provide some useful follow-up falls for dryland summer crop production as well as pasture growth across eastern and northern Australia. Dry conditions elsewhere will see a decline in soil moisture levels, particularly in Western Australia that has remained dry for several weeks.
Rainfall totals that have a 75% chance of occurring in March 2024
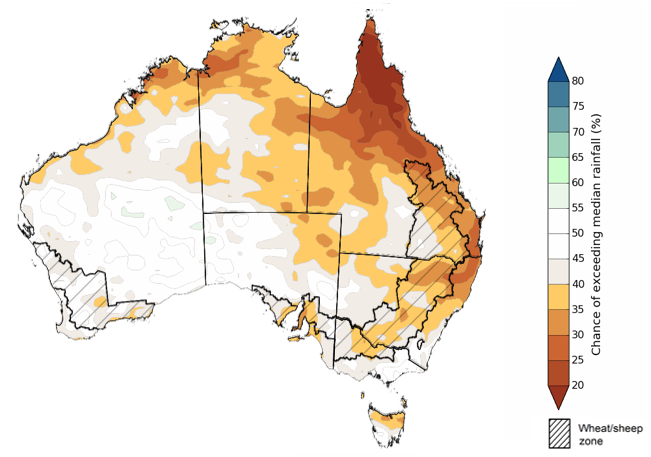
The rainfall outlook for March to May 2024 suggests that there is least a 50% chance of exceeding median rainfall across interior parts of Australia, below median across much of Queensland, Northern Territory, New South Wales and northern parts of Western Australia and Tasmania.
Across cropping regions, below median rainfall is likely in the New South Wales, Queensland and South Australia while equal chances of above or below rainfall is likely in the remaining cropping regions.
Chance of exceeding the median rainfall March to May 2024
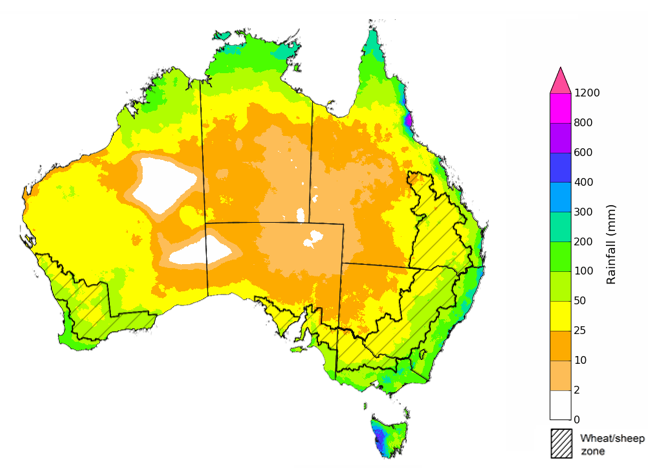
The outlook for March to May 2024 suggests there is at least a 75% chance of rainfall totals above 25 millimetres across much of Australia. The main exceptions being large areas of the interior and western coast where below 25 millimetres of rainfall are expected. Rainfall totals in excess of 200 millimetres are likely across tropical northern Australia, eastern coast and western Tasmania during this period.
Across cropping regions, there is a 75% chance of receiving at least 25 millimetres.
If realised, these falls will likely be sufficient to support autumn pasture growth across eastern and northern Australia. While the dry start to spring limited the early planting of summer crops, if realised these forecast falls are likely to be sufficient to support the establishment and growth of additional planting of summer crops in the later planting window during early summer.
Rainfall totals that have a 75% chance of occurring March to May 2024
Water
Water storages, water markets and water allocations - current week
The Tableau dashboard may not meet accessibility requirements. For information about the contents of these dashboards contact ABARES.

Commodities
Information on weekly price changes in agricultural commodities is now available at the Weekly commodity price update.