
Key issues
- For the week ending 7 December 2022, high-pressure systems brought another week of dry conditions to most of Australia. Weekly rainfall totals exceeding 50 millimetres were observed across small areas of northern and eastern Queensland, as well as the far northeast of New South Wales.
- Another week of little to no rainfall across cropping regions of Victoria, South Australia and Western Australia would have supported the maturing and harvesting of winter crops. Across much of northern New South Wales and southern Queensland little rainfall is likely to support the sowing of summer crops. The continuation of wet conditions across most of central and northern Queensland and parts of northern New South Wales is likely to have stalled winter crop harvest and summer crop planting activities and may have negatively grain quality in unharvested winter crops.
- For the 3 months to November 2022 above average rainfall and mild temperatures resulted in well above average pasture production for this time of year across most grazing regions in eastern, southern and northern Australia. This growth will likely enable farmers to continue rebuilding stock numbers and may provide opportunities to replenish fodder supplies during late spring or early summer.
- ENSO indicators suggest that La Niña is still active in the tropical Pacific and may start to ease in early 2023. La Niña events are associated with above-average rainfall for northern and eastern Australia during the summer. The SAM is positive and likely to be positive to neutral through December. In summer, positive SAM typically increases the chance of above-average rainfall for parts of eastern Australia and below-average rainfall for western Tasmania. The 2022 negative IOD event is over now with little influence on Australian climate.
- The rainfall outlook for January to March 2023 suggests there is no strong tendency towards above or below median rainfall across much of Australia. Across cropping regions, there is a 75% chance of receiving less than 50 millimetres in the cropping regions of south-western New South Wales, Victoria, South Australia and Western Australia. There is a 75% chance of receiving between 50 and 200 millimetres across the remainder of New south Wales and Queensland.
- Over the 8-days to 15 December 2022, rainfall totals of between 10 to 50 millimetres are expected across cropping regions in eastern Queensland, scattered areas of eastern New South Wales, as well as parts of southern Western Australia. Little to no rainfall is forecast for remaining cropping regions during the next 8-days. Little to no rainfall forecast across most cropping regions will provide favourable conditions for winter crop harvesting and summer crop planting following three relatively dry weeks.
- Water storage levels in the Murray-Darling Basin (MDB) increased between 30 November 2022 and 7 December 2022 by 37 gigalitres (GL). Current volume of water held in storage is 23 989 GL which represents 95 percent of total capacity. This is 5 percent or 1195 GL more than at the same time last year.
- Allocation prices in the Victorian Murray below the Barmah Choke increased from $37 per ML on 1 December to $40 per ML on 8 December 2022. Prices are lower in the Goulburn-Broken, Murrumbidgee and regions above the Barmah choke due to the binding of the Murrumbidgee export limit, Goulburn intervalley trade limit and Barmah choke trade constraint.
Climate
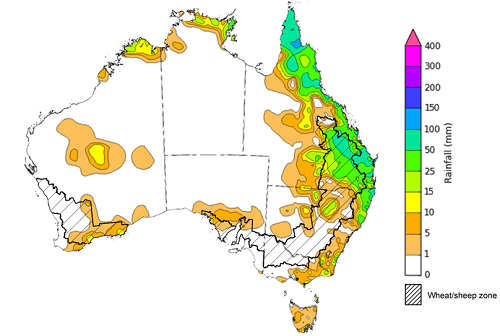
For the week ending 7 December 2022, high-pressure systems brought another week of dry conditions to most of Australia. Weekly rainfall totals exceeding 50 millimetres were observed across small areas of northern and eastern Queensland, as well as the far northeast of New South Wales.
In Australian cropping regions, rainfall totals of between 15 and 100 millimetres were recorded across most of Queensland and small area of northern New South Wales. Little to no rainfall was recorded in remaining cropping regions for the week ending 7 December 2022.
Another week of little to no rainfall across cropping regions of Victoria, South Australia and Western Australia would have supported the maturing and harvesting of winter crops. Across much of northern New South Wales and southern Queensland little rainfall is likely to support the sowing of summer crops. The continuation of wet conditions across most of central and northern Queensland and parts of northern New South Wales is likely to have stalled winter crop harvest and summer crop planting activities and may have negatively grain quality in unharvested winter crops.
Rainfall for the week ending 7 December 2022
Note: The rainfall analyses and associated maps utilise data contained in the Bureau of Meteorology climate database, the Australian Data Archive for Meteorology (ADAM). The analyses are initially produced automatically from real-time data with limited quality control. They are intended to provide a general overview of rainfall across Australia as quickly as possible after the observations are received. For further information go to http://www.bom.gov.au/climate/rainfall/
Pasture growth during the September to November period is typically low across large areas of central Australia as it is the end of the dry season. Across southern Australia, September to November is the peak pasture growth period which typically provides a bulk of feed and allows for fodder conservation to maintain production through the low pasture growth months of summer. It also influences the growth, branding and marking rates of lambs and calves, and the production of meat, milk, and wool over this peak production period.
For the 3 months to November 2022 above average rainfall totals and mild temperatures resulted in well above average pasture production for this time of year across most grazing regions in eastern, southern and northern Australia.
Modelled pasture growth was above average to extremely high across much of New South Wales, Victoria, Queensland, South Australia and parts of Western Australia. This growth will likely enable farmers to continue rebuilding stock numbers and provide opportunities to replenish fodder supplies during late spring or early summer, if conditions. such as dry warm weather suitable for fodder conservation continue over the coming weeks. In contrast, modelled pasture growth was extremely low to below average across scattered areas of central, eastern and southern New South Wales, southern Queensland, South Australia, and southern parts of Western Australian. In some regions this low pasture growth likely reflects a decline in plant growth due to excess moisture.
Relative pasture growth for 3-months ending November 2022 (1 September to 30 November 2022)
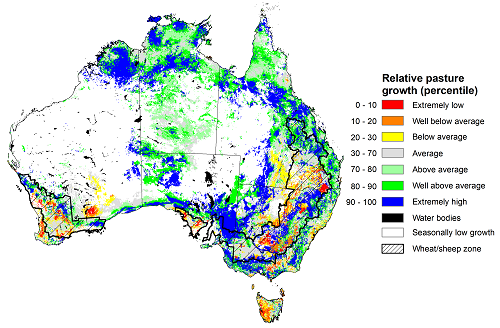
Source: Queensland Department of Science, Information Technology and Innovation
Throughout Australia’s summer period the climate drivers with the largest potential impact on Australia’s climate patterns are the El Niño–Southern Oscillation (ENSO), the Southern Annular Mode (SAM), and the Madden-Julian Oscillation (MJO). These climate drivers are likely to influence the growth and development of summer crops in northern growing regions and pasture growth across northern Australia with the onset of the northern wet season.
La Niña continues in the tropical Pacific, with atmospheric and oceanic indicators reflecting a mature La Niña event. Cool sea surface temperature (SST) anomalies have persisted in the central and eastern equatorial Pacific Ocean in recent weeks. However, the strength and extent of cool SST anomalies have eased across the eastern Pacific Ocean. Warmer than average temperatures continue in the far-west of the Pacific, across the Maritime Continent, and to the northeast of Australia. Warm temperature anomalies have also reduced in strength. Trade winds have been stronger than average in the western Pacific and cloudiness has also remained mostly below average near the Date Line, which reflect the ongoing La Niña event.
Sea surface temperature across the northern Indian Ocean has been reduced to be generally close to average over last three weeks, reflecting the IOD event at neutral level. The 2022 negative IOD event is over, suggesting fading influence on Australian rainfall patterns now.
The SAM is currently weakly positive and likely to be neutral to positive through December. An MJO of weak strength is currently active over the western Pacific Ocean and expected to move eastwards and remain weak for much of the coming days. Given current and expected conditions, including the La Niña event and a positive SAM, above average rainfall is expected to persist across northern and eastern Australia and below average rainfall for western Tasmania over the coming weeks.
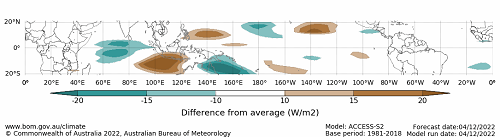
Difference from average sea surface temperature observations 28 November to 4 December 2022
![Map showing the global sea surface temperature observations difference from average during the previous week. The climatology baseline used is 1961 to 1990. Image provided by the Bureau of Meteorology. Please refer to accompanying text for a more detailed description.]](/sites/default/files/images/20221122.ssta_global_weekly_0.png)
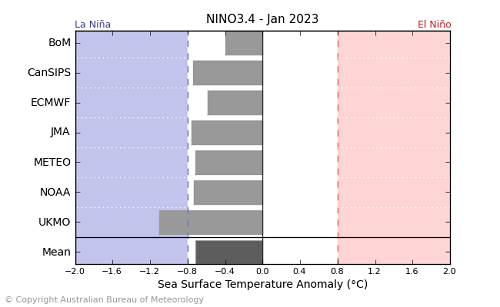
International climate model outlooks for the NINO 3.4 region in January 2023
Issued: 06/12/2021
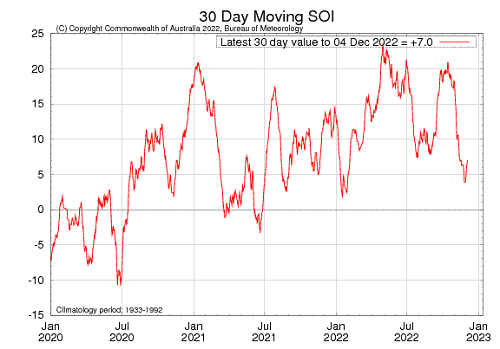
The La Niña event currently underway in the Pacific Ocean is expected to persist through the end of 2022 but start to ease in early 2023 (i.e. in mid to late summer). All seven of the international models surveyed predict the La Niña event to remain active in December, but all models expect the La Niña event to dissipate by February 2023. For the period ending 4 December, the 30-day Southern Oscillation Index (SOI) value was +7.0 and the 90-day value was +13.7. The 30-day value has recently dropped below the La Niña threshold of +7 but then risen again over the past fortnight, while the 90-day value remains stable and above the threshold. La Niña events are associated with above average rainfall across eastern and northern Australia during early summer.
30-day Southern Oscillation Index (SOI) values ending 4 December 2022
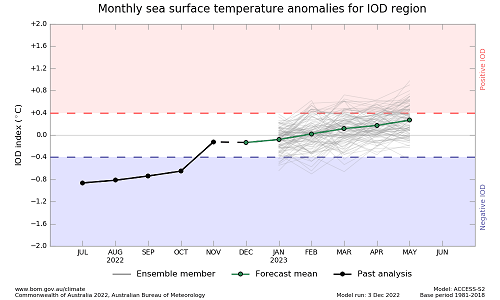
The negative IOD event in the Indian Ocean, which has persisted since mid-June, is over with IOD index values having been within neutral bounds for five consecutive weeks. As of ending 4 December 2022, the Indian Ocean Dipole (IOD) weekly index value was -0.16°C.
Sea surface temperature anomalies across the Indian Ocean dissipated over recent weeks, with temperatures returning generally close to average. Warmer than average sea surface temperatures have eased to the northwest of Australia compared to two weeks ago, while cooler than average sea surface temperatures near the horn of Africa have receded. Warm sea surface temperatures in the east of the Indian Ocean tend to result in wetter conditions in summer. All international climate models surveyed by the Bureau of Meteorology predict the neutral IOD event to persist throughout December and January.
Monthly sea surface temperature anomalies for IOD region
International climate model outlooks for the IOD in January 2023
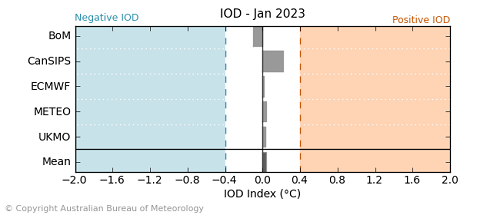
Issued: 06/12/2022
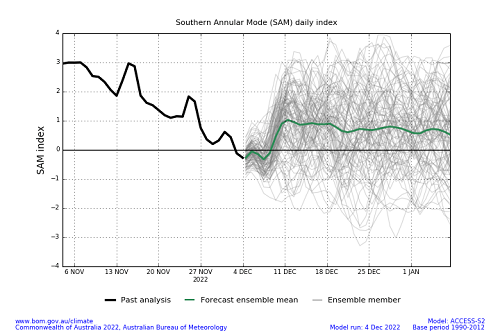
The Southern Annular Mode (SAM) is currently weakly positive and expected to be neutral to positive through December. The SAM refers to the north-south shift of the band of rain-bearing westerly winds and weather systems in the Southern Ocean compared to the usual position. A positive SAM in summer months is associated with increased rainfall for parts of north-eastern Tasmania, eastern Victoria, eastern New South Wales and south-eastern Queensland. It is also associated with decreased rainfall for western Tasmania.
Southern Annular Mode (SAM) daily index
As of 4 December 2022, the Madden–Julian Oscillation (MJO) is at weak strength over the western Pacific Ocean and expected to remain weak for much of the coming fortnight. The MJO is a pulse of cloud and rainfall that moves eastwards along the equator. An active MJO in the Pacific at this time of year increases the chance of below average rainfall across northern Australia.
Madden–Julian Oscillation (MJO) daily index
These climate outlooks are generated by ACCESS–S (Australian Community Climate Earth-System Simulator–Seasonal). ACCESS–S is the Bureau of Meteorology's dynamic (physics-based) weather and climate model used for monthly, seasonal, and longer-lead climate outlooks. For further information, go to http://www.bom.gov.au/climate/ahead/about/
The Bureau of Meteorology’s latest rainfall outlook for January 2023 indicates there is no strong tendency towards above or below median rainfall for much of Australia. The ACCESS-S climate model suggests there is a 60% to 80% chance of exceeding median rainfall for scattered areas of northern, north-eastern and south-eastern Australia, as well as much of eastern Tasmania. Meanwhile, there is a 60% to 80% chance of below median rainfall for areas of northern and southern Western Australia and parts of central Australia.
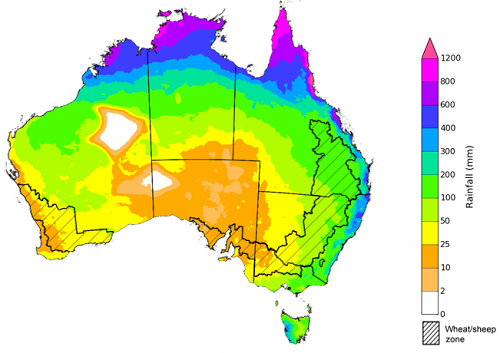
The outlook for January 2023 indicates that there is a 75% chance of rainfall totals between 10 and 200 millimetres across central and eastern New South Wales, much of Queensland, southern Victoria, much of the Northern Territory, and northern Western Australia, as well as Tasmania. For the remainder of Australia, rainfall totals are not expected to exceed 10 millimetres. Rainfall totals in excess of 200 millimetres are expected across north tips of Queensland and the Northern Territory.
Across cropping regions there is a 75% chance of rainfall totals of between 10 and 50 millimetres across much of New South Wales and Queensland, as well as parts of eastern Victoria. There is a 75% chance of less than 10 millimetres of rainfall for cropping regions in Western Australia, South Australia, and the remainder of Victoria, and the far south-west of New South Wales.
Given above average to well above average soil moisture level across most growing regions in eastern Australia this forecast rainfall is unlikely to further benefit winter crop yields but will allow for average or better pasture growth potential. Given the current wet conditions and an expectation for above average rainfall for the coming months, we are likely to see a drawn-out 2022 winter crop harvest and difficulties in completing intended summer crop planting in many regions.
Rainfall totals that have a 75% chance of occurring January 2023
Issued:08/12/2022
The rainfall outlook for January to March 2023 suggests there is no strong tendency towards above or below median rainfall across much of Australia. There is a greater than 55% chance of exceeding median rainfall across scattered areas of eastern Australia and northern Queensland. However, below median rainfall is more likely for southern areas of South Australia and Western Australia and scattered areas of northern New South Wales between January to March.
Bureau of Meteorology rainfall outlooks for January to March have greater than 55% past accuracy across most of Australia. Outlook accuracy is greater than 65% across parts of Queensland, South Australia, and the west coast and north parts of Western Australia. Past accuracy is low (less than 50%) for isolated parts of Western Australia, Queensland, the Northern Territory, and New South Wales.
Chance of exceeding the median rainfall January to March 2023
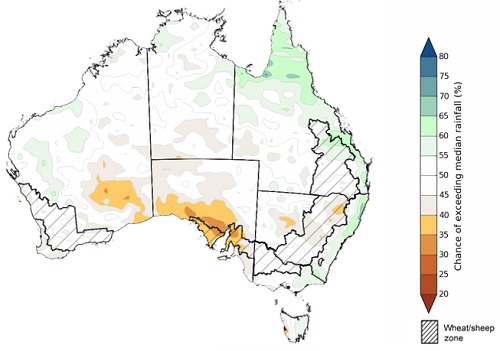
Issued: 08/12/2022
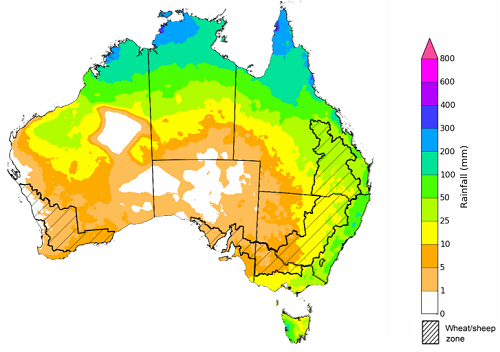
The outlook for January to March 2023 suggests there is a 75% chance of rainfall totals between 25 and 200 millimetres across most of New South Wales, Victoria, Queensland, the Northern Territory, Tasmania, as well as much of Western Australia. Rainfall totals in excess of 200 millimetres are forecast for the north and east of Queensland, and northern parts of Western Australia and the Northern Territory, as well as isolated parts of alpine and eastern New South Wales, alpine Victoria, and south-west Tasmania.
Across cropping regions, there is a 75% chance of receiving less than 50 millimetres in the cropping regions of south-western New South Wales, Victoria, South Australia and Western Australia. There is a 75% chance of receiving between 50 and 200 millimetres across the remainder of New south Wales and Queensland.
These rainfall totals are close to average for this three-month period across most New South Wales and Queensland cropping regions, and slightly below average for cropping regions in Victoria, South Australia and Western Australia. The wet finish to the 2022 winter cropping season may push harvesting activities into January 2023, which will be supported by the prospect of below average rainfall. Likewise, planting of summer crops in parts of New South Wales and Queensland may be delayed until January. Soil moisture levels across southeast cropping regions are well above average due to the substantial rainfall in October and November. Therefore, below average rainfall in January is unlikely to negatively impact summer crop growth. In Western Australia and South Australia, average to below average rainfall over the next few months will likely allow the harvesting of winter crops to progress with minimal interruption.
Rainfall totals that have a 75% chance of occurring January to March 2023
Issued: 08/12/2022
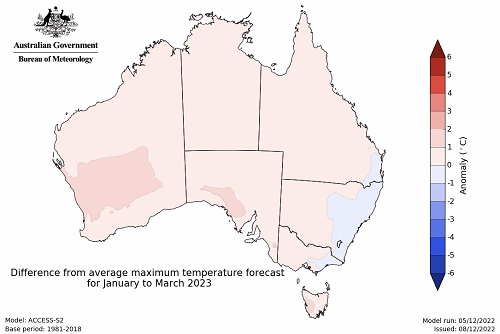
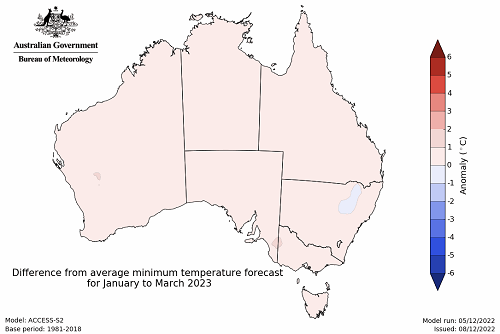
The temperature outlook for January to March 2023 indicates that maximum temperatures across most of Australia are likely to be close to the 1990-2012 average (the difference in the range of - 1°C to +1°C), with slightly higher than average maximum temperatures across central Western Australia and South Australia. Minimum temperatures across most of Australia are expected to be close to the 1990-2012 average (the difference in the range of 0°C to +1°C) (Bureau of Meteorology ‘National Climate Outlook’, 8 December 2022).
Predicted maximum temperature anomaly for January to March 2023
Predicted minimum temperature anomaly for January to March 2023
Over the 8-days to 15 December 2022, high-pressure systems are forecast to bring another week of mainly dry conditions to much of Australia. Meanwhile, low-pressure systems and a broad trough is forecast to bring moderate rainfall to isolated area of northern Australia. Low-pressure systems and frontal activity are forecast to bring moderate to heavy rainfall to parts of eastern New South Wales, eastern Queensland, southern Victoria and Tasmania.
In Australian cropping regions, rainfall totals of between 10 to 50 millimetres are expected across eastern Queensland, scattered areas of eastern New South Wales, as well as parts of southern Western Australia. Little to no rainfall is forecast for remaining cropping regions during the next 8 days.
Another week of dry conditions is expected to provide some relief to flood-affected cropping regions of eastern Australia will likely further allow saturated soil to drain, however, a flooding risk remains to some areas as flood waters make their way further downstream. Little to no rainfall forecast across most cropping regions will provide favourable conditions for winter crop harvesting and summer crop planting following three relatively dry weeks.
Total forecast rainfall for the period 8 December to 15 December 2022

Note: This rainfall forecast is produced from computer models. As the model outputs are not altered by weather forecasters, it is important to check local forecasts and warnings issued by the Bureau of Meteorology.
Water
Water storages, water markets and water allocations - current week
The Tableau dashboard may not meet accessibility requirements. For information about the contents of these dashboards contact ABARES.
