
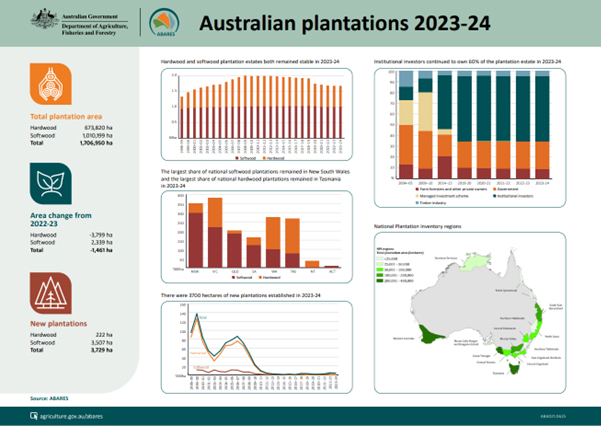
Overview
Australian plantation statistics is published every year. It supports strategic forest industry planning and decision-making by presenting information on total plantation area, new planting and ownership.
The plantation areas are presented by jurisdiction and National Plantation Inventory regions for softwood and hardwood plantation types, and species, based on data collected from private growers and grower representatives and public state and territory agencies.
In this report, 2023-24 data are compared with data from the 2004-05, 2009-10, 2014-15, 2019-20 and 2021-22 5 yearly spatial plantation reports (5 and 1 year intervals).
A high resolution version of the Australian Plantation statistics 2023-24 - Infographic is available in the download section below.
Table 1 Total plantation area remained steady in 2023-24
| State/Territory | 2004-05 | 2009-10 | 2014-15 | 2019-20 | 2021-22 | 2022-23 | 2023-24 | Change 2022-23 to 2023-24 |
|---|---|---|---|---|---|---|---|---|
| (’000 ha) | (’000 ha) | (’000 ha) | (’000 ha) | (’000 ha) | (’000 ha) | (’000 ha) | (%) | |
| New South Wales | 331.6 | 391.3 | 393 | 360.1 | 347.1 | 349.6 | 351.6 | 0.6% |
| Victoria | 384.6 | 430.5 | 423 | 386.6 | 380.9 | 381.3 | 380.7 | -0.2% |
| Queensland | 225.6 | 230.6 | 230.4 | 205.4 | 205.4 | 205.4 | 205.0 | -0.2% |
| South Australia | 167 | 188.3 | 178.8 | 172.3 | 164.6 | 164.6 | 163.5 | -0.7% |
| Western Australia | 377.6 | 413.3 | 383.4 | 309.8 | 290.6 | 289.8 | 289.3 | -0.2% |
| Tasmania | 227.2 | 309.1 | 309.8 | 282.5 | 278.5 | 271.8 | 271.2 | -0.2% |
| Northern Territory | 16.3 | 38.1 | 47.6 | 49.3 | 40.1 | 37.2 | 37.1 | -0.3% |
| Aust. Capital Territory | 9.5 | 7.7 | 7.4 | 8.7 | 8.8 | 8.6 | 8.6 | 0.0% |
| Australia | 1,739.4 | 2,008.9 | 1,973.4 | 1,774.7 | 1716.0 | 1708.4 | 1,706.9 | -0.1% |
Note: 2004-05, 2009-10, 2014-15 and 2019-20 are 5 yearly spatial figures, 2021-22, 2022-23 and 2023-24 are annual update figures.
Figure 1: Hardwood and softwood plantation estates both remained stable in 2023-24
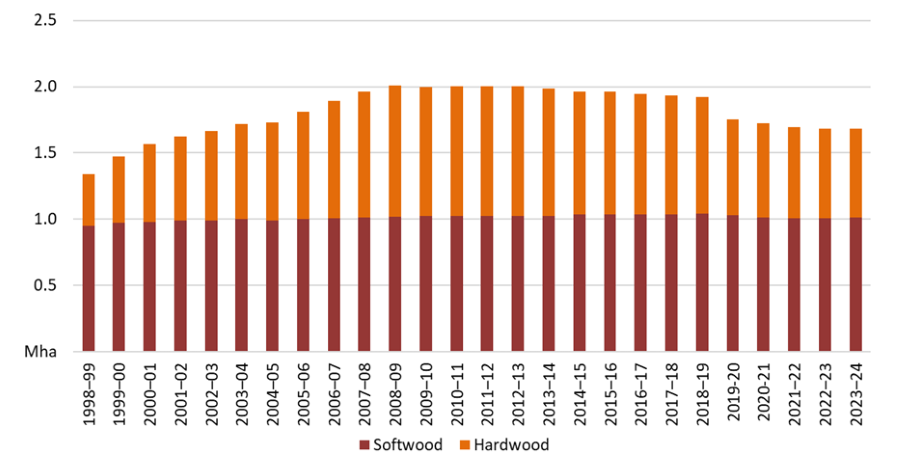
Source: ABARES
Figure 2: In 2023-24, 3700 hectares of new plantations were established
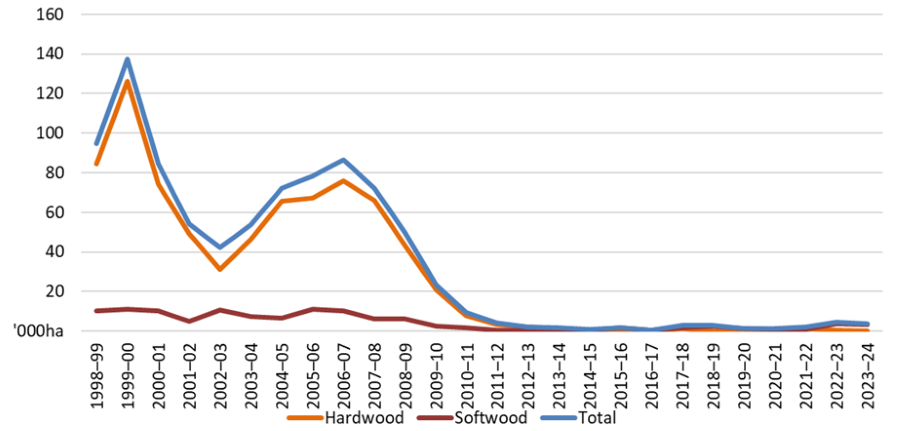
Source: ABARES
Table 2 New South Wales and Western Australia accounted for the majority of softwood plantations established in 2023-24
| 2022–23 | 2023-24 | |||||
|---|---|---|---|---|---|---|
| State/Territory | Softwood (’000 ha) | Hardwood (’000 ha) | Total (’000 ha) | Softwood (’000 ha) | Hardwood (’000 ha) | Total (’000 ha) |
| New South Wales | 2.9 | 0.0 | 2.9 | 1.9 | 0.0 | 1.9 |
| Victoria | 0.5 | 0.2 | 0.8 | 0.0 | 0.0 | 0.0 |
| Queensland | 0.0 | 0.0 | 0.0 | 0.0 | 0.0 | 0.0 |
| South Australia | 0.0 | 0.0 | 0.0 | 0.0 | 0.0 | 0.0 |
| Western Australia | 0.4 | 0.2 | 0.6 | 1.6 | 0.2 | 1.8 |
| Tasmania | 0.0 | 0.3 | 0.3 | 0.0 | 0.0 | 0.0 |
| Northern Territory | 0.0 | 0.0 | 0.0 | 0.0 | 0.0 | 0.0 |
| Aust. Capital Territory | 0.0 | 0.0 | 0.0 | 0.0 | 0.0 | 0.0 |
| Australia | 3.8 | 0.7 | 4.5 | 3.5 | 0.2 | 3.7 |
Source: ABARES
Figure 3: In 2023-24 New South Wales continues to have the largest share of national softwood plantations and Tasmania the largest share of national hardwood plantations.
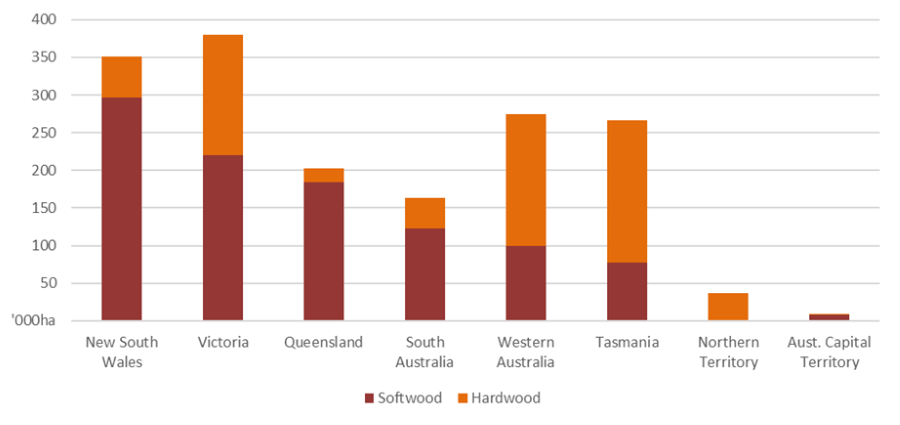
Source: ABARES
Figure 4: Softwood plantations are predominately radiata pine in southern Australia, while southern pines are planted in northern New South Wales and Queensland, hoop pine are planted in Queensland and maritime pine is planted in drier parts of Western Australia.
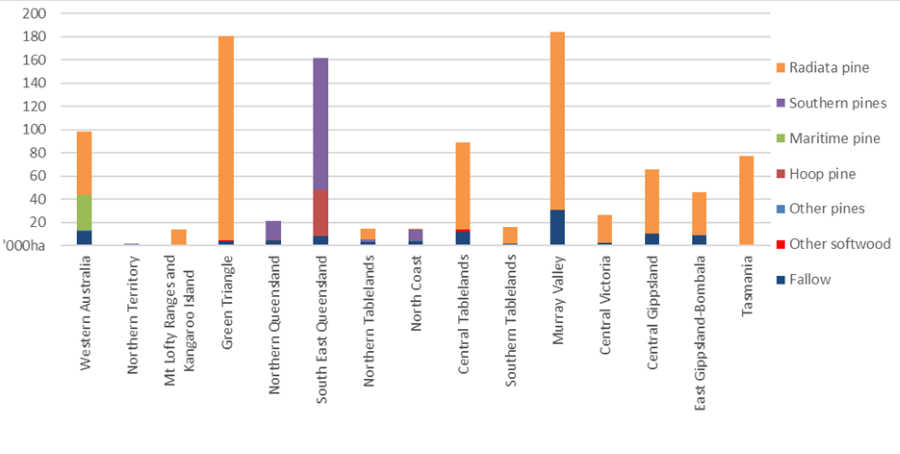
Source: ABARES
Figure 5: The majority of Tasmanian blue gum and shining gum hardwood plantations are managed for pulplog production, North Coast and Tasmania are the regions with most hardwood plantations managed for sawlog production.
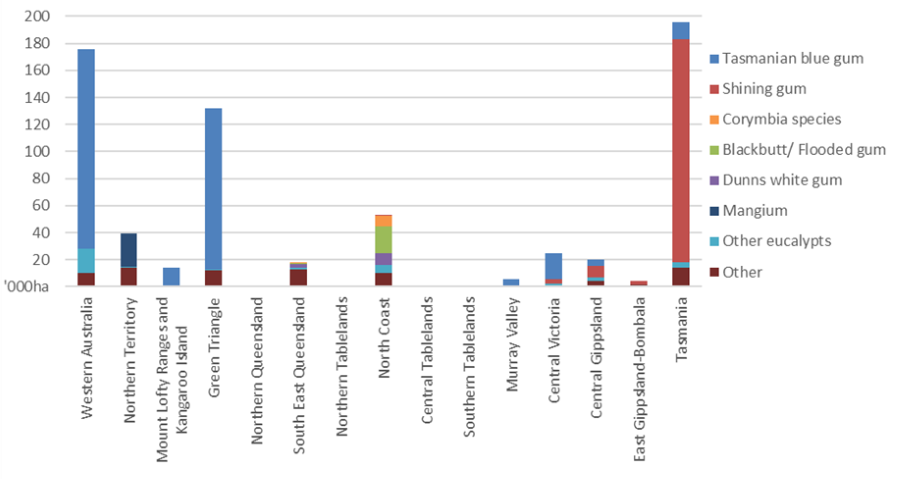
Source: ABARES
Figure 6: Institutional investors continued to own 60% of the plantation estate in 2023-24.
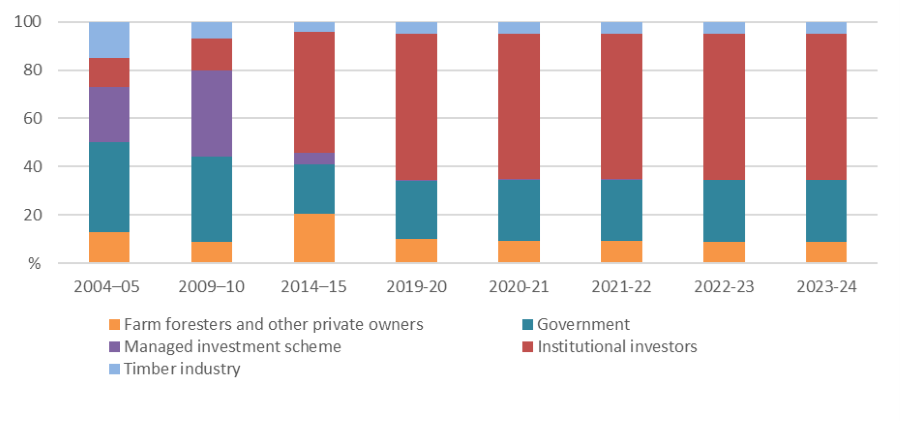
Source: ABARES
Note: An institutional investor is a company that invests money on behalf of other people such as a Superannuation fund.
Figure 7: New South Wales and the Australian Capital Territory remained the only jurisdictions where tree ownership is predominately publicly owned in 2023-24.
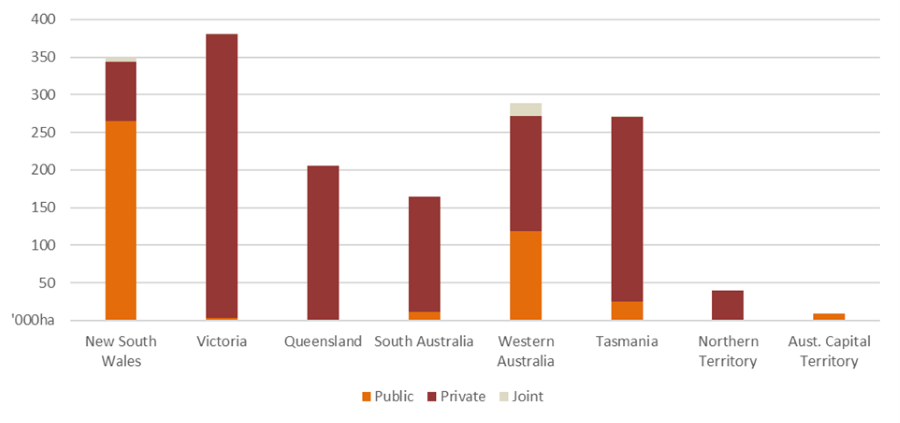
Source: ABARES
Australian plantation statistics update 2023-24 (PDF 536 KB)
Australian plantation statistics update 2023-24 (DOCX 1.25 MB)
Australian Plantation statistics infographic (PDF 597 KB)
Supporting data tables (XLSX 110 KB)
Australia’s plantations Spatial Layer 2020-21 (ZIP 5.9 MB)
If you have difficulty accessing these files, contact ABARES.
Australian plantation statistics update 2022-23 (PDF 594 KB)
Australian plantation statistics update 2022-23 (DOCX 1.25 MB)
Australian Plantation statistics infographic (PDF 601 KB)
Supporting data tables (XLSX 111 KB)
Australian plantation statistics 2023 update (PDF 523 KB)
Australian plantation statistics 2023 update (DOCX 1.20 MB)
Australian Plantation statistics 2023 - Infographic (PDF 692 KB)
Supporting data tables (XLSX 102 KB)
Australian plantation statistics 2022 update (PDF 1.47 MB)
Australian plantation statistics 2022 update (DOCX 2.21 MB)
Australian Plantation statistics 2022 - infographic (PDF 880 KB)
Supporting data tables (XLSX 69 KB)
Australian plantation statistics 2020 update (PDF 1.71 MB)
Australian plantation statistics 2020 update( DOCX 3.28 MB)
Australian plantation statistics 2018 update (PDF 3.51 MB)
Australian plantation statistics 2016 (PDF 23.5 MB)
If you have difficulty accessing these files, contact ABARES.