
2017–18 to 2019–20
Aruni Weragoda and James Frilay
[expand all]
Financial performance
Farm cash income
Dairy farm incomes are projected to have risen in 2019–20 because of higher milk prices, reduced quantities of fodder purchased and lower feed prices, despite persistent drought in some regions and a slight decline in milk production. Average farm cash income of dairy farms is projected to have increased by around 37% to $165,000 per farm in 2019–20, following a sharp decline in 2018–19 (Table 1, Figure 1). Increased availability of hay and improved feed production in some regions (particularly South Australia and Victoria) has led to reduced purchases of fodder and slightly reduced feed prices in 2019–20.
| Performance measure | Unit | 2017–18 | 2018–19p | RSE | 2019–20y |
|---|---|---|---|---|---|
| Total cash receipts | $ | 835,890 | 905,800 | (2) | 930,000 |
| less total cash costs | $ | 673,510 | 785,700 | (3) | 765,000 |
| Farm cash income | $ | 162,380 | 120,100 | (11) | 165,000 |
| plus change in trading stocks | $ | 54,860 | –9,800 | (75) | –40 |
| less depreciation | $ | 51,600 | 49,800 | (4) | 50,000 |
| less operator and family labour | $ | 77,350 | 81,800 | (4) | 87,000 |
| Farm business profit | $ | 88,290 | –21,300 | (70) | 28,000 |
| plus interest and lease payments | $ | 69,500 | 71,600 | (6) | 67,000 |
| Profit at full equity | $ | 157,790 | 50,300 | (30) | 95,000 |
| Rate of return a | % | 3.1 | 1.0 | (30) | 1.7 |
p Preliminary estimate. y Provisional estimate. a Excluding capital appreciation. RSE Relative standard error.
Note: Estimates may not sum due to rounding. Definitions and description of data source are provided in Box 1.
Source: ABARES Australian Dairy Industry Survey
At the national level the effect of the current drought on farm cash income has not been as severe as previous droughts, even though it has been particularly severe in some regions. Farm cash income in 2019–20 is projected to have been 23% above the 10 year average to 2018–19 in real terms. Changes in farm size influence trends in average farm cash income. When adjusted for changes in area operated, average farm cash income per hectare is projected to have been 13% above the average to 2018–19.
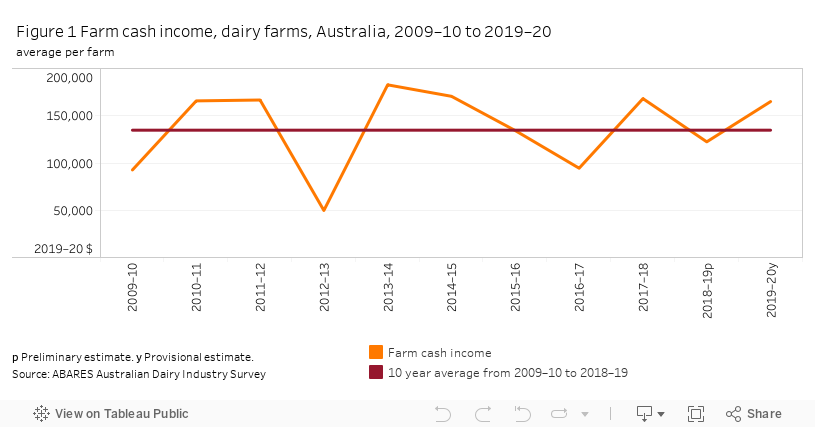
Note: farm cash income varies over time because of short-term changes in factors such as commodity prices, seasonal conditions and management decisions, as well as longer-term changes in the farm sector, such as growth in average farm size, shifts in enterprise mix and technological progress. Appropriate consideration of the long-term factors is essential when interpreting changes in farm cash income over periods longer than 3 to 5 years.
This tableau figure may not meet accessibility requirements. For information about the content of this figure contact ABARES
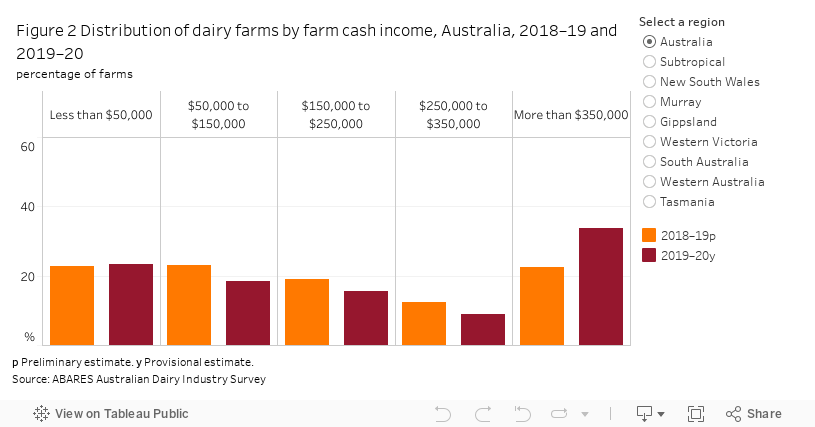
At the national level, nearly one-quarter of dairy farms are expected to have cash incomes below $50,000 in 2019–20 (Figure 2). The Subtropical, New South Wales and Murray regions account for the majority of these farms.
The proportion of farms with incomes above $350,000 is projected to have increased from 23% in 2018–19 to an estimated 34% in 2019–20. The majority of these farms are in New South Wales, Western Victoria and South Australia. The proportion of farms with high incomes is projected to have increased in all regions except Western Australia in 2019–20.
This tableau figure may not meet accessibility requirements. For information about the content of this figure contact ABARES
Box 1 About this report
The dairy industry makes an important contribution to the Australian economy. In 2018–19 it accounted for around 7% ($4.4 billion) of the gross value of agricultural production (ABS 2020) and around 6% ($3.5 billion) of agricultural export income.
The results below are for farms included in the Australian Dairy Industry Survey (ADIS). The ADIS is funded by the Department of Agriculture, Water and the Environment. Data are provided at national and regional scales, with regions based on those used by Dairy Australia.
Map 1 Australian dairy regions
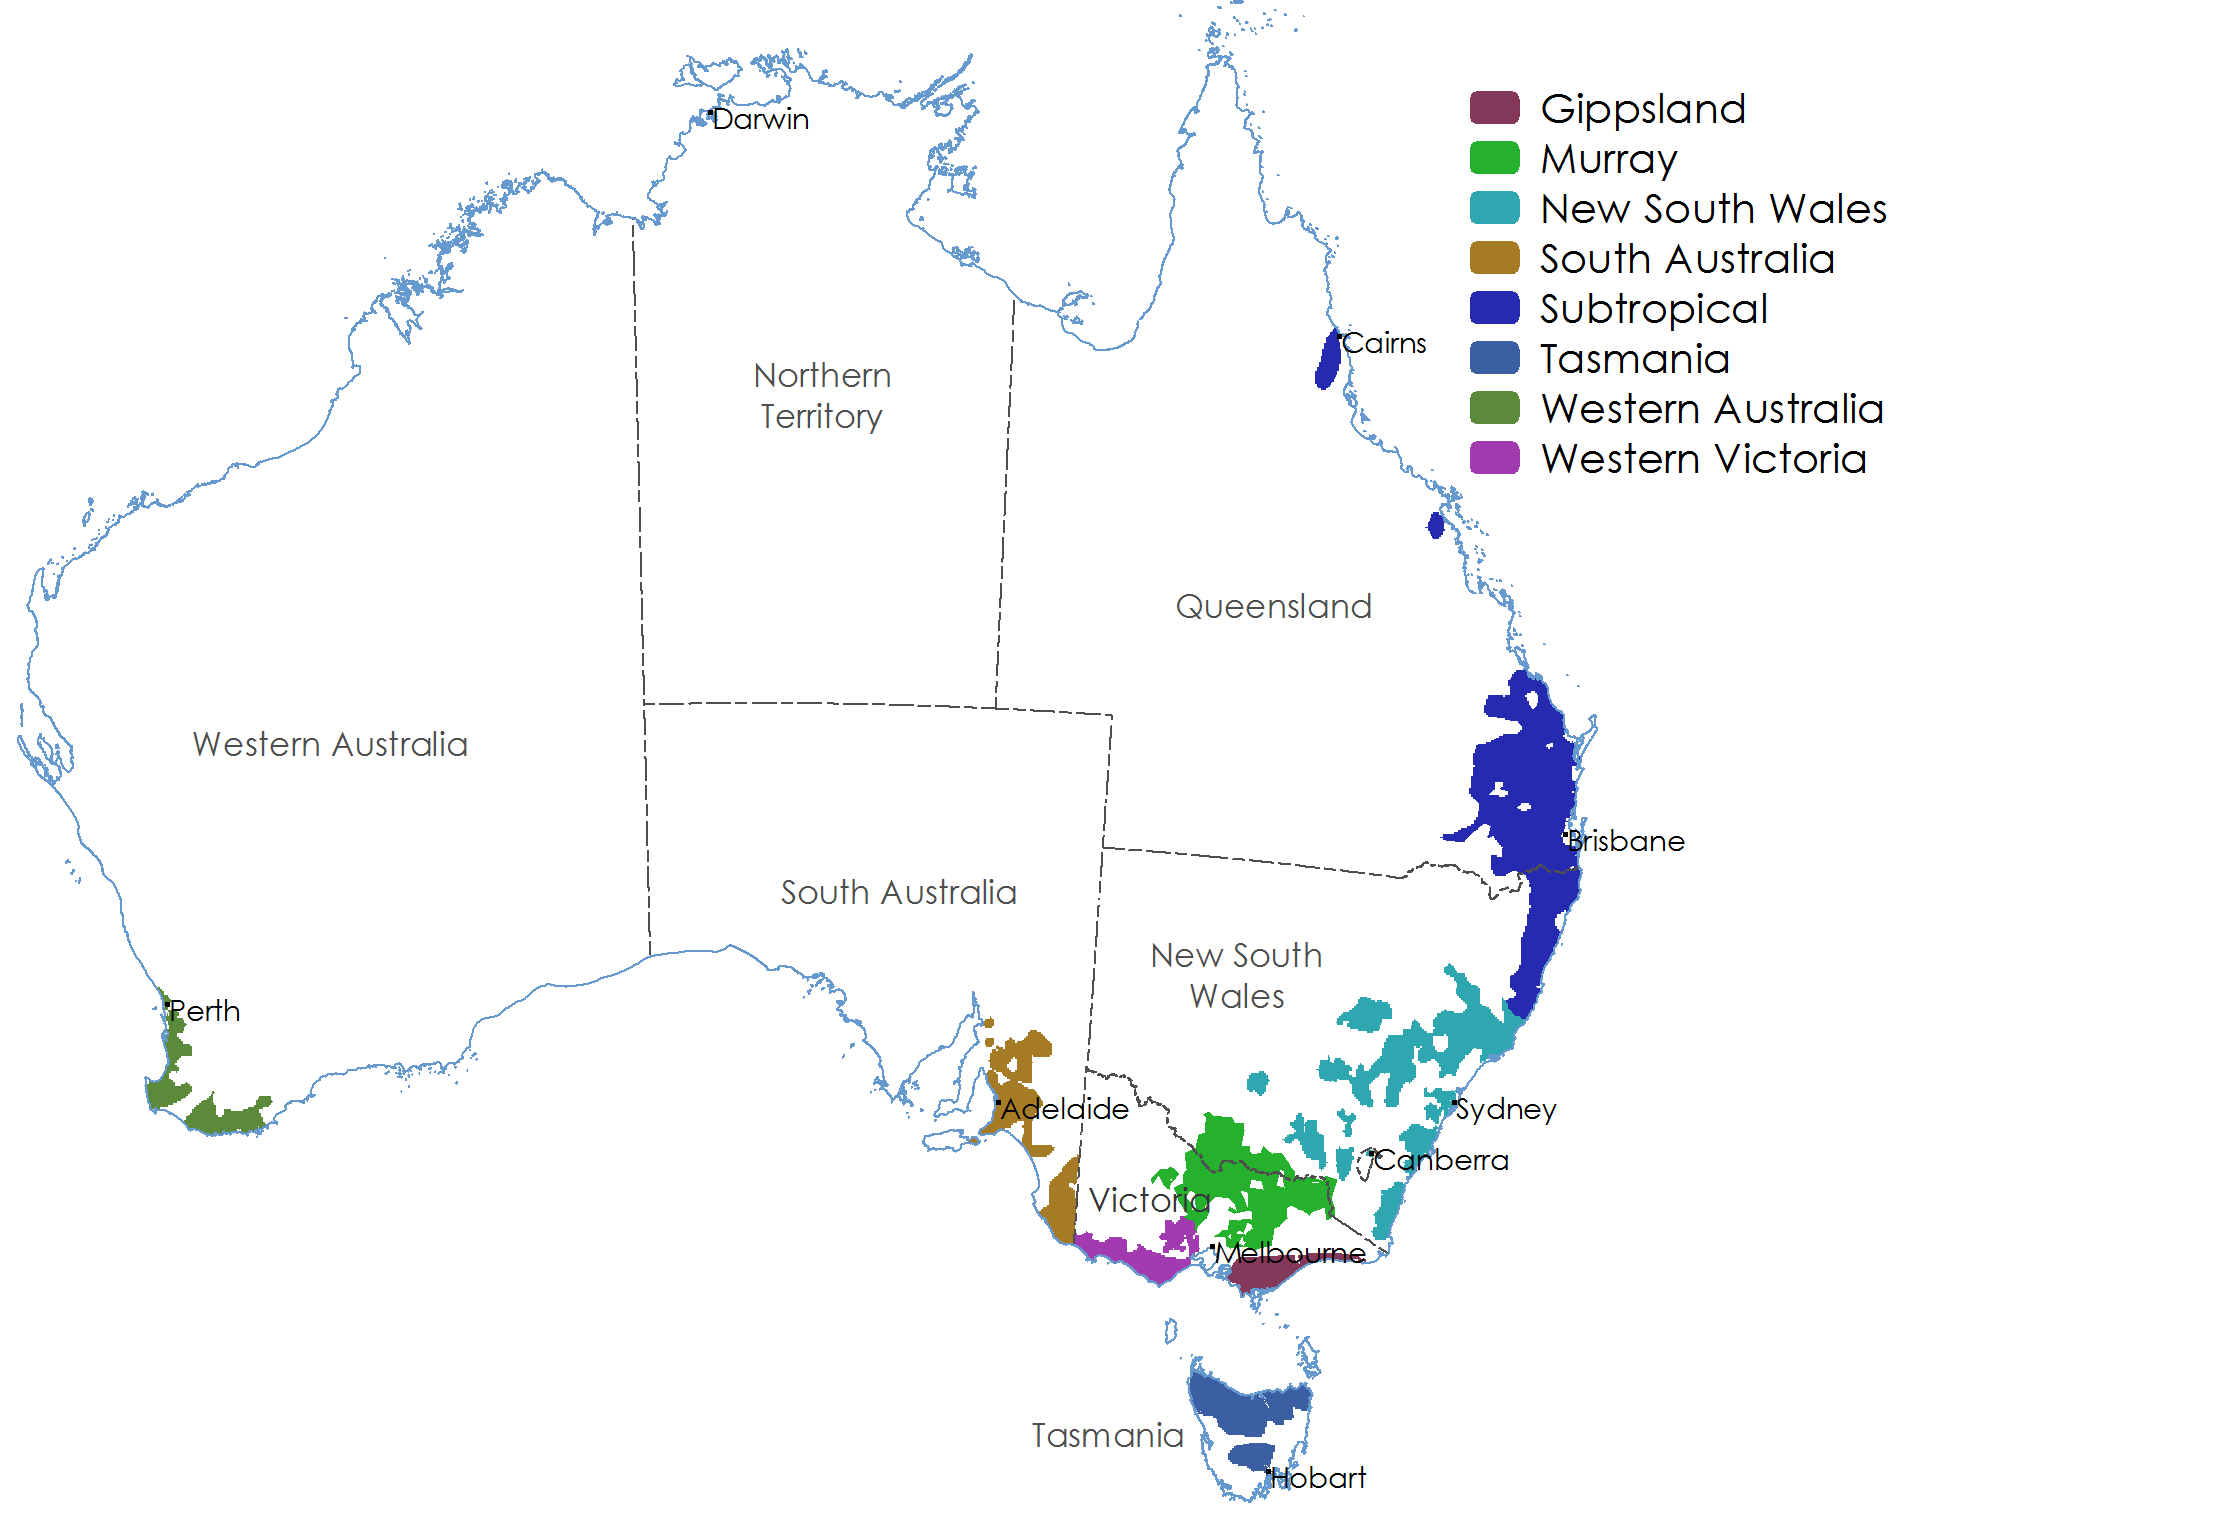
Source: ABARES
Definitions of major financial performance indicators:
Total cash receipts: total revenues received by the business during the financial year
Total cash costs: payments made by the business for materials and services and for permanent and casual hired labour (excluding owner–manager, partner and family labour)
Farm cash income: total cash receipts – total cash costs
Farm business profit: farm cash income + change in trading stocks – depreciation – imputed labour costs
Profit at full equity: return produced by all the resources used in the business: farm business profit + rent + interest + finance lease payments – depreciation on leased items
Rate of return excluding capital appreciation: efficiency of businesses in generating returns from all resources used (profit at full equity/total opening capital) x 100
Farm household income
Farm cash income is a comprehensive measure of the income generated by the business for use by the farm household for consumption and investment. However, activities other than farming are also an important source of income for many farm households. This diversification is an important risk management strategy for many Australian farmers. On average over the 3 years to 2018–19, around 64% of dairy farms earned off-farm income, at an average value of $27,600 per farm, equivalent to 18% of total household income (for farms with off-farm income) (Table 2).
The importance of off-farm income varies with farm size (Figure 3). For small dairy farms milking less than 200 cows, off-farm income accounted for 28% of overall household income. Around 70% of dairy farms milking 200 to 350 cows received off-farm income, the highest proportion across the size groups. Off-farm income is less significant for large dairy farms milking more than 350 cows: 64% of large dairy farms earned some off-farm, with an average value of $26,700 (around 9% of household income).
| Measure | Unit | Less than 200 cows milked | 200 to 350 cows milked | More than 350 cows milked | All dairy farms |
|---|---|---|---|---|---|
| Proportion of farms with off-farm income a | % | 57 | 70 | 64 | 64 |
| Average off-farm income b | $ | 25,800 | 30,000 | 26,700 | 27,600 |
| Off-farm income as a proportion of farm household income b | % | 28 | 23 | 9 | 18 |
| Average off-farm income a | $ | 13,300 | 20,600 | 17,300 | 17,000 |
a All responding farms. b Farms with off-farm income greater than zero.
Note: Financial data in 2019–20 dollars.
Source: ABARES Australian Dairy Industry Survey

This tableau figure may not meet accessibility requirements. For information about the content of this figure contact ABARES
Farm business profit
Farm business profit is a comprehensive measure of the long-term economic performance of farm businesses. In addition to the receipts and costs included in farm cash income, farm business profit also accounts for non-cash costs incurred by farm businesses, namely capital depreciation, payments for family labour and changes in inventories of livestock, fodder and grain held on farms.
At the national level, farm business profit declined significantly from an average of $88,290 per farm in 2017–18 to negative $21,300 per farm in 2018–19 (Figure 4). The decline in farm business profit was much larger than the fall in farm cash income because of a rundown in trading stocks (dairy cattle). In 2019–20, farm business profit is projected to have increased to $28,000 per farm, reflecting the increase in farm cash income and a small buildup in trading stocks. In 2019–20 farm business profit was around 8% below the 10 year average.
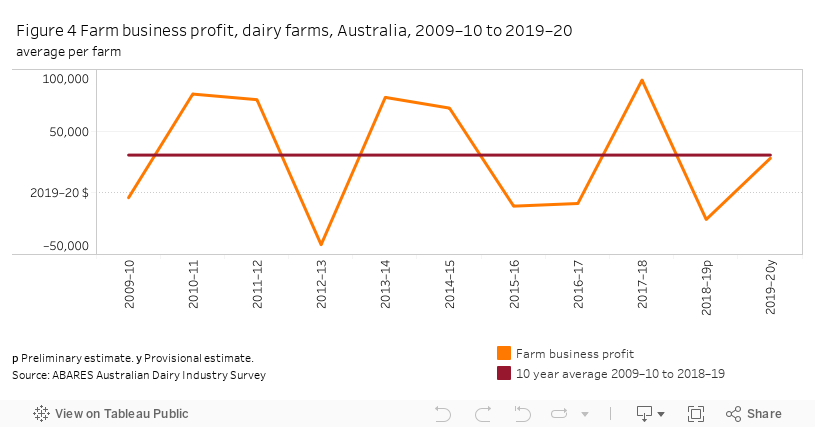
Note: Farm business profit varies over time because of short-term changes in factors such as commodity prices, seasonal conditions and management decisions, as well as longer-term changes in the farm sector, such as growth in average farm size, shifts in enterprise mix and technological progress. Appropriate consideration of the long-term factors is essential when interpreting changes in farm business profit over periods longer than 3 to 5 years.
This tableau figure may not meet accessibility requirements. For information about the content of this figure contact ABARES
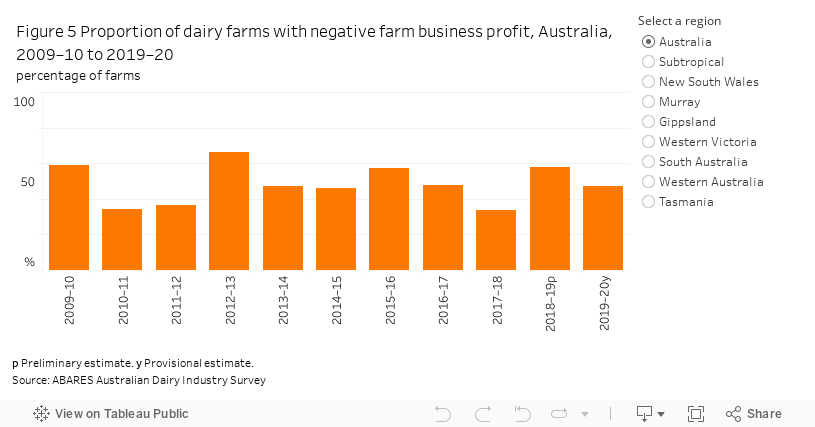
Over the 10 years to 2018–19, the proportion of dairy farms recording negative farm business profit averaged 49% a year. In 2019–20, the proportion of farms with negative farm business profit is projected to have been around 47% (Figure 5).
This tableau figure may not meet accessibility requirements. For information about the content of this figure contact ABARES
Negative farm business profit in a particular year typically means a farm has not covered the costs of family labour or set aside sufficient funds to replace depreciating farm assets (and has also possibly not covered all cash costs). Many farms occasionally record negative farm business profit when their income fluctuates. However, ongoing low or negative profit affects long-term viability because farms have reduced capacity to invest in newer and more efficient technologies.
In some cases, negative farm business profit reflects short-term factors such as fluctuations in seasonal conditions and prices, and one-off events such as injury or illness. On average, 13% of dairy farms recording negative farm business profit in any given year from 2009–10 to 2018–19 recorded a positive profit in the following year. In other cases, farm business profit is consistently low or negative over time, reflecting the fact that many farm households are supported by off-farm income and derive other benefits from owning farms such as amenity and long-term growth in asset values.
Rate of return
The most complete measure of farm business performance is the rate of return. This variable is calculated by dividing profit generated in a particular year by the value of assets used in that year. By capturing the value of the assets used by the business, rate of return effectively measures the efficiency with which the funds invested in a farm (for example in land, machinery and livestock) have been used to generate profit. With appropriate consideration of risk, farm rates of return can be compared to those generated by other potential uses of capital, such as debt and equity investments.
ABARES calculates rate of return to capital by expressing profit at full equity – that is, farm business profit plus rent, interest and finance lease payments – as a percentage of total opening capital. Rate of return represents the ability of businesses to generate a return to all capital used by the business, including that which is borrowed or leased. Finance costs are added back in to farm business profit so that rates of return can be compared across farms regardless of their debt arrangements.
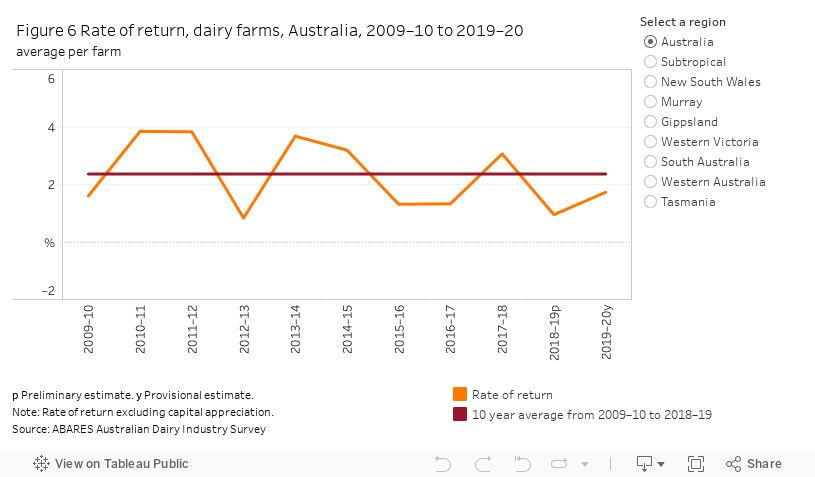
The average rate of return (excluding capital appreciation) of Australian dairy farms decreased from 3.1% in 2017–18 to 1.0% in 2018–19 (Figure 6). The average rate of return is projected to have increased slightly in 2019–20 to an estimated 1.7%. In comparison, the average rate of return for broadacre farms in 2019–20 is estimated to have been 0.3%.
This tableau figure may not meet accessibility requirements. For information about the content of this figure contact ABARES
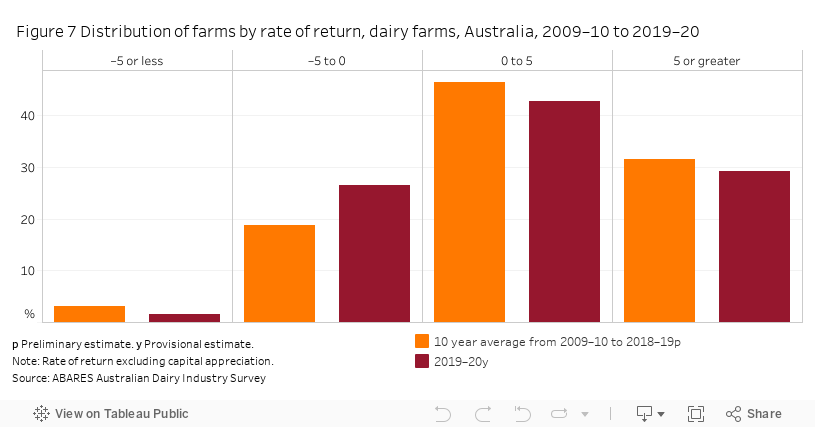
Similar to other measures of performance, rates of return vary widely across dairy farms (Figure 7). From 2009–10 to 2018–19, 78% of dairy farms recorded a positive rate of return (excluding capital appreciation) and an estimated 32% of farms earned rates of return greater than 5% (Figure 7). In 2019–20 around 72% of farms are projected to have recorded a positive rate of return (excluding capital appreciation) and an estimated 29% of farms are projected to earn rates of return greater than 5%.
Ongoing increases in farm land prices in Australia over recent decades mean that farm rates of return are typically higher when changes in the value of capital items are included as a source of returns. However, these ‘real estate’ returns are ideally kept separate when seeking to understand the performance of farm enterprises such as livestock and crop production. When changes in the value of capital items are included, the average rate of return for dairy farms over the 10 years to 2018–19 increases from 2.4% to 2.9% and 75% of farms earned a positive rate of return.
Variation in returns across farms reflects differences in seasonal conditions, prices and other factors between farms in any particular year. This variation is quite distinct from measures of farm business ‘risk’ – which is defined as the variation in returns or profits over time for individual farm businesses. This latter type of variation reflects changes over time in seasonal conditions, commodity prices and the cost of farm inputs, as well as farm-specific factors such as enterprise mix and the skills and experience of the farm manager. The focus of this report is presenting industry-level estimates, rather than farm-level.
This tableau figure may not meet accessibility requirements. For information about the content of this figure contact ABARES
Performance by region
The financial performance of dairy farms in 2019–20 varied substantially between regions, reflecting differences in seasonal conditions, markets and underlying industry structure.
A majority of dairy farmers in the Subtropical, New South Wales and Western Australia regions reported below average or drought seasonal conditions in 2018–19 and 2019–20 (Figure 8). Dairy farms in the other regions reported a mix of above average and below average seasonal conditions.

This tableau figure may not meet accessibility requirements. For information about the content of this figure contact ABARES
In most years, farmgate milk prices are higher than cash costs on most farms, generating a positive operating margin (Figure 9, Figure 10). Most of the variation in margins is due to variation in farm cash costs, particularly expenditure on feed grains and fodder (Figure 11). The wide variation in cash costs within and between regions reflect differences in a range of factors, including different milk production systems used by dairy farmers, managerial skills, use of hired labour, and exposure to fodder and water markets, among other factors.
Margins per kilogram of milk solids
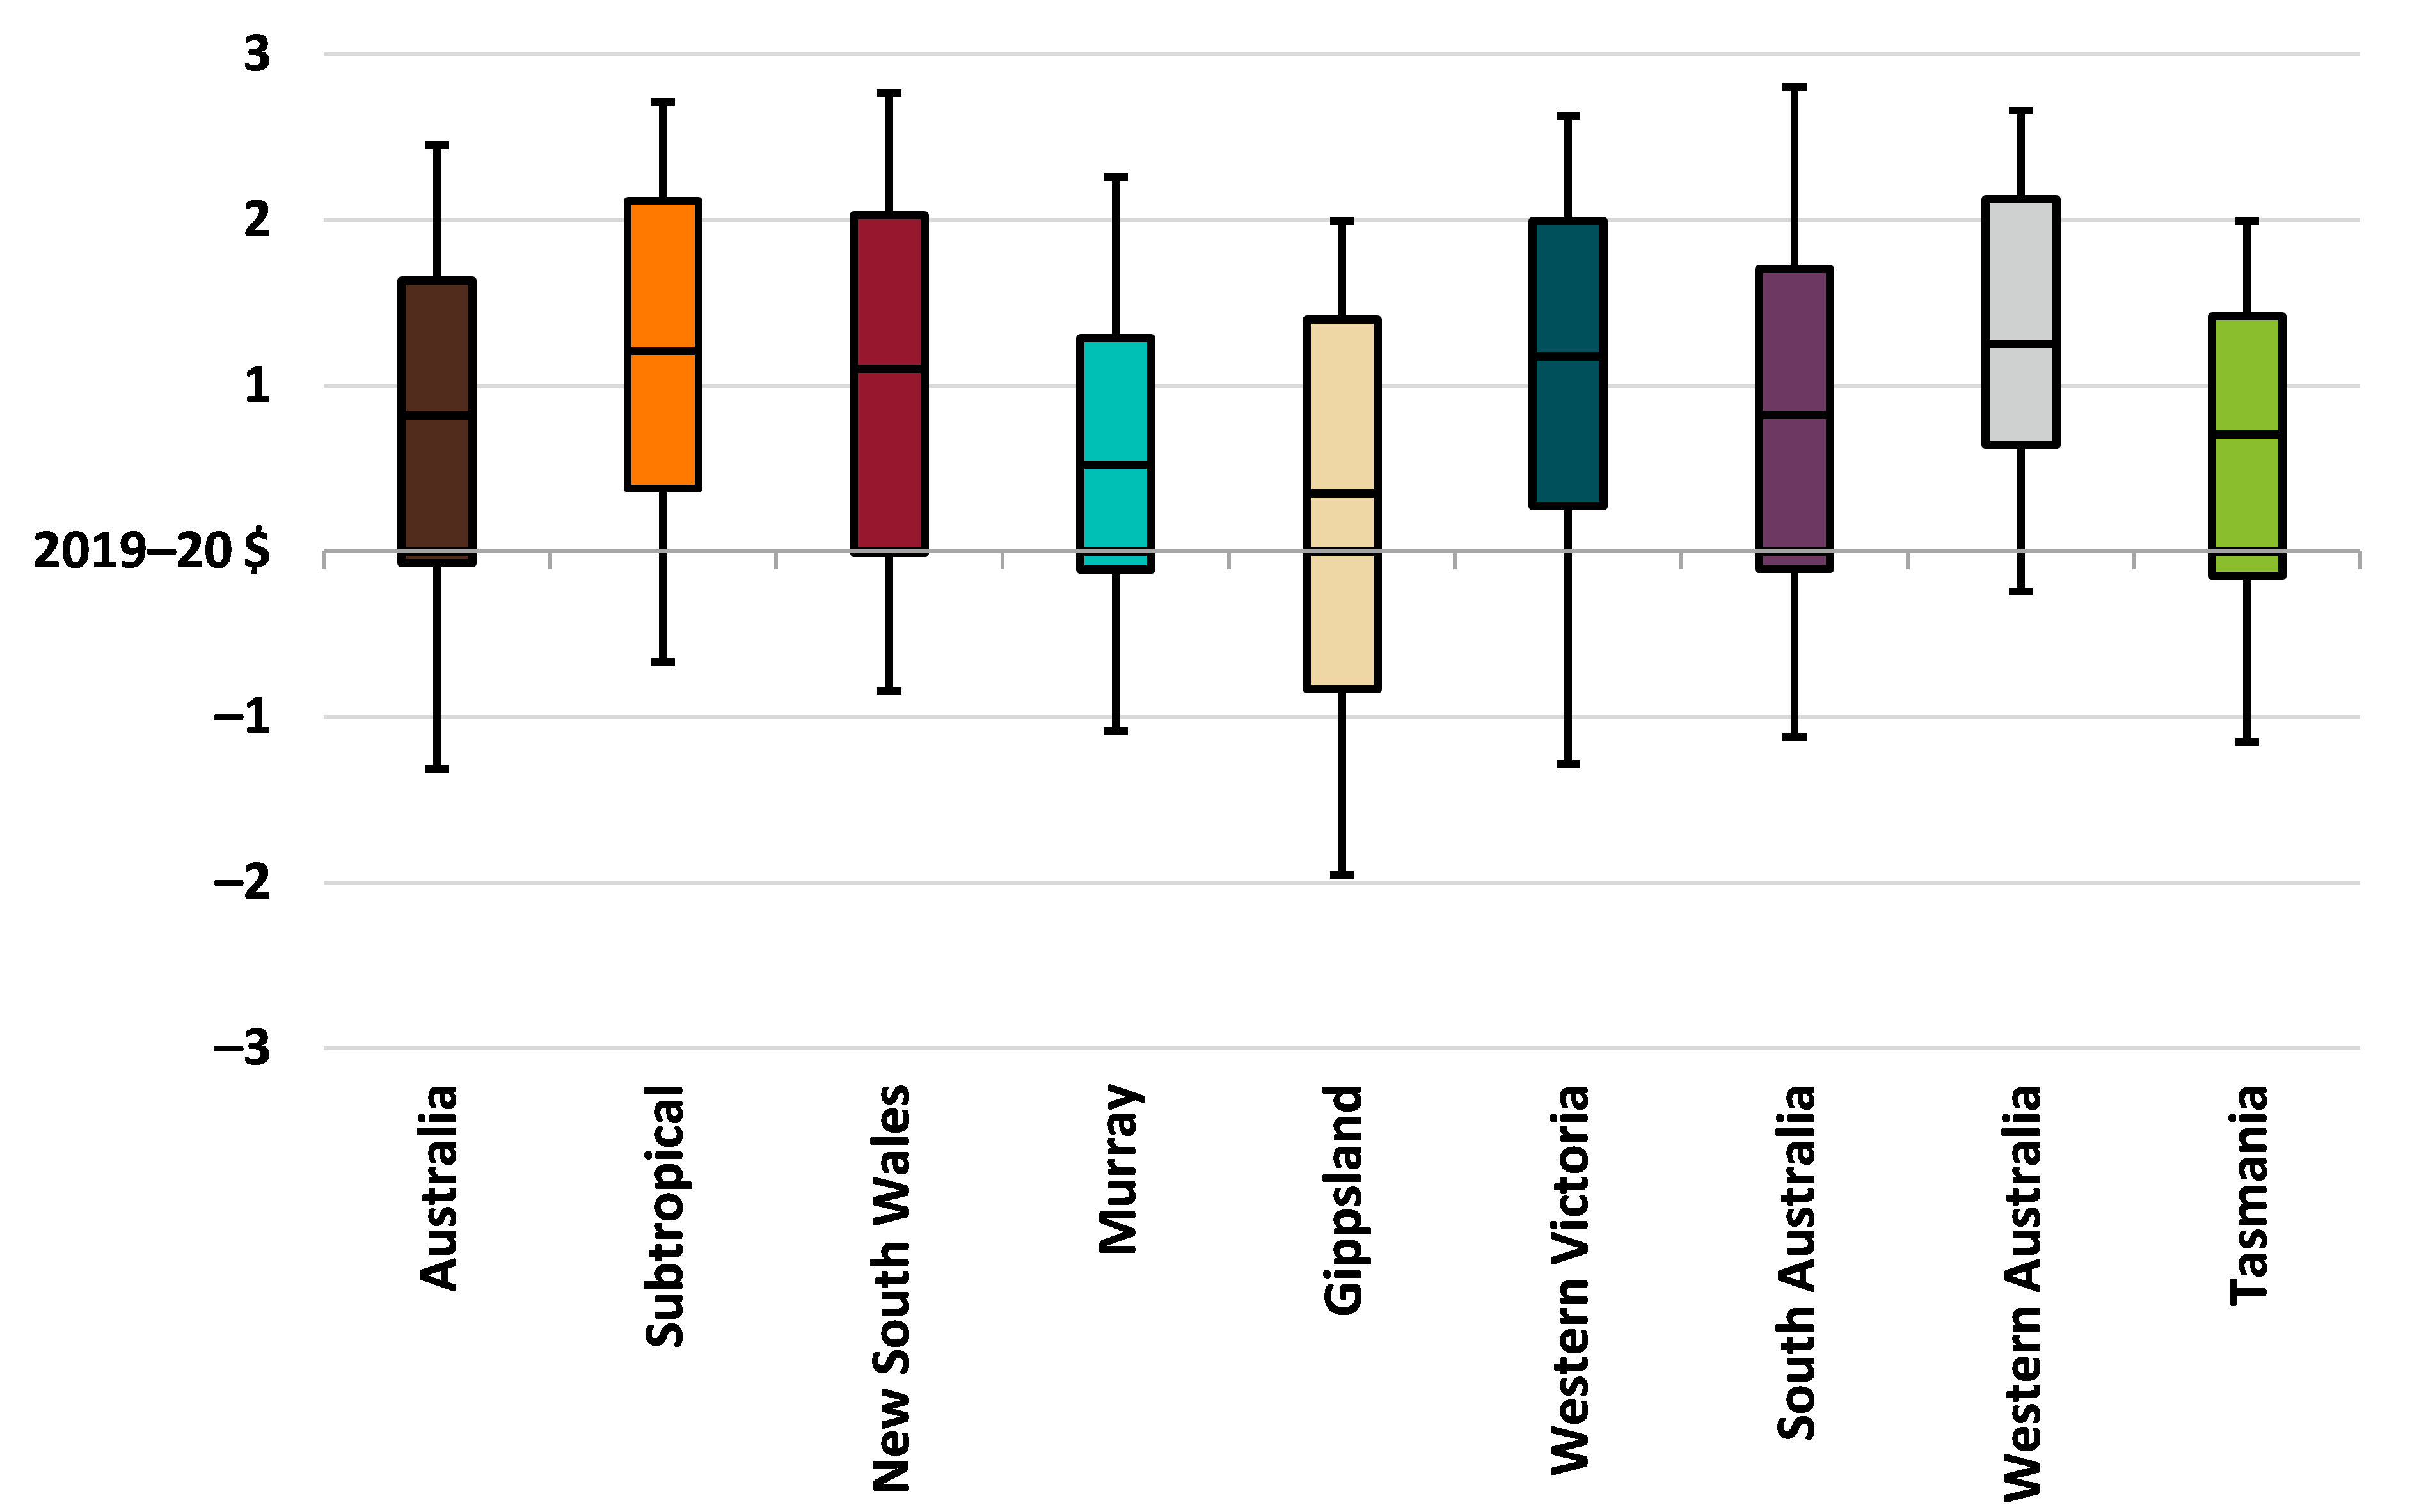
Note: Margins are based on unit milk prices minus cash costs per kilogram of milk solids. Distributions show the spread of individual observations from 2015–16 to 2019–20. Boxes represent the middle 50% of farms. The horizontal line within each box is the median. Vertical lines represent the spread from the 10th percentile to the 90th percentile.
Source: ABARES Australian Dairy Industry Survey
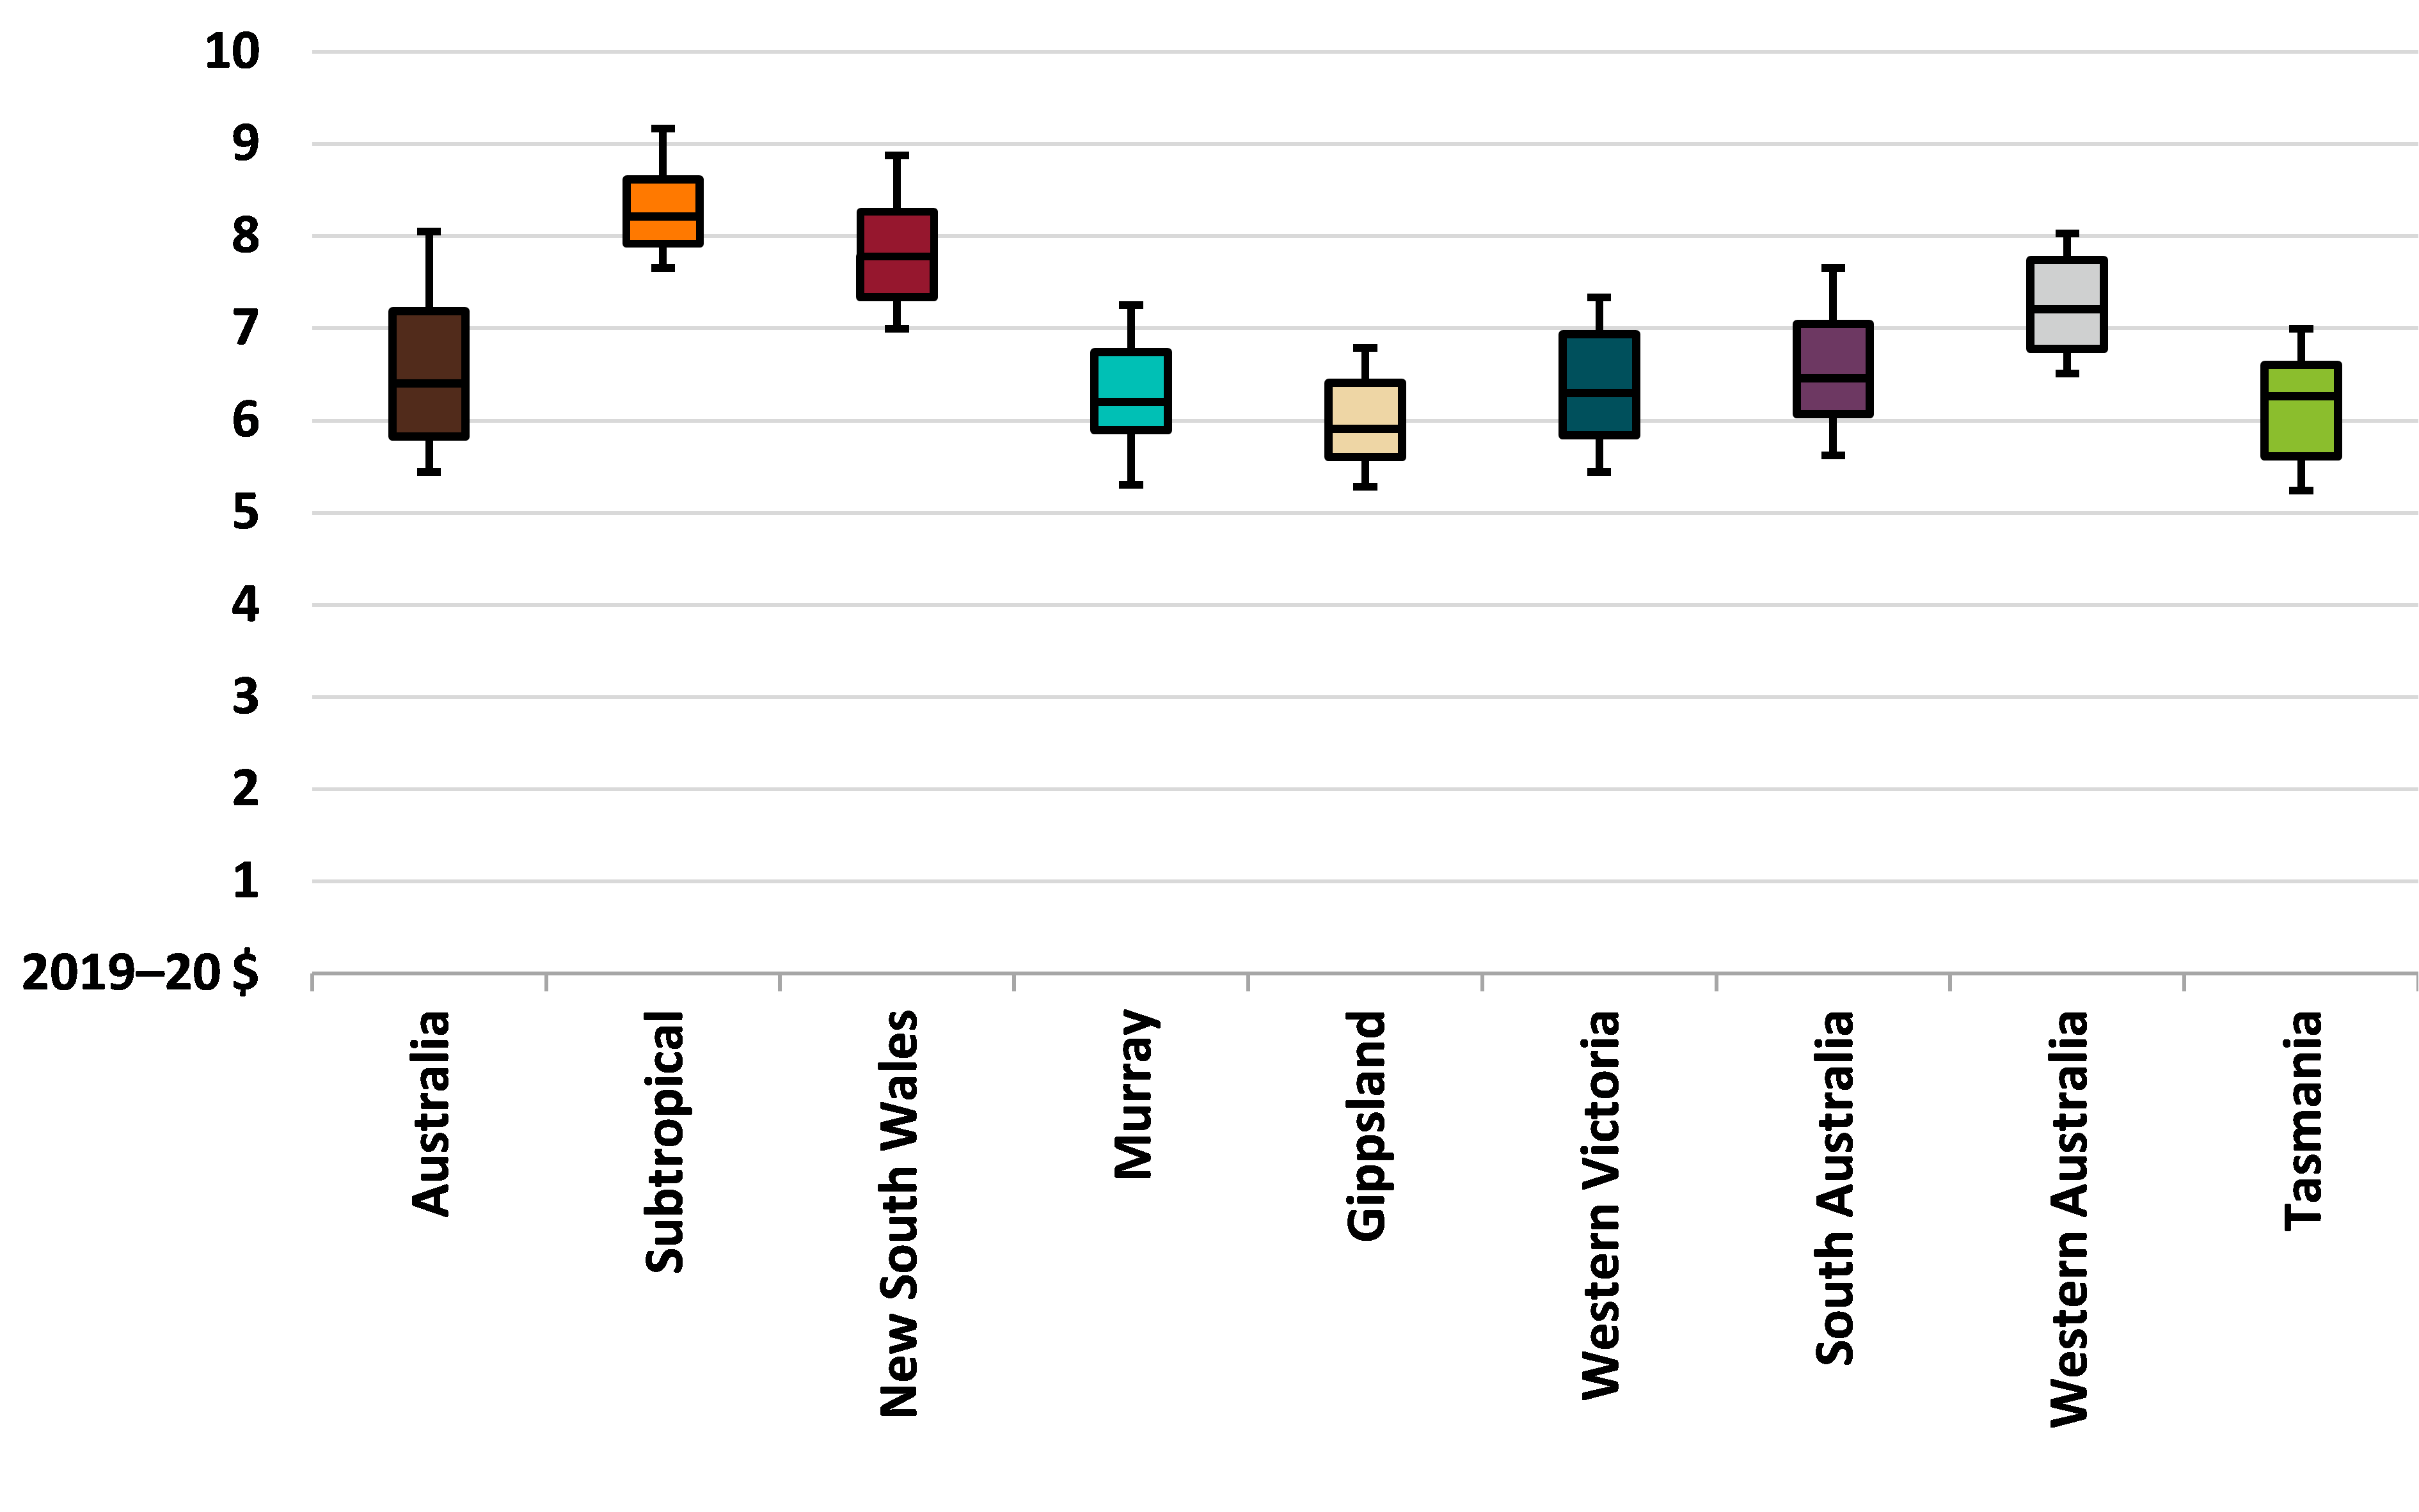
Note: Unit milk prices received per kilogram of milk solids. Distributions show the spread of individual observations from 2015–16 to 2019–20. Boxes represent the middle 50% of farms. The horizontal line within each box is the median. Vertical lines represent the spread from the 10th percentile to the 90th percentile.
Source: ABARES Australian Dairy Industry Survey
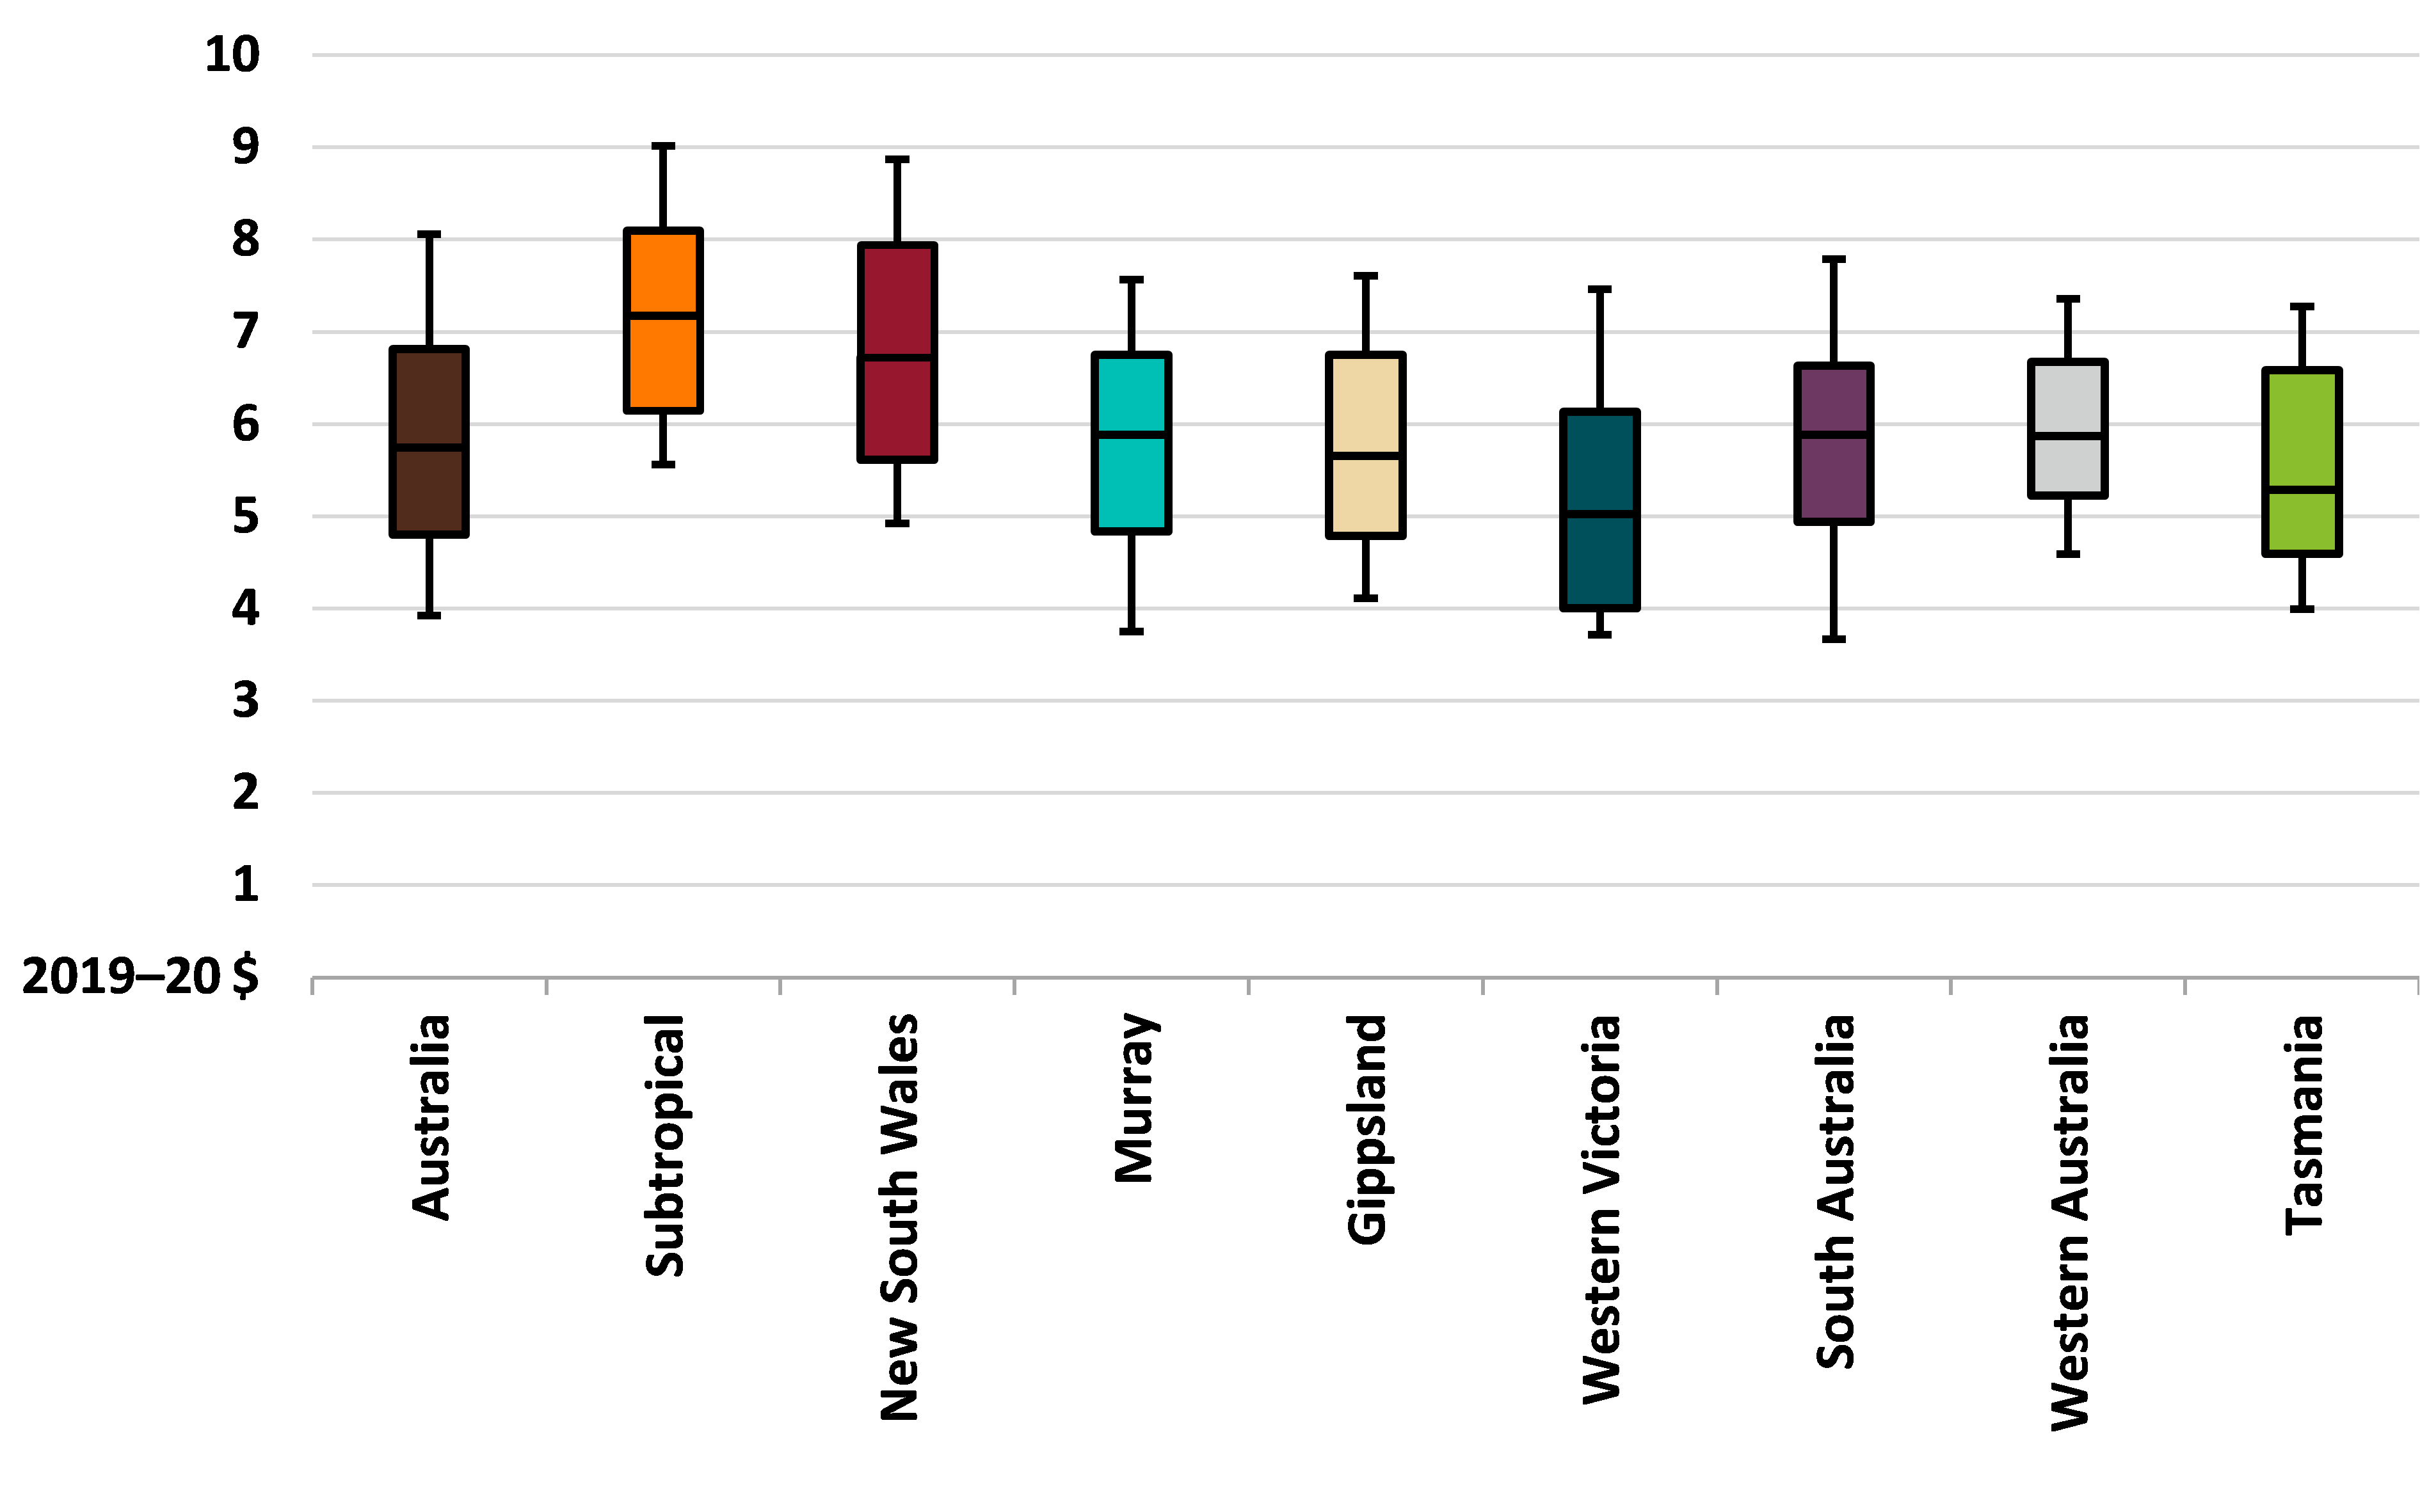
Note: Cash costs per kilogram of milk solids. Distributions show the spread of individual observations from 2015–16 to 2019–20. Boxes represent the middle 50% of farms. The horizontal line within each box is the median. Vertical lines represent thespread from the 10th percentile to the 90th percentile.
Source: ABARES Australian Dairy Industry Survey
Subtropical
Dairy farms in the Subtropical region have faced dry seasonal conditions since 2017–18. After reaching a peak in 2016–17, farm incomes in the Subtropical region declined in 2018–19 (Table 3). Reduced milk production because of lower average milk yield per cow, combined with historically high fodder costs, were the main reasons for lower incomes. Average farm cash income is projected to have increased by 10% in 2019–20 due to a decline in total cash costs.
| Performance measure | Unit | 2017–18 | 2018–19p | RSE | 2019–20y |
|---|---|---|---|---|---|
| Total cash receipts | $ | 680,020 | 675,700 | (4) | 651,000 |
| less total cash costs | $ | 534,290 | 593,700 | (5) | 561,000 |
| Farm cash income | $ | 145,740 | 82,100 | (22) | 90,000 |
| plus change in trading stocks | $ | 4,370 | 4,500 | (138) | –1,000 |
| less depreciation | $ | 40,660 | 40,100 | (8) | 38,000 |
| less operator and family labour | $ | 92,980 | 96,800 | (4) | 103,000 |
| Farm business profit | $ | 16,460 | –50,300 | (45) | –52,000 |
| plus interest and lease payments | $ | 43,860 | 45,800 | (16) | 39,000 |
| Profit at full equity | $ | 60,320 | –4,500 | (171) | –14,000 |
| Rate of return a | % | 1.4 | –0.1 | (170) | –0.3 |
p Preliminary estimate. y Provisional estimate. a Excluding capital appreciation. RSE Relative standard error.
Note: Estimates may not sum due to rounding.
Source: ABARES Australian Dairy Industry Survey
New South Wales
Almost all dairy farms in New South Wales reported below average or drought seasonal conditions in both 2018–19 and 2019–20. Farm cash income for New South Wales dairy farms is projected to have increased by 34% in 2019–20 following a decline of similar magnitude in 2018–19 (Table 4). The projected increase in farm cash income is a result of lower cash costs, particularly expenditure on fodder. Cash receipts are projected to have declined slightly in 2019–20, as higher farmgate milk prices are more than offset by a reduction in average milk production per farm.
| Performance measure | Unit | 2017–18 | 2018–19p | RSE | 2019–20y |
|---|---|---|---|---|---|
| Total cash receipts | $ | 1,135,000 | 1,259,900 | (4) | 1,248,000 |
| less total cash costs | $ | 934,770 | 1,108,300 | (5) | 1,045,000 |
| Farm cash income | $ | 200,230 | 151,600 | (24) | 202,000 |
| plus change in trading stocks | $ | 53,000 | 18,100 | (96) | –4,000 |
| less depreciation | $ | 64,180 | 69,600 | (10) | 66,000 |
| less operator and family labour | $ | 101,190 | 102,700 | (7) | 106,000 |
| Farm business profit | $ | 87,870 | –2,600 | (156) | 26,000 |
| plus interest and lease payments | $ | 80,040 | 82,400 | (15) | 71,000 |
| Profit at full equity | $ | 167,910 | 79,700 | (50) | 97,000 |
| Rate of return a | % | 2.6 | 1.1 | (50) | 1.4 |
p Preliminary estimate. y Provisional estimate. a Excluding capital appreciation. RSE Relative standard error.
Note: Estimates may not sum due to rounding.
Source: ABARES Australian Dairy Industry Survey
Murray
In the Murray region, reduced milk production and higher costs for fodder and irrigation water contributed to lower farm cash incomes in 2018–19. Average farm cash income in the Murray region is projected to have increased in 2019–20 (Table 5) as a consequence of higher milk prices and a slight decline in expenditure on fodder and irrigation water. However, around one-half of dairy farms in the Murray region had lower farm cash income in 2019–20, with increased cash costs and a small decline in milk receipts.
| Performance measure | Unit | 2017–18 | 2018–19p | RSE | 2019–20y |
|---|---|---|---|---|---|
| Total cash receipts | $ | 712,550 | 813,400 | (7) | 821,000 |
| less total cash costs | $ | 579,100 | 766,100 | (6) | 711,000 |
| Farm cash income | $ | 133,460 | 47,300 | (50) | 110,000 |
| plus change in trading stocks | $ | 49,670 | –12,000 | (190) | –3,000 |
| less depreciation | $ | 54,660 | 47,300 | (11) | 48,000 |
| less operator and family labour | $ | 76,910 | 83,200 | (12) | 89,000 |
| Farm business profit | $ | 51,560 | –95,200 | (33) | –30,000 |
| plus interest and lease payments | $ | 48,490 | 45,400 | (17) | 39,000 |
| Profit at full equity | $ | 100,050 | –49,800 | (64) | 9,000 |
| Rate of return a | % | 2.5 | –1.1 | (68) | 0.2 |
p Preliminary estimate. y Provisional estimate. a Excluding capital appreciation. RSE Relative standard error.
Note: Estimates may not sum due to rounding.
Source: ABARES Australian Dairy Industry Survey
Gippsland
Average farm cash income for Gippsland dairy farms increased by 6% to $81,200 per farm in 2018–19 (Table 6) mainly as a result of increased milk prices and greater receipts from sales of dairy cattle. Average farm cash income in the Gippsland region is projected to have increased by 47% in 2019–20 because of higher milk prices.
| Performance measure | Unit | 2017–18 | 2018–19p | RSE | 2019–20y |
|---|---|---|---|---|---|
| Total cash receipts | $ | 710,110 | 734,700 | (6) | 793,000 |
| less total cash costs | $ | 633,510 | 653,400 | (8) | 674,000 |
| Farm cash income | $ | 76,600 | 81,200 | (31) | 119,000 |
| plus change in trading stocks | $ | 67,140 | –33,900 | (37) | –2,000 |
| less depreciation | $ | 48,550 | 46,500 | (9) | 49,000 |
| less operator and family labour | $ | 60,950 | 72,000 | (6) | 77,000 |
| Farm business profit | $ | 34,240 | –71,100 | (37) | -8,000 |
| plus interest and lease payments | $ | 82,680 | 82,800 | (13) | 78,000 |
| Profit at full equity | $ | 116,920 | 11,700 | (137) | 69,000 |
| Rate of return a | % | 2.0 | 0.2 | (136) | 1.4 |
p Preliminary estimate. y Provisional estimate. a Excluding capital appreciation. RSE Relative standard error.
Note: Estimates may not sum due to rounding.
Source: ABARES Australian Dairy Industry Survey
Western Victoria
Average farm cash income for Western Victoria dairy farms declined by 10% to $204,400 per farm in 2018–19, as an increase in costs outweighed higher milk receipts. Average farm cash income is projected to have increased by around 21% in 2019–20 (Table 7). Higher milk prices, which led to increased milk receipts, more than offset lower milk production from reductions in herd sizes arising from dry seasonal conditions the previous year. Almost all dairy farms in this region reported average or above average seasonal conditions in 2019–20. Total cash costs are projected to have declined slightly as a result of reduced expenditure on purchased feed.
| Performance measure | Unit | 2017–18 | 2018–19p | RSE | 2019–20y |
|---|---|---|---|---|---|
| Total cash receipts | $ | 842,850 | 918,800 | (5) | 942,000 |
| less total cash costs | $ | 616,290 | 714,300 | (7) | 694,000 |
| Farm cash income | $ | 226,550 | 204,400 | (21) | 248,000 |
| plus change in trading stocks | $ | 67,920 | –4,200 | (198) | –3,000 |
| less depreciation | $ | 47,630 | 48,300 | (11) | 48,000 |
| less operator and family labour | $ | 79,130 | 78,100 | (10) | 85,000 |
| Farm business profit | $ | 167,710 | 73,900 | (60) | 113,000 |
| plus interest and lease payments | $ | 73,000 | 74,700 | (11) | 73,000 |
| Profit at full equity | $ | 240,710 | 148,600 | (31) | 186,000 |
| Rate of return a | % | 5.2 | 3.1 | (32) | 3.9 |
p Preliminary estimate. y Provisional estimate. a Excluding capital appreciation. RSE Relative standard error.
Note: Estimates may not sum due to rounding.
Source: ABARES Australian Dairy Industry Survey
South Australia
Average farm cash income of South Australia dairy farms increased by 66% in 2018–19 mainly as a result of increased milk prices, and despite around two-thirds of farms reporting below average or drought conditions. Incomes of dairy farmers in South Australia are projected to have increased by a further 15% in 2019–20 (Table 8). Higher farmgate milk prices are projected to have contributed to an increase in average milk receipts per farm offsetting a projected decline in milk production per farm.
| Performance measure | Unit | 2017–18 | 2018–19p | RSE | 2019–20y |
|---|---|---|---|---|---|
| Total cash receipts | $ | 1,050,210 | 1,250,400 | (8) | 1,294,000 |
| less total cash costs | $ | 898,100 | 997,200 | (9) | 1,003,000 |
| Farm cash income | $ | 152,120 | 253,200 | (8) | 292,000 |
| plus change in trading stocks | $ | 68,770 | –16,300 | (122) | 4,000 |
| less depreciation | $ | 54,800 | 60,200 | (8) | 59,000 |
| less operator and family labour | $ | 86,190 | 98,400 | (6) | 103,000 |
| Farm business profit | $ | 79,890 | 78,300 | (35) | 134,000 |
| plus interest and lease payments | $ | 73,510 | 69,900 | (17) | 80,000 |
| Profit at full equity | $ | 153,400 | 148,200 | (18) | 214,000 |
| Rate of return a | % | 2.5 | 2.0 | (15) | 2.7 |
p Preliminary estimate. y Provisional estimate. a Excluding capital appreciation. RSE Relative standard error.
Note: Estimates may not sum due to rounding.
Source: ABARES Australian Dairy Industry Survey
Western Australia
Average farm cash income of Western Australia dairy farms declined by 19% in 2018–19 mainly as a result of increased expenditure on fodder. On average, farm cash income in Western Australia is projected to have declined by a further 6% in 2019–20 (Table 9). Milk production is projected to have been relatively unchanged in 2019–20, while expenditure on purchased feed is projected to have increased because of higher fodder prices and lower feed availability due to dry conditions and severe frosts.
| Performance measure | Unit | 2017–18 | 2018–19p | RSE | 2019–20y |
|---|---|---|---|---|---|
| Total cash receipts | $ | 1,391,110 | 1,401,200 | (7) | 1,394,000 |
| less total cash costs | $ | 1,092,870 | 1,158,200 | (7) | 1,166,000 |
| Farm cash income | $ | 298,230 | 243,000 | (12) | 228,000 |
| plus change in trading stocks | $ | 26,580 | 8,100 | (156) | –3,000 |
| less depreciation | $ | 71,090 | 74,100 | (9) | 81,000 |
| less operator and family labour | $ | 82,410 | 92,800 | (4) | 96,000 |
| Farm business profit | $ | 171,310 | 84,100 | (31) | 49,000 |
| plus interest and lease payments | $ | 88,500 | 104,300 | (12) | 96,000 |
| Profit at full equity | $ | 259,810 | 188,500 | (14) | 145,000 |
| Rate of return a | % | 2.7 | 2.0 | (15) | 1.5 |
p Preliminary estimate. y Provisional estimate. a Excluding capital appreciation. RSE Relative standard error.
Note: Estimates may not sum due to rounding.
Source: ABARES Australian Dairy Industry Survey
Tasmania
Average farm cash income of Tasmania dairy farms fell substantially in 2018–19 due to an increase in fodder costs. Farm cash income is projected to have increased in 2019–20 (Table 10) as a result of higher milk prices and a small increase in milk production. However, fodder costs are expected to have remained high due to the effects of the mainland drought on hay and feed grain prices.
| Performance measure | Unit | 2017–18 | 2018–19p | RSE | 2019–20y |
|---|---|---|---|---|---|
| Total cash receipts | $ | 1,198,610 | 1,254,900 | (6) | 1,318,000 |
| less total cash costs | $ | 916,440 | 1,119,400 | (7) | 1,113,000 |
| Farm cash income | $ | 282,170 | 135,500 | (41) | 205,000 |
| plus change in trading stocks | $ | 63,030 | 8,300 | (176) | 25,000 |
| less depreciation | $ | 54,090 | 50,600 | (11) | 52,000 |
| less operator and family labour | $ | 75,280 | 65,900 | (10) | 66,000 |
| Farm business profit | $ | 215,820 | 27,300 | (114) | 113,000 |
| plus interest and lease payments | $ | 100,830 | 123,500 | (14) | 119,000 |
| Profit at full equity | $ | 316,660 | 150,800 | (41) | 232,000 |
| Rate of return a | % | 5.5 | 2.4 | (41) | 3.7 |
p Preliminary estimate. y Provisional estimate. a Excluding capital appreciation. RSE Relative standard error.
Note: Estimates may not sum due to rounding.
Source: ABARES Australian Dairy Industry Survey
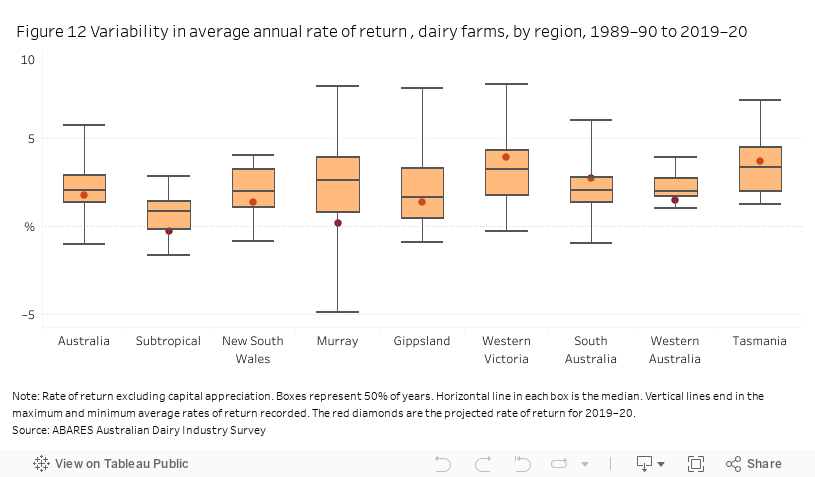
Variation in average rate of return
The long-term performance of farm businesses is determined by the level and variability of profits. Variations in the average rate of return for each region reflect changes over time in average seasonal conditions, commodity prices and the cost of farm inputs. Individual farms are likely to have experienced different variations in rate of return over the period than the region average. These are a result of farm-specific factors such as seasonal conditions, prices received, enterprise mix and the skills of the manager.
From 1989–90 to 2019–20 the annual average rate of return (excluding capital appreciation) for Australian dairy farms was positive in all years except the drought years of 2002–03 and 2006–07. However, average rates of return vary by region. Dairy farmers in Western Australia recorded the lowest variation in the average annual rate of return over the period while the Murray region had the greatest overall variation (Figure 12).
This tableau figure may not meet accessibility requirements. For information about the content of this figure contact ABARES
Debt and equity
Trends in average debt per farm
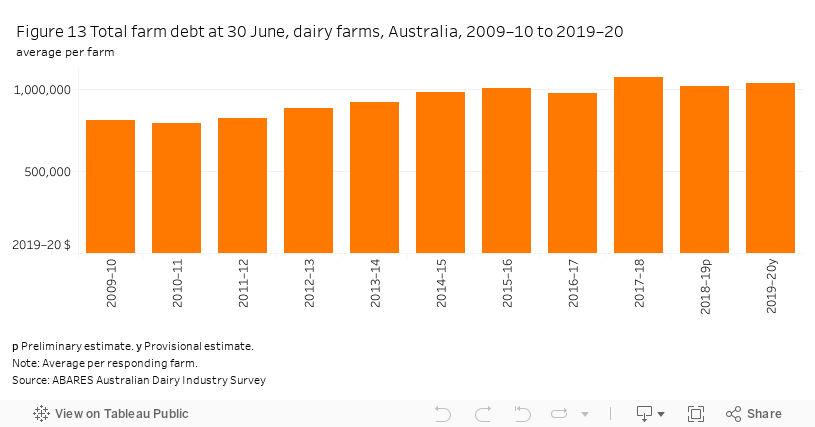
Debt is an important source of funds for farm investment and ongoing working capital for many dairy farms. At the national level, from 2009–10 to 2019–20, average debt of dairy farms trended upwards in real terms (Figure 13), mainly as a result of an increase in average farm size. Average debt of dairy farms decreased by around 5% in 2018–19, and is projected to have increased by around 2% in 2019–20.
This tableau figure may not meet accessibility requirements. For information about the content of this figure contact ABARES
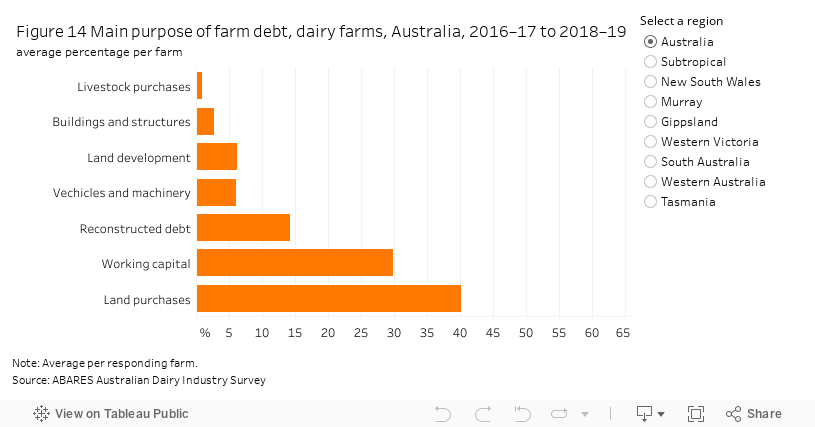
In ABARES farm surveys, debt is recorded by its main purpose. However, because some loans cover a range of purposes, estimates of debt by main purpose provide a guide only.
Over the 3 years to 2018–19, land purchases accounted for the largest proportion of dairy farm debt, around 40% on average (Figure 14). A further 30% of debt was for working capital and 14% was reconstructed debt. The remaining debt was for a range of purposes such as vehicles, machinery, buildings and structures. Additional detail is contained in the ‘farm capital and investment’ section of this report.
This tableau figure may not meet accessibility requirements. For information about the content of this figure contact ABARES
Equity ratio
The average equity ratio of dairy farms at the national level was 81% in 2018–19.
An estimated 38% of dairy farms had an equity ratio higher than 90% in 2018–19. On average, these farms were relatively small with an average milking herd of 185 cows (Table 11). A further 20% of farms had an equity ratio of less than 70%. These were mostly relatively large farms with higher than average herd size and milk production.
| Measure | Unit | Equity ratio | ||
|---|---|---|---|---|
| More than 90% | 70 to 90% | Less than 70% | ||
| Proportion of farms | % | 38 | 43 | 20 |
| Total area operated | ha | 250 | 300 | 371 |
| Number of dairy cows milked | no. | 185 | 270 | 382 |
| Total milk production | l | 980,400 | 1,557,900 | 2,254,500 |
| Milk receipts | $ | 505,000 | 776,600 | 1,133,400 |
| Total cash receipts | $ | 591,200 | 916,700 | 1,313,400 |
| Total cash costs | $ | 521,400 | 761,400 | 1,140,800 |
| Farm cash income | $ | 69,800 | 155,300 | 172,600 |
| Milk receipts as a proportion of total receipts | % | 85 | 85 | 86 |
Note: Average per responding farm. Based on preliminary estimates. Row and column totals may not sum to 100 due to rounding.
Source: ABARES Australian Dairy Industry Survey
Debt servicing capacity
The long-term viability of a farm is affected by its capacity to service debt, among many other factors. The servicing of debt consists of making interest payments and paying down the principal. The proportion of farm receipts spent on interest payments is a useful indicator of short-term capacity to service debt.
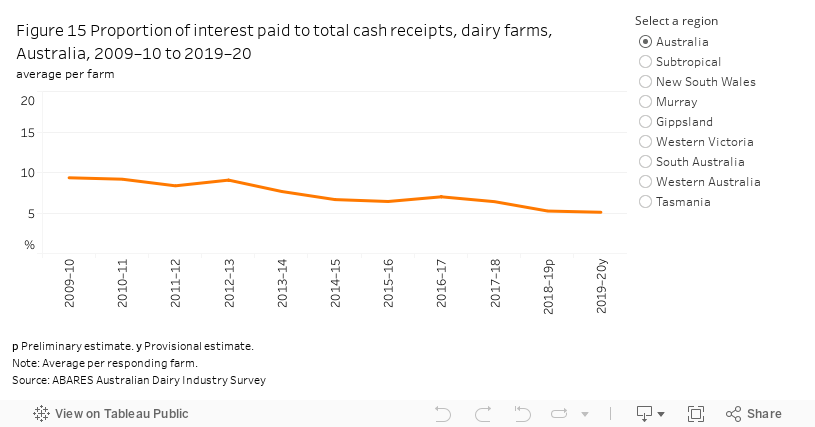
The proportion of farm receipts needed to fund interest payments declined from around 10% in 2009–10 to a projected 5% in 2019–20 (Figure 15). This trend was consistent across each of the regions. Low interest rates and increased cash receipts have contributed to the decrease in the overall ratio of interest paid to total cash receipts since 2012–13.
This tableau figure may not meet accessibility requirements. For information about the content of this figure contact ABARES
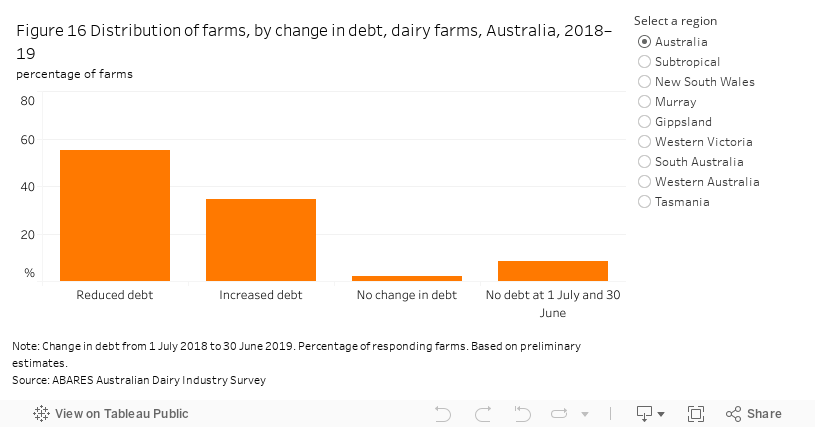
At the national level, around 55% of dairy farms reduced their average total debt in 2018–19, while 34% of farms increased their debt (Figure 16).
At a regional level, Western Victoria had the highest proportion of farms reducing their average total debt in 2018–19 (80%). Gippsland had the second highest proportion of farms reducing debt in 2018–19 (53%), while in South Australia 17% of farms reduced average total debt and 46% increased total debt.
This tableau figure may not meet accessibility requirements. For information about the content of this figure contact ABARES
Nationally, there was no significant difference in the size of farms reducing debt compared with those that increased debt (Table 12). However, cash incomes were around 40% lower for those increasing debt.
| Measure | Unit | Reducing debt | Increasing debt |
|---|---|---|---|
| Proportion of farms | % | 60 | 30 |
| Total area operated | ha. | 282 | 340 |
| Number of dairy cows mated | no. | 247 | 308 |
| Total milk production | l | 1,369,800 | 1,813,600 |
| Milk receipts | $ | 702,400 | 895,400 |
| Milk receipts as a proportion of total receipts | % | 86 | 85 |
| Total cash receipts | $ | 821,000 | 1,049,400 |
| Total cash costs | $ | 671,700 | 960,800 |
| Farm cash income | $ | 149,300 | 88,600 |
| Equity ratio | % | 82 | 78 |
Note: Average per responding farm. Based on preliminary estimates.
Source: ABARES Australian Dairy Industry Survey
Table 13 shows the distribution of dairy farms by debt and equity ratio at 30 June 2019. An estimated 17% of dairy farms in Australia held no debt. A further 7% of farms held less than $100,000 in debt. An estimated 33% of dairy farms held debt in excess of $1 million.
| Equity ratio | No debt | Less than $100,000 | $100,000 to less than $250,000 | $250,000 to less than $500,000 | $500,000 to less than $1m | $1m to less than $2m | More than $2m | Total |
|---|---|---|---|---|---|---|---|---|
| Greater than or equal to 90% | 17 | 7 | 9 | 1 | 3 | 0 | 0 | 38 |
| 80 to less than 90% | 0 | 0 | 3 | 8 | 9 | 5 | 1 | 25 |
| 70 to less than 80% | 0 | 0 | 0 | 1 | 7 | 6 | 3 | 17 |
| 60 to less than 70% | 0 | 0 | 0 | 0 | 0 | 5 | 6 | 12 |
| Less than 60% | 0 | 0 | 0 | 0 | 3 | 1 | 5 | 8 |
| Total | 17 | 7 | 11 | 9 | 22 | 17 | 16 | 100 |
Note: Percentage of responding farms. Based on preliminary estimates. Row and column totals may not sum to 100 due to rounding.
Source: ABARES Australian Dairy Industry Survey
Farm debt and equity, by region
Debt and equity on dairy farms varied significantly by region. Dairy farms in Tasmania recorded the highest farm business debt on average from 2009–10 to 2019–20 (Figure 17). This result reflects the relatively high proportion of large farms in that region, and a recent expansion in dairy production.
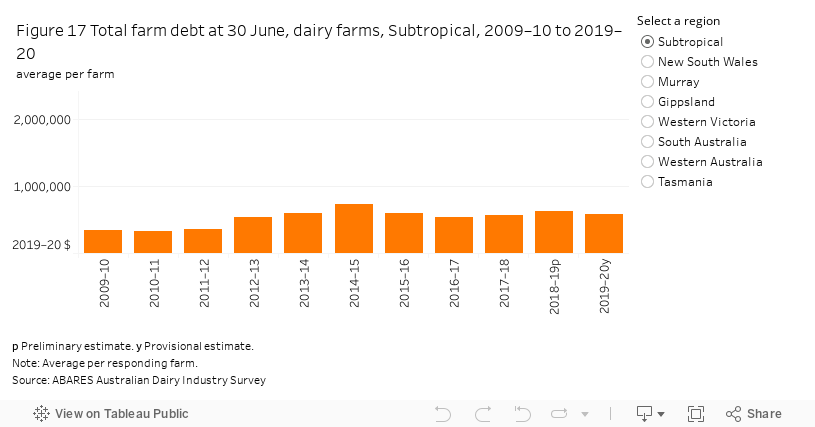
This tableau figure may not meet accessibility requirements. For information about the content of this figure contact ABARES
Capital and investment
Total farm capital
Investment in farm capital is important for the ongoing development of the Australian dairy industry. Investments in land, fixed improvements, and plant and equipment are key drivers of dairy farmers’ capacity to generate farm outputs.
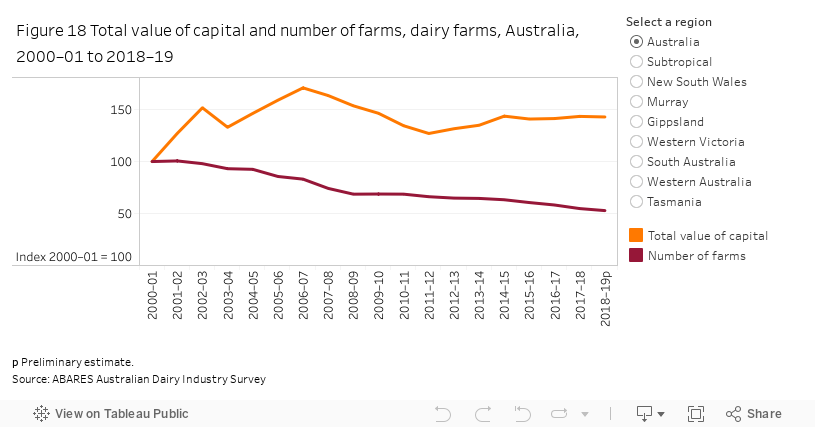
The total value of capital of Australian dairy farms was around 43% higher in 2018–19 than in 2000–01 in real terms, with most of this growth occurring in the early 2000s (Figure 18). Dairy farms in the Murray region accounted for 22% of total dairy farm capital in 2018–19. The Gippsland region accounted for 21% of total capital and the Western Victoria region accounted for 19% of total capital. New South Wales (10%), Tasmania (9%), Subtropical (8%), South Australia (6%) and Western Australia (5%) accounted for the remaining total dairy farm capital in 2018–19.
On a per farm basis, the value of total capital has increased by 171% since 2000–01, to an estimated $5.6 million in 2018–19, largely because of increasing average farm sizes and overall appreciation in land values. The per farm increase in total capital is greater than the aggregate increase because the number of farms has fallen by 47% since 2000–01.
This tableau figure may not meet accessibility requirements. For information about the content of this figure contact ABARES
The distribution of farms by asset value has changed substantially over time. From 2000–01 to 2018–19, the proportion of dairy farms with a capital value of less than $2 million (in real terms) fell substantially from 73% to 9% (Figure 19).

This tableau figure may not meet accessibility requirements. For information about the content of this figure contact ABARES
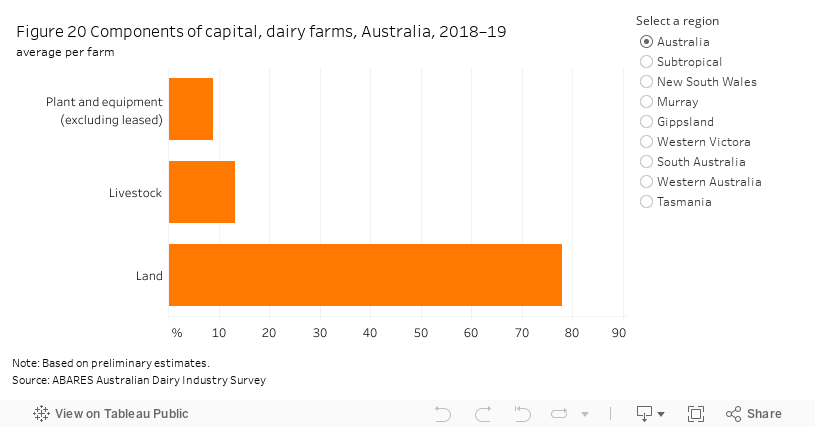
Land accounted for an average of 78% of total capital per dairy farm in 2018–19 (Figure 20). Livestock accounted for a further 13% of total capital, and plant and equipment accounted for 9%.
This tableau figure may not meet accessibility requirements. For information about the content of this figure contact ABARES
Return on land
ABARES uses two rates of return to farm capital—rate of return excluding capital appreciation and rate of return including capital appreciation. Rate of return is defined as farm profit at full equity expressed as a percentage of total capital. Because land is the largest component of total farm capital, it plays a key role in determining total farm returns.
Figure 21 shows the average value of land and fixed improvements per hectare. Strong demand for farm land led to sharp increases in dairy farm land values from 2001–02 to 2006–07, with an average annual return from land appreciation of 14.6% per year. Land values then declined from 2007–08 to 2012–13 across all major dairy regions. This was more substantial than declines in land prices observed for other industries. The more rapid fall in the average value of dairy farm land values is likely due in part to the relatively rapid consolidation in the dairy industry, including the conversion of dairy farm land to other uses. Land values continued to increase in subsequent years to 2018–19.

This tableau figure may not meet accessibility requirements. For information about the content of this figure contact ABARES
New farm investment
Most farmers make new investments each year to add to existing capital or to replace capital items that have reached the end of their useful life. Farm investments are usually made with longer-term outcomes in mind and based on expected returns over the life of the investment.
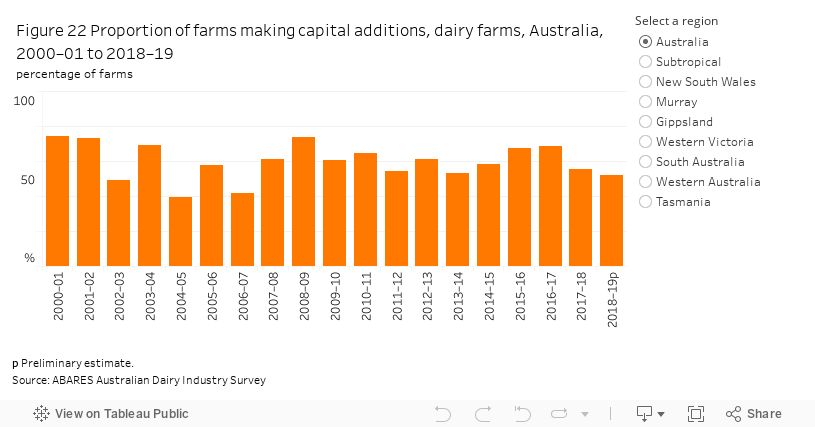
On average, 60% of dairy farms each year made additions to their total capital over the 10 years to 2018–19 (Figure 22). The amount invested each year by those making capital additions fluctuated broadly in line with movements in farm cash incomes. In 2018–19, an estimated 52% of dairy farms made capital additions.
This tableau figure may not meet accessibility requirements. For information about the content of this figure contact ABARES
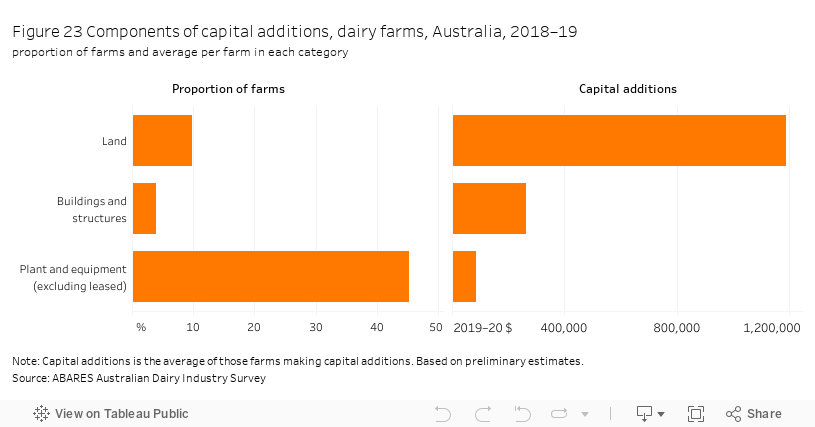
Figure 23 shows the proportion of dairy farms that made capital additions in 2018–19 and the average capital addition in three categories—land purchases, plant and equipment, and buildings and structures. Land is the biggest component of capital additions, although only 10% of dairy farms bought land in 2018–19. Average expenditure on land for those making purchases was around $1.2 million per farm.
Around 45% of all dairy farms made additions to plant and equipment in 2018–19, at an average of around $87,000 per farm. Around 4% of dairy farms made additions to buildings and structures, at an average of $265,000 per farm.
This tableau figure may not meet accessibility requirements. For information about the content of this figure contact ABARES
Farm characteristics
Total farms and milk production
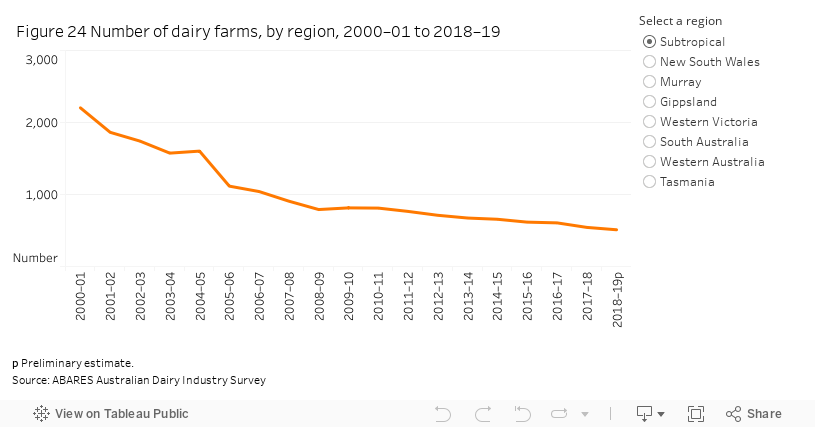
In 2018–19, there were an estimated 5,800 dairy farms in Australia. From 2000–01 to 2018–19 the total number of Australian dairy farms fell by around 47% (Figure 24).
This tableau figure may not meet accessibility requirements. For information about the content of this figure contact ABARES
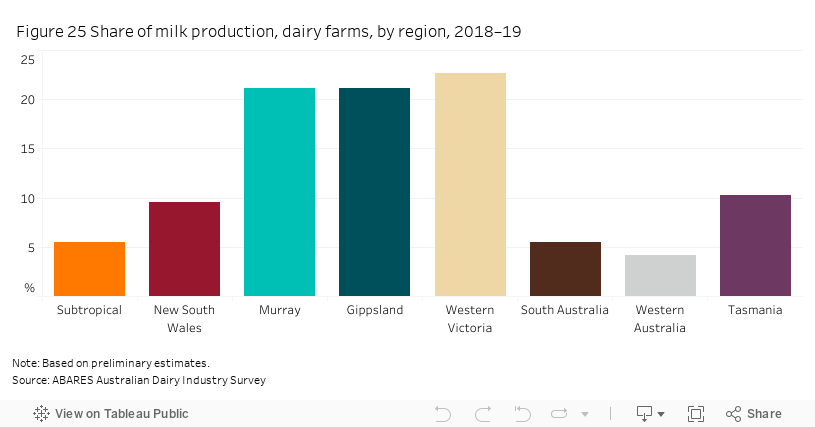
Western Victoria (23%), Murray (21%) and Gippsland (21%) are the largest milk producing regions in Australia, accounting for an estimated 65% of total milk production in 2018–19 (Figure 25). The concentration of Australian milk production among the regions has shifted between 2000–01 and 2018–19. The shares of New South Wales, Gippsland, Western Victoria and Tasmania increased over the period, Western Australia remained steady, while Subtropical, Murray and South Australia declined.
This tableau figure may not meet accessibility requirements. For information about the content of this figure contact ABARES
Farm size
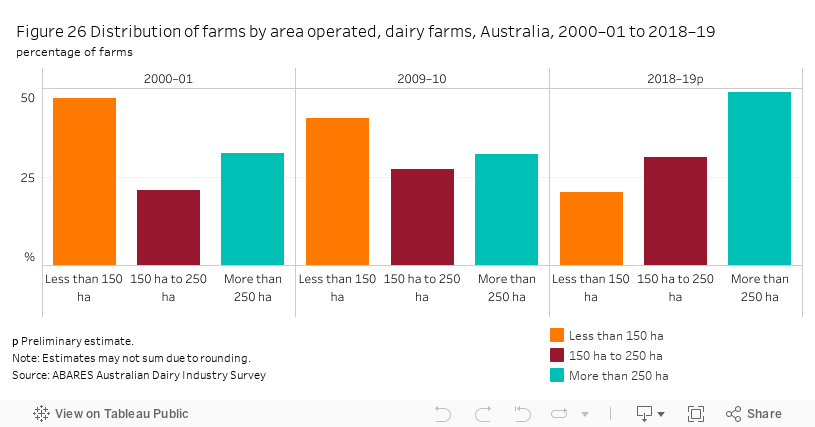
The average area of dairy farms increased from 221 hectares in 2000–01 to 307 hectares in 2018–19. This was mainly a result of reductions in the number of small farms, although many farms also increased in size by purchasing additional land. From 2000–01 to 2018–19, the proportion of dairy farms with an area operated of less than 150 hectares declined and the proportion with an area operated of greater than 150 hectares increased (Figure 26).
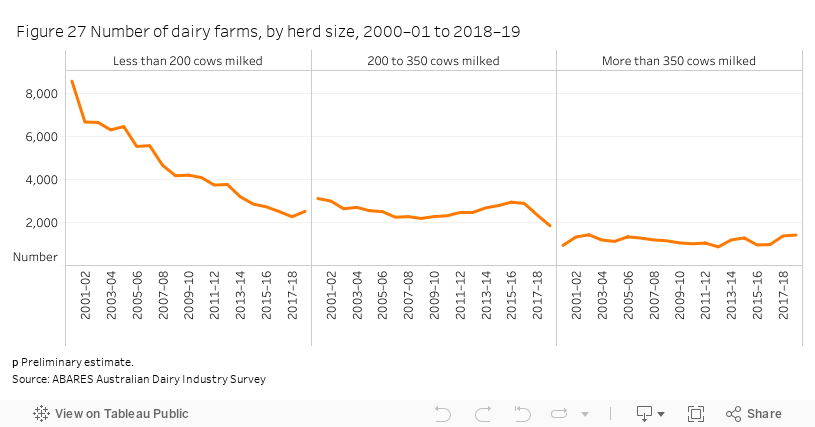
Similar changes occurred in herd size, with large declines in the number of farms milking fewer than 200 cows (Figure 27). The number of farms milking 200 to 350 cows initially fell, but increased towards the end of the period as a number of small farms increased the size of their milking herds. In 2018–19 the number of farms milking 200 to 350 cows declined as a result of an increased number of cows sold due to drought. This led to an increase in the number of farms milking fewer than 200 cows in 2018–19. The number of farms milking more than 350 cows remained relatively steady over the period.
This tableau figure may not meet accessibility requirements. For information about the content of this figure contact ABARES
This tableau figure may not meet accessibility requirements. For information about the content of this figure contact ABARES
Milk production per farm
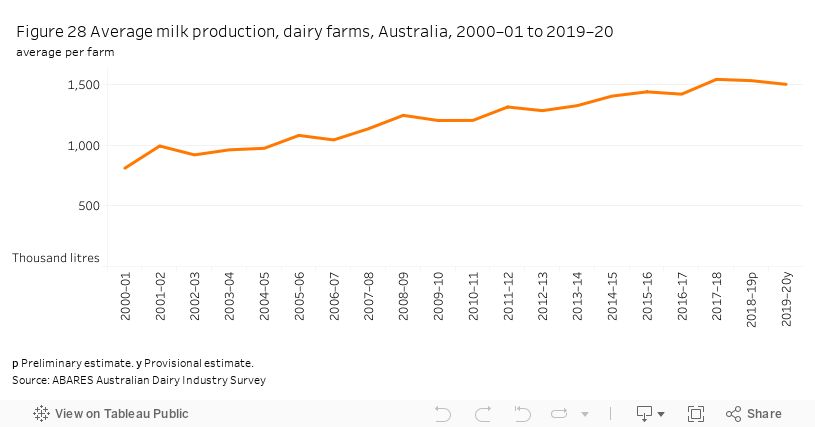
Average milk production per farm increased from 2000–01 to 2018–19 (Figure 28). This increase was driven by increases in average herd size—with higher stocking rates and higher average milk yields. In 2019–20, milk production per farm is projected to have fallen by 2% to an estimated 1.5 million litres per farm.
This tableau figure may not meet accessibility requirements. For information about the content of this figure contact ABARES
Seasonality of milk production
Dairy farmers generally design production systems to take advantage of variations in pasture growth and milk prices throughout the year, among other factors. In particular, the choice of calving pattern determines the seasonality of milk supply and demand for fodder. Common calving patterns are seasonal, year round and split.
On average over the 5 years to 2018–19, 51% of dairy farms used year-round calving, 26% used seasonal calving and 22% used split calving. Dairy farms using a split calving pattern produced larger milk volumes on average over the 5 years to 2018–19. Split calving is generally associated with more cows being milked and greater average milk yield per cow than seasonal and year-round calving (Table 14).
Use of these calving patterns varied by state over the 5 years to 2018–19. Dairy farms in Queensland, New South Wales, South Australia and Western Australia primarily use year-round calving to maintain a year-round supply of fresh milk to the domestic market. Dairy farms in Victoria use a mix of seasonal, year-round or split calving patterns. In Tasmania, dairy farms primarily use a seasonal calving pattern. Dairy farms that used either a year round or split calving pattern had higher fodder costs per cow milked and higher yields per cow than farms that used a seasonal milking pattern.
| Measure | Unit | Year-round | Seasonal | Split |
|---|---|---|---|---|
| Total cash receipts | $ | 802,630 | 709,070 | 893,960 |
| Total cash costs | $ | 682,450 | 571,540 | 748,850 |
| Farm cash income | $ | 120,180 | 137,530 | 145,110 |
| Farm business profit | $ | 16,110 | 26,220 | 28,740 |
| Rate of return a | % | 1.8 | 2.1 | 2.2 |
| Cows milked | no. | 240 | 260 | 280 |
| Milk per cow | L/cattle | 5,930 | 5,240 | 6,000 |
| Stocking rate | Cattle/ha | 1.3 | 1.5 | 1.5 |
| Fodder expenditure per cow milked | $ | 890 | 650 | 870 |
a Excluding capital appreciation.
Source: ABARES Australian Dairy Industry Survey
Productivity
Agricultural productivity estimates are available for the dairy industry.
References
ABS 2020, Value of agricultural commodities produced, Australia, 2018–2019, cat. no. 7503.0 Australian Bureau of Statistics, Canberra, accessed 1 June 2020.
Data and other resources
Broadacre and dairy industries data
AgSurf provides a large selection of ABARES farm survey data on the broadacre and dairy industries.
See our previous research page for previous versions of the report Australian dairy: financial performance of dairy farms.
Farm surveys definitions and methods
Further information about our survey definitions and methods.
Farm performance: broadacre and dairy farms
This web report provides a detailed profile of the financial performance of farm businesses in the grains, livestock and dairy industries in the years 2017–18 to 2019–20.
Download the full report