
2017–18 to 2019–20
Fred Litchfield
[expand all]
Financial performance
Farm cash income
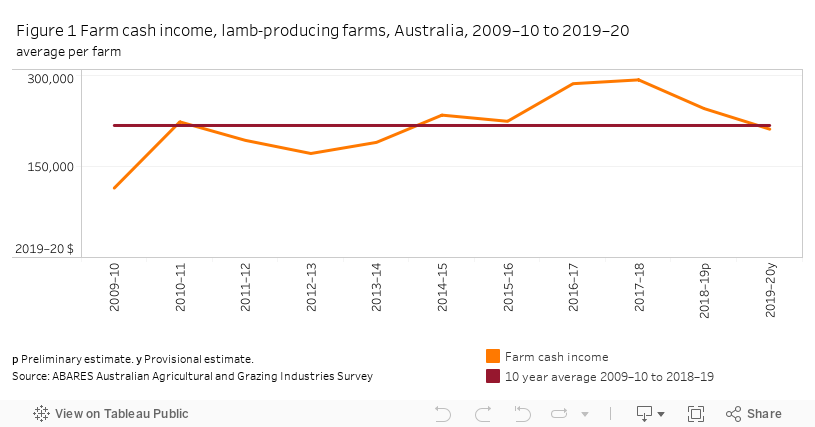
Farm cash income of Australian lamb-producing farms is projected to have declined by 12% in 2019–20 to average $211,000 per farm (Table 1, Figure 1). Despite high prices for lambs and sheep, receipts for lambs, sheep and wool declined because of lower sheep numbers and reduced sales as a consequence of drought in much of eastern Australia and parts of Western Australia. The fall in average farm cash income in 2019–20 follows a 15% decline in 2018–19.
Many lamb-producing farms have significant cropping enterprises. Crop receipts for lamb-producing farms are projected to have remained steady at the national level in 2019–20. Good seasonal conditions in parts of the southern states leading to increased crop production is projected to have offset the effects of drought in other lamb producing regions.
a Excluding capital appreciation. p Preliminary estimate. y Provisional estimate. RSE Relative standard error.
Note: Estimates may not sum due to rounding. Definitions and description of data source are provided in Box 1.
Source: ABARES Australian Agricultural and Grazing Industries Survey
Note: Farm cash income varies over time because of short-term changes in factors such as commodity prices, seasonal conditions and management decisions, as well as longer-term changes in the farm sector, such as growth in average farm size, shifts in enterprise mix and technological progress. Appropriate consideration of the long-term factors is essential when interpreting changes in farm cash income over periods longer than 3 to 5 years.
This tableau figure may not meet accessibility requirements. For information about the content of this figure contact ABARES
Despite continued high prices for lambs supporting livestock receipts somewhat in 2019–20, farm cash income is projected to have been considerably lower than the peaks experienced in 2016–17 and 2017–18. This is mainly due to reduced crop production and higher fodder costs because of drought. Farm cash income in 2019–20 is projected to have been 3% below the 10 year average to 2018–19 in real terms.
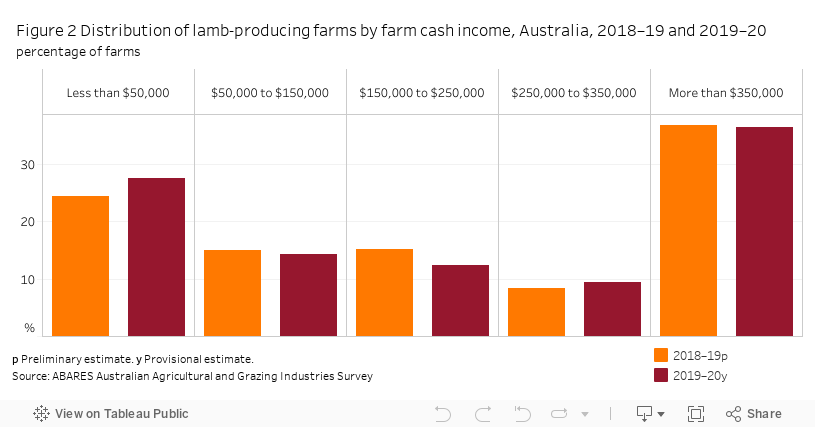
At the national level, around 28% of lamb-producing farms are expected to have cash incomes below $50,000 in 2019–20 (Figure 2). The majority of these farms are in New South Wales. The proportion of farms with incomes above $350,000 is projected to have remained steady at around 36% in 2019–20. The majority of these farms are in Victoria and South Australia.
This tableau figure may not meet accessibility requirements. For information about the content of this figure contact ABARES
Box 1 About this report
The data presented in this report are collected by ABARES through the Australian Agricultural and Grazing Industries Survey (AAGIS), which is funded by the Department of Agriculture, Water and the Environment, Meat & Livestock Australia (MLA) and the Grains Research and Development Corporation. The results included in this report are for farms included in AAGIS that had at least 200 lambs for slaughter. MLA commissioned and funded this analysis of lamb industry farm performance.
Map 1 Australian lamb producing regions
Source: ABARES
Definitions of major financial performance indicators:
Total cash receipts: total revenues received by the business during the financial year
Total cash costs: payments made by the business for materials and services and for permanent and casual hired labour (excluding owner–manager, partner and family labour)
Farm cash income: total cash receipts – total cash costs
Farm business profit: farm cash income + change in trading stocks – depreciation – imputed labour costs
Profit at full equity: return produced by all the resources used in the business: farm business profit + rent + interest + finance lease payments – depreciation on leased items
Rate of return excluding capital appreciation: efficiency of businesses in generating returns from all resources used (profit at full equity/total opening capital) x 100
Farm household income
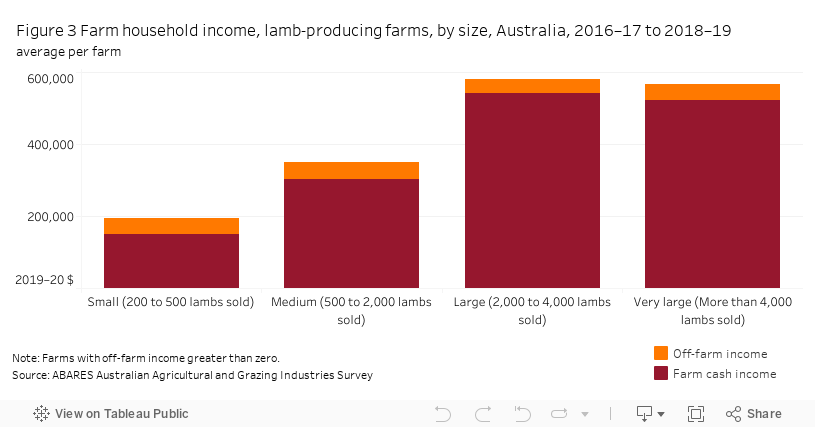
Farm cash income is a comprehensive measure of the income generated by the business for use by the farm household for consumption and investment. However, activities other than farming are also an important source of income for many farm households. This diversification is an important risk management strategy for many Australian farmers. On average over the 3 years to 2018–19, around 76% of lamb-producing farms earned off-farm income, at an average value of $44,800 per farm, equivalent to 15% of farm household income (for farms with off-farm income) (Table 2).
The importance of off-farm income varies with farm size (Figure 3). For small lamb-producing farms (200 to 500 lambs sold), off-farm income accounts for 22% of overall household income. Around 75% of small lamb-producing farms received off-farm income over the 3 years to 2018–19. Around 52% of very large lamb-producing farms (more than 4,000 lambs sold) earned some off-farm income, with an average value of $44,600 (8% of household income).
a All responding farms. b Farms with off-farm income greater than zero.
Note: Financial data in 2019–20 dollars.
Source: ABARES Australian Agricultural and Grazing Industries Survey
This tableau figure may not meet accessibility requirements. For information about the content of this figure contact ABARES
Farm business profit
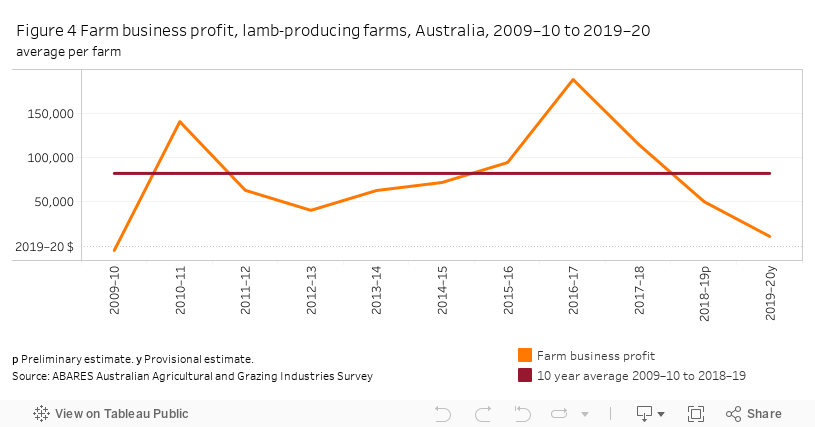
Farm business profit is a comprehensive measure of the long-term economic performance of farm businesses. In addition to the receipts and costs included in farm cash income, farm business profit also accounts for non-cash costs incurred by farm businesses, namely capital depreciation, payments for family labour and changes in inventories of livestock, fodder and grain held on farms.
At the national level, farm business profit declined by around 56% in 2018–19 driven by the decline in cash receipts, higher cash costs and by a rundown in trading stocks as many lamb-producing farms decreased their flocks and stocks of grain (Figure 4). Farm business profit is projected to have fallen by a further 78% in 2019–20 due to the continued effects of drought in much of Australia and a further rundown in trading stocks. In 2019–20, farm business profit was around $71,000 below the 10 year average.
Note: Farm business profit varies over time because of short-term changes in factors such as commodity prices, seasonal conditions and management decisions, as well as longer-term changes in the farm sector, such as growth in average farm size, shifts in enterprise mix and technological progress. Appropriate consideration of the long-term factors is essential when interpreting changes in farm business profit over periods longer than 3 to 5 years.
This tableau figure may not meet accessibility requirements. For information about the content of this figure contact ABARES
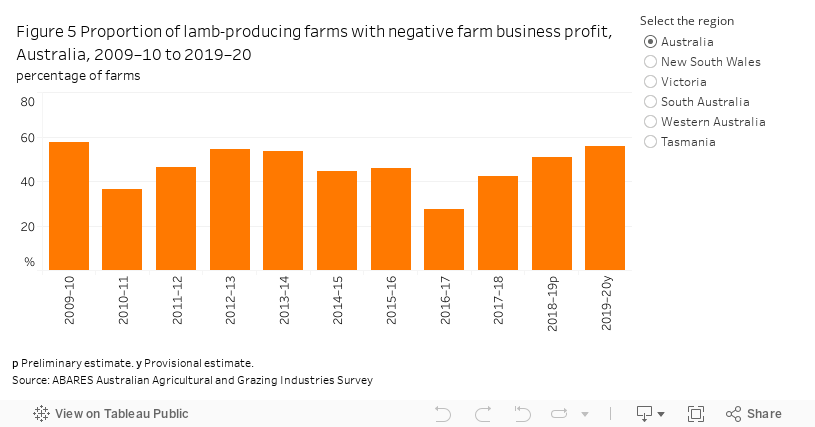
Over the 10 years to 2018–19, the proportion of lamb-producing farms recording negative farm business profit averaged around 46% a year (Figure 5). In 2019–20, around 56% of lamb-producing farms are projected to have recorded a negative farm business profit.
This tableau figure may not meet accessibility requirements. For information about the content of this figure contact ABARES
Negative farm business profit in a particular year typically means a farm has not covered the costs of family labour or set aside sufficient funds to replace depreciating farm assets (and has also possibly not covered all cash costs). Many farms occasionally record negative farm business profit when their income fluctuates. However, ongoing low or negative profit affects long-term viability because farms have reduced capacity to invest in newer and more efficient technologies.
In some cases, negative farm business profit reflects short-term factors such as fluctuations in seasonal conditions and prices, and one-off events such as injury or illness. On average, 17% of lamb-producing farms recording negative farm business profit in any given year from 2009–10 to 2018–19 recorded a positive profit in the following year. In other cases, farm business profit is consistently low or negative over time, reflecting the fact that many farm households are supported by off-farm income and derive other benefits from owning farms such as amenity and long-term growth in asset values.
Rate of return
The most complete measure of farm business performance is the rate of return. This variable is calculated by dividing profit generated in a particular year by the value of assets used in that year. By capturing the value of the assets used by the business, rate of return effectively measures the efficiency with which the funds invested in a farm (for example in land, machinery and livestock) have been used to generate profit. With appropriate consideration of risk, farm rates of return can be compared to those generated by other potential uses of capital, such as debt and equity investments.
ABARES calculates rate of return to capital by expressing profit at full equity – that is, farm business profit plus rent, interest and finance lease payments – as a percentage of total opening capital. Rate of return represents the ability of businesses to generate a return to all capital used by the business, including that which is borrowed or leased. Finance costs are added back in to farm business profit so that rates of return can be compared across farms regardless of their debt arrangements.
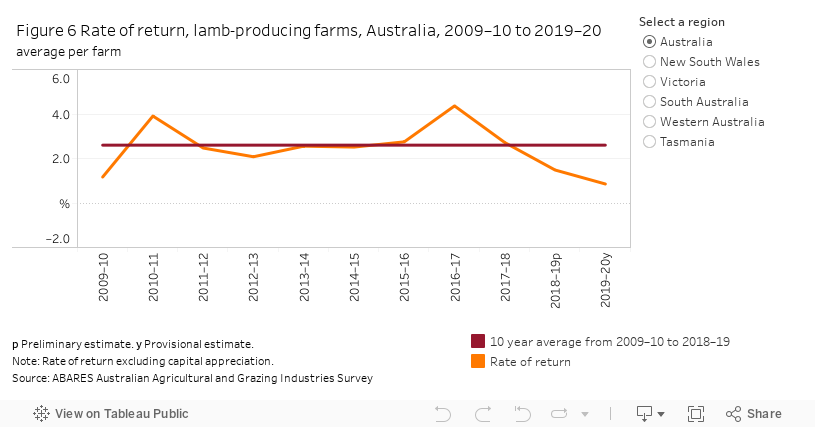
In 2018–19, the average rate of return (excluding capital appreciation) for lamb-producing farms declined to 1.5% (Figure 6). In 2019–20, the average rate of return is projected to have fallen further to around 0.9%, well below the average of 2.6% recorded from 2009–10 to 2018–19. In comparison, the average rate of return for all broadacre farms in 2019–20 is estimated to have been 0.3%.
This tableau figure may not meet accessibility requirements. For information about the content of this figure contact ABARES
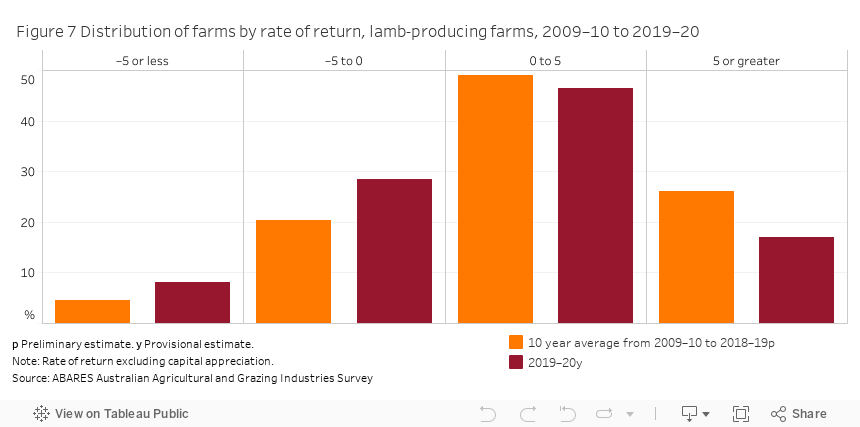
Similar to other measures of performance, rates of return vary widely across lamb-producing farms (Figure 7). From 2009–10 to 2018–19, 75% of lamb-producing farms recorded a positive rate of return (excluding capital appreciation) and an estimated 26% of farms earned rates of return greater than 5%. In 2019–20, around two-thirds of farms are projected to have recorded a positive rate of return (excluding capital appreciation) and an estimated 17% of farms are projected to have earnt rates of return greater than 5%. On average, larger lamb-producing farms have higher rates of return than smaller lamb-producing farms.
Ongoing increases in farm land prices in Australia over recent decades mean that farm rates of return are typically higher when changes in the value of capital items are included as a source of returns. However, these ‘real estate’ returns are ideally kept separate when seeking to understand the performance of farm enterprises such as livestock and crop production. When changes in the value of capital items are included, the average rate of return for lamb-producing farms over the 10 years to 2018–19 increases from 2.6% to 5.3% and 78% of farms earned a positive rate of return.
Variation in returns across farms reflects differences in seasonal conditions, prices and other factors between farms in any particular year. This variation is quite distinct from measures of farm business ‘risk’ – which is defined as the variation in returns or profits over time for individual farm businesses. This latter type of variation reflects changes over time in seasonal conditions, commodity prices and the cost of farm inputs, as well as farm-specific factors such as enterprise mix and the skills and experience of the farm manager. The focus of this report is presenting industry-level estimates, rather than farm-level.
This tableau figure may not meet accessibility requirements. For information about the content of this figure contact ABARES
Performance by state
The financial performance of lamb-producing farms in 2019–20 varies between and within states reflecting differences in seasonal conditions, markets and farm enterprise mix.
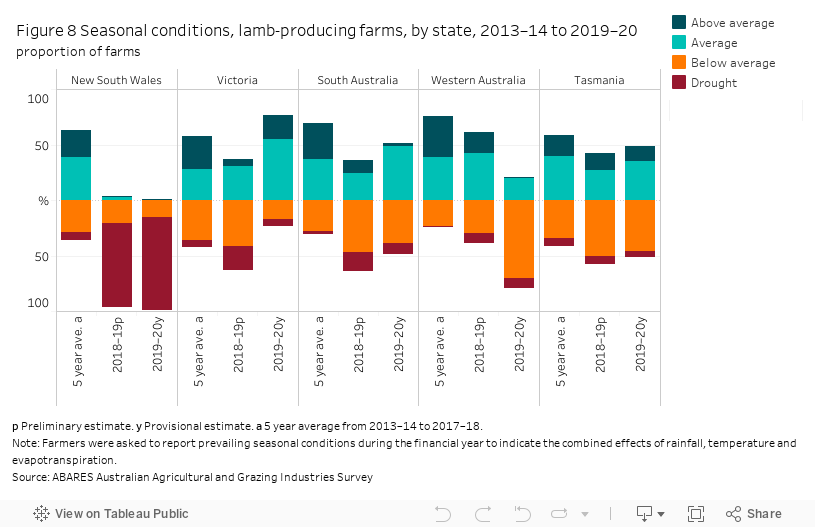
Lamb-producing farms in New South Wales recorded a second consecutive year of extreme drought, with 99% of farms reporting below average or drought conditions (Figure 8). In Victoria, South Australia and Tasmania, the proportion of farms reporting below average seasonal conditions declined in 2019–20. In contrast, seasonal conditions worsened in Western Australia, with around 79% of lamb-producing farms reporting below average or drought conditions in 2019–20.
This tableau figure may not meet accessibility requirements. For information about the content of this figure contact ABARES
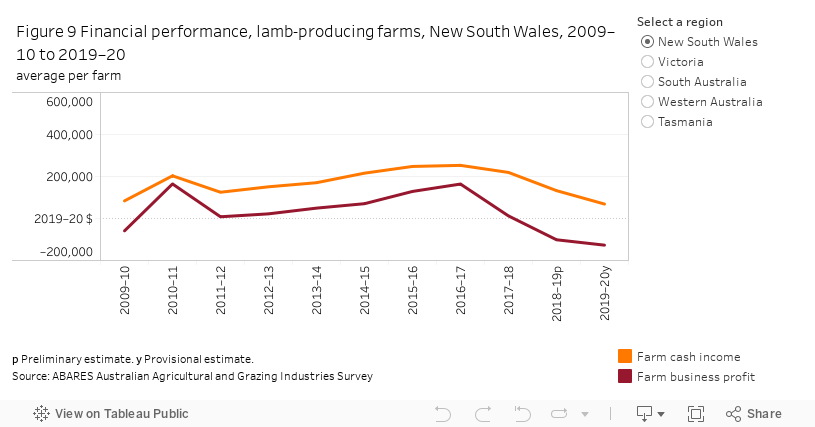
In 2019–20, average farm cash income of lamb-producing farms is projected to have increased in Victoria, South Australia and Tasmania, but fall in New South Wales and Western Australia (Figure 9 and Table 3).
Note: Farm cash income and farm business profit vary over time because of short-term changes in factors such as commodity prices, seasonal conditions and management decisions, as well as longer-term changes in the farm sector, such as growth in average farm size, shifts in enterprise mix and technological progress. Appropriate consideration of the long-term factors is essential when interpreting changes in farm cash income and business profit over periods longer than 3 to 5 years.
This tableau figure may not meet accessibility requirements. For information about the content of this figure contact ABARES
p Preliminary estimate. y Provisional estimate. a Excluding capital appreciation.
Note: Estimates may not sum due to rounding.
Source: ABARES Australian Agricultural and Grazing Industries Survey
Regional variation in average rate of return
Tasmania has had the smallest range and lowest maximum average rate of return over the past 30 years, but nonetheless recorded the highest average rate of return in 2019–20 (Figure 10). Western Australia had the highest median average rates of return and the widest range over the period. This is due to the greater importance but higher variability of cropping to farm incomes of lamb-producing farms in this state.

This tableau figure may not meet accessibility requirements. For information about the content of this figure contact ABARES
Performance by scale of lamb production
The economic performance of lamb-producing farms varies greatly with farm size, with small farms tending to generate substantially lower profits than larger businesses in most years on average. All sizes of lamb-producing farms (by number of lambs sold), except very large-scale farms, are projected to have had lower average farm cash income in 2019–20 (Table 4). For very large-scale farms, a fall in total cash receipts from lower sheep, wool and beef cattle receipts is projected to have been offset by a fall in total cash costs, mainly from reduced fodder expenditure. Farm business profit and rate of return are projected to have declined in 2019-20 across all farm size categories, except for small-scale farms.
p Preliminary estimate. y Provisional estimate. a Excluding capital appreciation.
Source: ABARES Australian Agricultural and Grazing Industries Survey
Debt and equity
Trends in average debt per farm
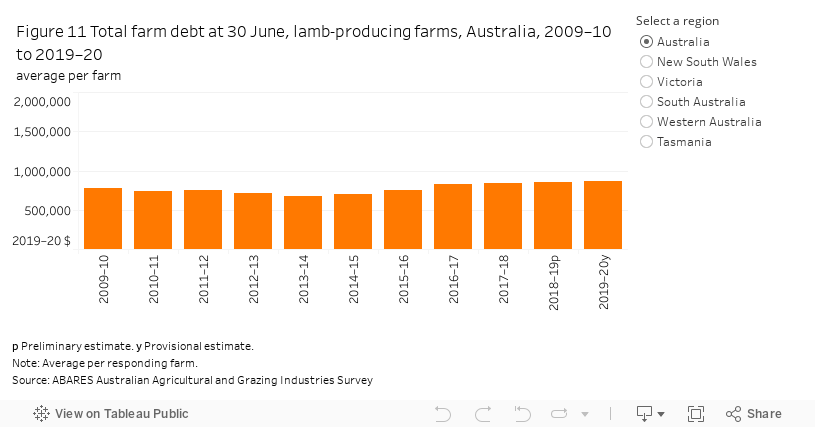
Debt is an important source of funds for farm investment and ongoing working capital for many lamb-producing farms. From 2013–14 to 2019–20, average debt of lamb-producing farms increased in real terms, mainly due to increases in average farm size and change in industry mix toward cropping farms that have higher working capital debt than livestock farms (Figure 11). In 2018–19, average debt of lamb-producing farms increased slightly to $852,700 per farm. Average debt is projected to have increased further in 2019–20 to $865,000 per farm.
This tableau figure may not meet accessibility requirements. For information about the content of this figure contact ABARES
In ABARES farm surveys, debt is recorded by its main purpose. However, because some loans cover a range of purposes, estimates of debt by main purpose provide a guide only.
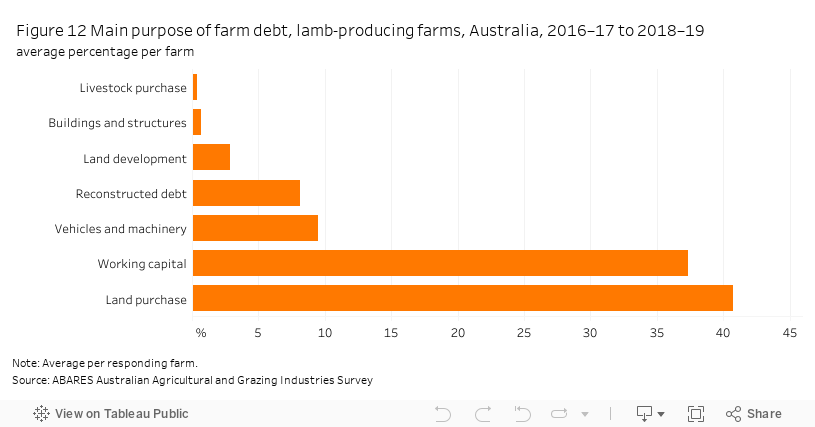
Over the 3 years to 2018–19, land purchases accounted for the largest proportion of total farm debt for lamb-producing farms, at 41% on average (Figure 12). A further 37% of debt was for working capital. The remaining debt was for a range of purposes such as vehicles, machinery, land development, buildings and structures. As a result of the mixed nature of lamb-producing farms, a significant proportion of working capital debt is for cropping enterprises. Additional detail is contained in the ‘farm capital and investment’ section of this report.
This tableau figure may not meet accessibility requirements. For information about the content of this figure contact ABARES
Equity ratio
Increases in average total debt of lamb-producing farms have been largely matched by increases in the total value of farm capital. As a consequence, over the 10 years to 2018–19, the average equity ratio has fluctuated around 86%.
An estimated 62% of lamb-producing farms had an equity ratio greater than 90% in 2018–19 (Table 5). On average, lamb-producing farms with higher equity ratios tend to be smaller than farms with lower equity ratios. Lamb receipts as a proportion of total receipts decrease with equity ratio, reflecting a higher level of enterprise diversification among larger farms.
Note: Average per responding farm. Based on preliminary estimates.
Source: ABARES Australian Agricultural and Grazing Industries Survey
Debt servicing capacity
The long-term viability of a farm is affected by its capacity to service debt, among many other factors. The servicing of debt consists of making interest payments and paying down the principal. The proportion of farm receipts spent on interest payments is a useful indicator of short-term capacity to service debt.
The ratio of interest payments to total cash receipts fell from an average of around 10% for lamb-producing farms in 2009–10 to around 5% in 2017–18 (Figure 13). Increased cash receipts and lower interest rates were the main reasons for this decline. In 2019–20, the proportion of farm receipts needed to fund interest payments is projected to have been around 6%.

This tableau figure may not meet accessibility requirements. For information about the content of this figure contact ABARES
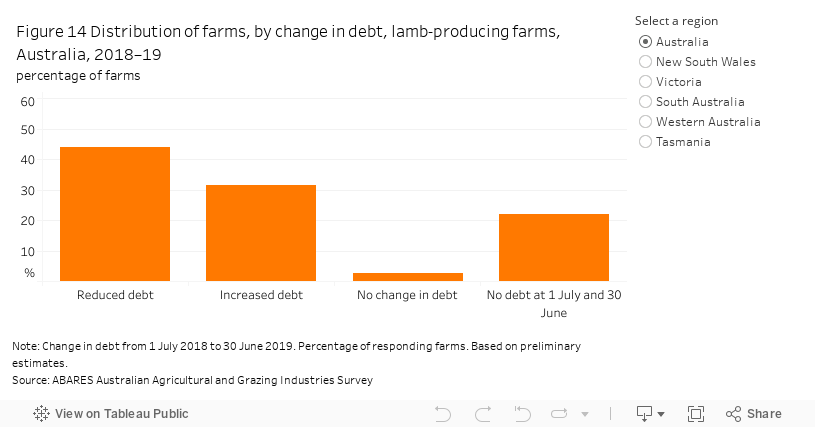
At the national level, around 44% of lamb-producing farms reduced total debt in 2018–19, while a further 31% increased debt (Figure 14).
This tableau figure may not meet accessibility requirements. For information about the content of this figure contact ABARES
Nationally, there was no significant difference in the size of lamb-producing farms reducing debt compared with those that increased debt, either by area operated or by number of lambs sold (Table 6).
Note: Average per responding farm. Based on preliminary estimates.
Source: ABARES Australian Agricultural and Grazing Industries Survey.
Table 7 shows the distribution of lamb-producing farms by debt and equity ratio at 30 June 2019. An estimated 26% of all lamb-producing farms in Australia held no debt at 30 June and a further 13% of farms held less than $100,000 in debt. An estimated 26% of lamb-producing farms had debt exceeding $1 million with average debt of lamb-producing farms closely related to the scale of cropping activities.
Note: Percentage of responding farms. Based on preliminary estimates. Row and column totals may not sum to 100 due to rounding.
Source: ABARES Australian Agricultural and Grazing Industries Survey
Debt and equity, by farm size
From 2009–10 to 2019–20, lamb-producing farms of all sizes increased their average debt for purchasing land and working capital. In 2018–19, average debt for small lamb-producing farms (200 to 500 lambs sold) rose by 21% from the previous year, driven mainly by expenditure on working capital (Table 8).
From 2009–10 to 2018–19, equity ratios showed little variation across the two largest size groups, but increased for small and medium size lamb-producing farms as total farm capital increased by a greater extent than total farm debt.
p Preliminary estimate.
Note: Average per responding farm.
Source: ABARES Australian Agricultural and Grazing Industries Survey
Capital and investment
Total farm capital
Investment in farm capital is important for the ongoing development of the Australian lamb industry. Investments in land, fixed improvements, and plant and equipment are key drivers of lamb producers’ capacity to generate farm outputs.
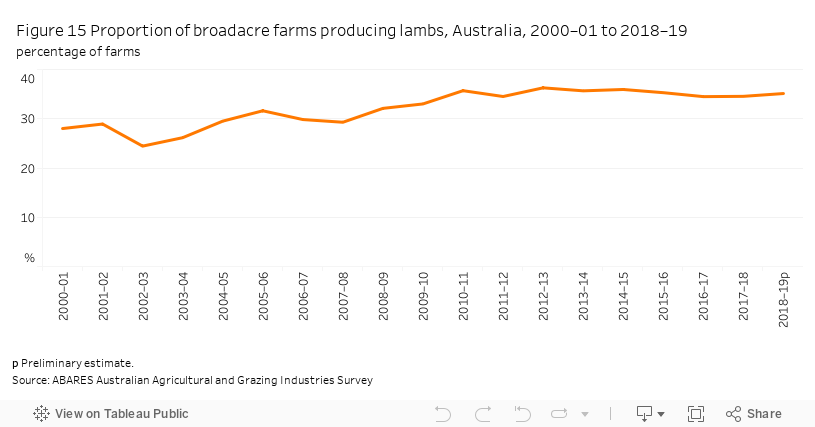
From 2000–01 to 2018–19, the total number of broadacre farms in Australia declined but the proportion of farms producing lambs increased from around 28% to 36% (Figure 15). Many of these new entrants to lamb production were larger mixed enterprise or cropping specialist farms that increased their lamb production in response to higher prices for lambs. As a result of this trend, analysis of change in farm capital over time on lamb-producing farms is dominated by grain enterprises rather than lamb enterprises.
This tableau figure may not meet accessibility requirements. For information about the content of this figure contact ABARES
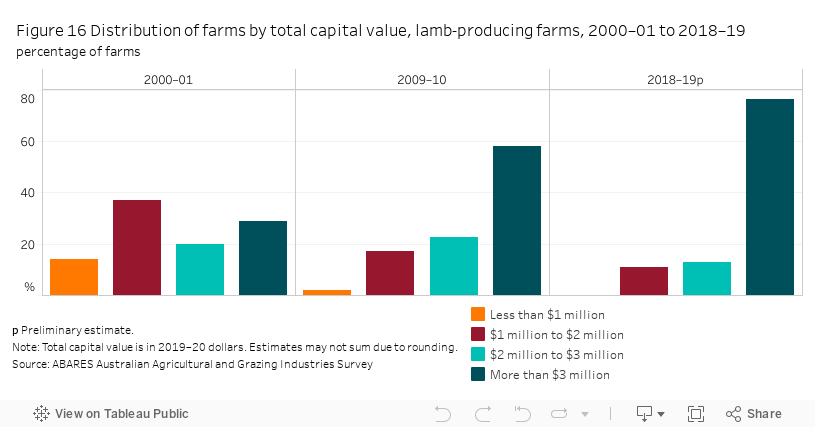
The distribution of farms by asset value has changed substantially over time.From 2000–01 to 2018–19, the proportion of lamb-producing farms with a capital value of less than $3 million in real terms fell substantially, while the proportion of large farms (capital value greater than $3 million) increased significantly (Figure 16).
This tableau figure may not meet accessibility requirements. For information about the content of this figure contact ABARES
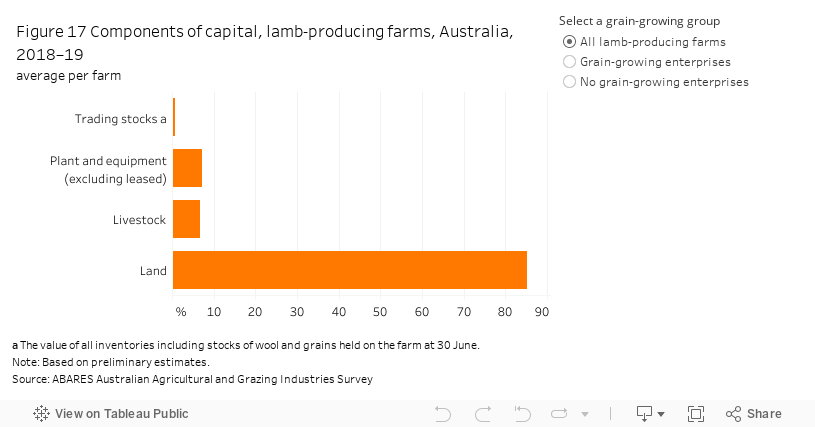
Land accounted for an average of 85% of total capital per farm for lamb-producing farms in 2018–19 (Figure 17). Plant and equipment made up 7% of total capital, livestock a further 7% and trading stocks 1%. The proportion of plant and equipment relative to livestock is higher than might be expected because of the relatively high proportion of lamb-producing farms that also have cropping enterprises.
In 2018–19, plant and equipment made up around 8% of total capital for lamb producers with grain-growing enterprises and around 5% of total capital for lamb producers without grain-growing enterprises. Livestock made up a slightly higher proportion of total capital for lamb producers without grain-growing enterprises (9%), compared to those with grain-growing enterprises (6%).
This tableau figure may not meet accessibility requirements. For information about the content of this figure contact ABARES
New farm investment
Most farmers make new investments each year to add to the existing capital stock or to replace capital items that have reached the end of their useful life. Farm investments are usually made with longer-term outcomes in mind and are based on expected returns over the life of the investment.
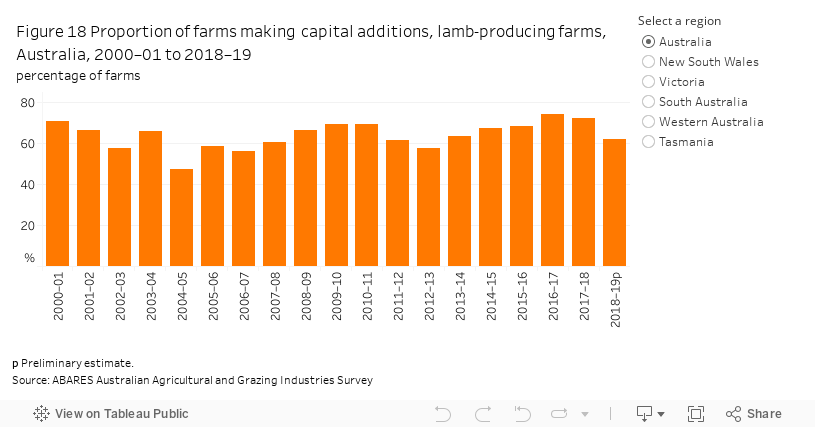
On average, 67% of lamb-producing farms each year made additions to their total capital over the 10 years to 2018–19 (Figure 18). The amount invested each year by those making capital additions fluctuated broadly in line with movements in farm cash incomes. In 2018–19, an estimated 62% of lamb-producing farms made capital additions.
This tableau figure may not meet accessibility requirements. For information about the content of this figure contact ABARES
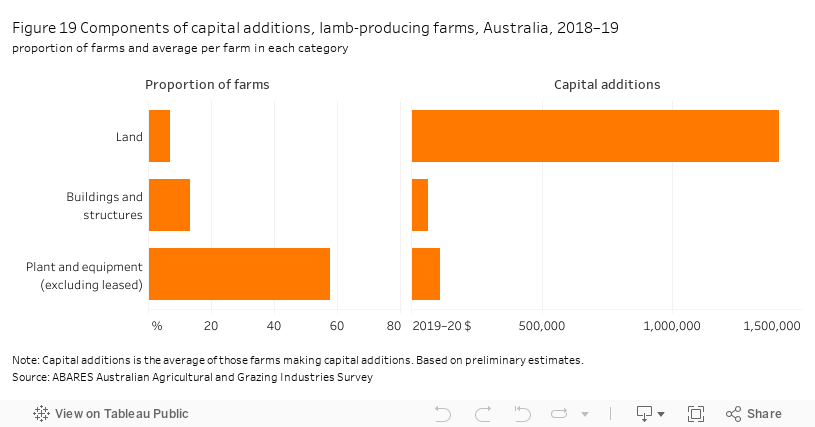
Figure 19 shows the average proportion of lamb-producing farms that made capital additions in 2018–19 and the average capital addition in three categories—land purchases, plant and equipment, and buildings and structures.
Land is the biggest component of capital additions, although only around 7% of lamb producers purchased land in 2018–19. Average expenditure on land for those making purchases was around $1.4 million per farm.
Around 58% of lamb-producing farms made additions to plant and equipment in 2018–19, at an average of around $112,500 per farm. An estimated 13% of farms made additions to buildings and structures, at an average of $66,200 per farm.
This tableau figure may not meet accessibility requirements. For information about the content of this figure contact ABARES
Farm characteristics
Lamb industry
The lamb industry makes an important contribution to the Australian economy. In 2018–19 it accounted for around 7% ($4.2 billion) of the gross value of agricultural production (ABS 2020) and around 6% ($2.8 billion) of agricultural export income.
Since the early 1990s the number of farms producing lambs for slaughter has increased, as has the gross value of lamb production in aggregate and on a per farm basis. Many broadacre farms now rely on income from the sale of lambs for slaughter each year, with varying degrees of specialisation across the industry. Australia’s lamb producing regions are concentrated in the south-east of Australia including Tasmania, Victoria, central and southern New South Wales, south-east South Australia and south-western Western Australia (Map 1).
Total farms and lambs sold
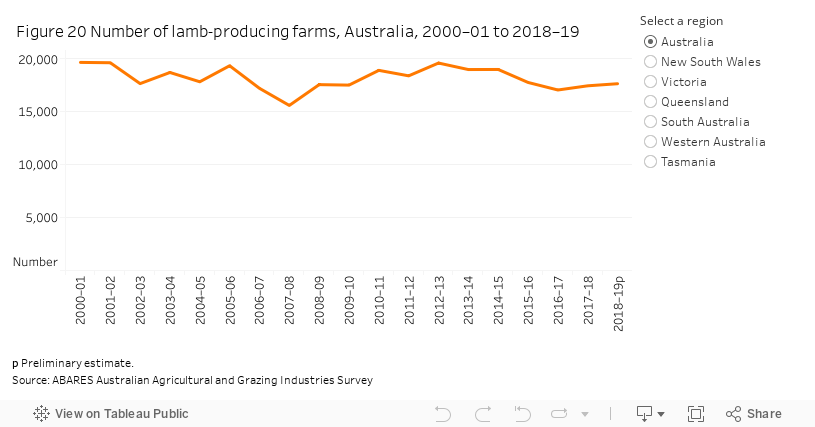
In 2018–19, around 17,700 Australian farms produced at least 200 lambs for slaughter. An estimated 40% of these lamb-producing farms were in New South Wales, 21% in Victoria, 19% in Western Australia, 17% in South Australia and the remaining 3% in Tasmania and Queensland.
From 2000–01 to 2018–19, the total number of Australian farms producing lambs for slaughter fell by 10%. Most of this decline was in Victoria, while Western Australia was the only state with a significant increase in the number of lamb-producing farms (Figure 20).
This tableau figure may not meet accessibility requirements. For information about the content of this figure contact ABARES
Most lamb-producing farms have a diversified mix of enterprises, typically including a combination of wool, lambs, sheep, beef cattle and crops. The vast majority produce wool as a co-product and only a small proportion of farms have slaughter lambs as their only output. This heavily influences the number and characteristics of lamb-producing farms. From the late-1990s, the number of larger grain farms producing lambs for slaughter increased but the number of smaller farms focusing on sheep, lambs and wool production decreased.
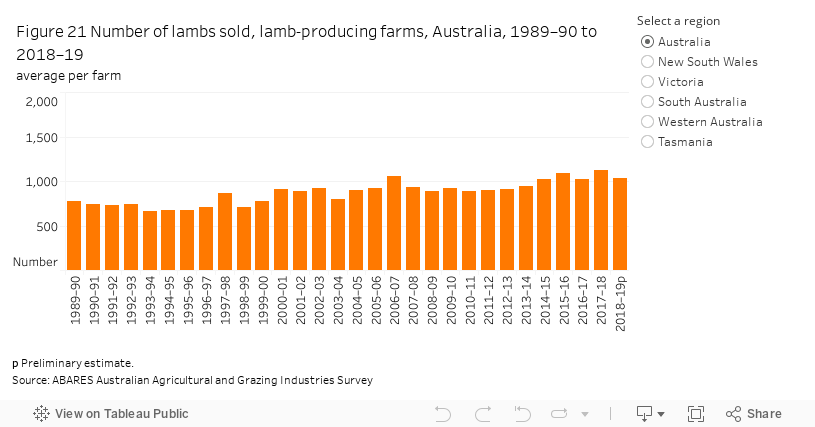
From 1989–90 to 2018–19, total lamb production increased despite declining Australian sheep numbers. A change in the composition of the national sheep flock resulted from increased use of non-Merino and second-cross Merino sheep for meat and wool production, with the total number of lambs sold per farm increasing over the period (Figure 21).
This tableau figure may not meet accessibility requirements. For information about the content of this figure contact ABARES
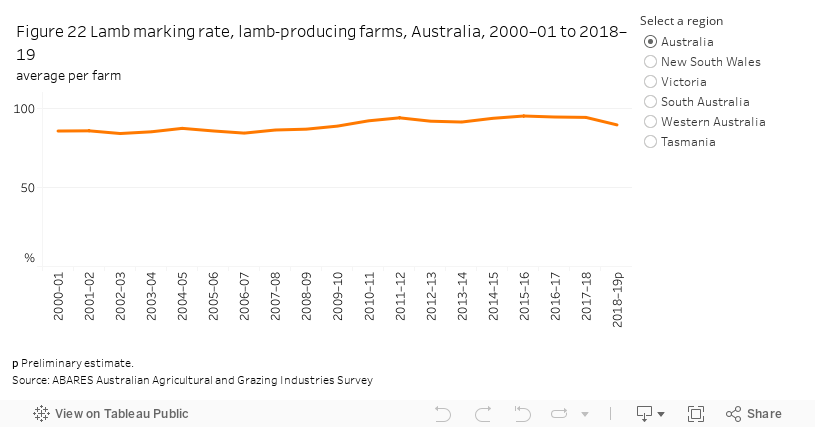
The shift in focus from wool production to lamb production resulted in the average lamb marking rate (lambs marked as a proportion of ewes mated) trending upwards from 86% in 2000–01 to 94% in 2017–18 (Figure 22). Meat-sheep breeds such as Border Leicesters have significantly higher rates of twinning than Merino sheep, meaning greater use of meat-sheep breeds produces more offspring per ewe mated on average. Greater reliance on improved pastures and supplementary feeding to enhance ewe fertility rates have also contributed to rising lamb marking rates. In 2018–19, the average lamb-marking rate declined to 90% due to the effects of drought.
This tableau figure may not meet accessibility requirements. For information about the content of this figure contact ABARES
Trends in physical characteristics by state
From 2009–10 to 2018–19, the share of lamb production by state changed slightly. This reflected relative changes in the regional concentration of lamb-producing farms, higher lamb marking rates, a shift from wool production to lamb production, and increases in the number of lambs sold for slaughter. In 2018–19, New South Wales accounted for 40% of the number of lambs sold for slaughter, followed by Victoria (19%), South Australia (18%), Western Australia (17%) and Tasmania (4%).
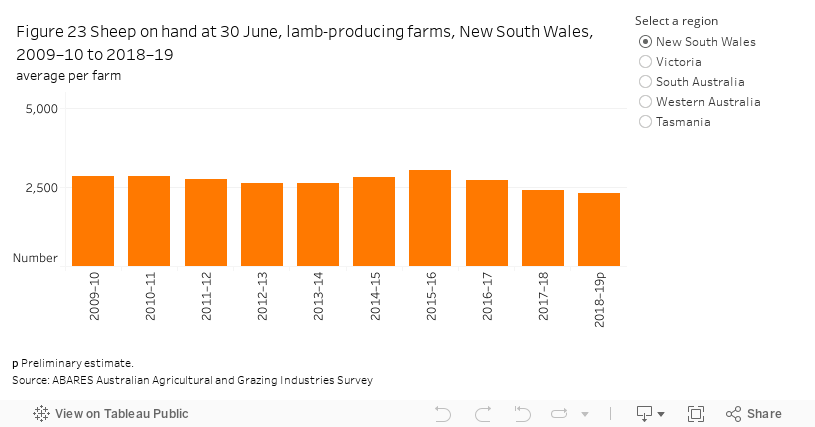
Changes in flock sizes have not been uniform across all states. From 2009–10 to 2018–19, average flock sizes increased in Victoria and South Australia (Figure 23). In New South Wales, Western Australia and Tasmania, average flock sizes decreased in recent years, largely in response to drought.
This tableau figure may not meet accessibility requirements. For information about the content of this figure contact ABARES
The demographics of sheep flocks have changed in most states since the 1990s, with fewer wethers and more ewes and lambs on hand at 30 June. The proportion of lambs to total sheep increased in New South Wales, Victoria, South Australia and Western Australia from 2009–10 to 2016–17 (Figure 24). The increase in the number of lambs on hand at 30 June also reflects changes in lambing patterns, including an increase in the proportion of autumn lambing.
Lambing patterns tend to vary by region and producers adjust them to suit the availability of feed. The breed of lamb influences how long an animal is kept and how long it takes to reach a saleable weight. Market conditions also affect flock composition at 30 June because farmers often hold lambs longer when prices are higher to maximise sale weight.

This tableau figure may not meet accessibility requirements. For information about the content of this figure contact ABARES
Physical characteristics by scale of lamb production
In 2018–19, medium (500 to 2,000 lambs sold) farms represented 51% of all lamb-producing farms and accounted for 54% of total lamb production (Table 9). Large (2,000 to 4,000 lambs sold) and very large (more than 4,000 lambs sold) farms represented 9% of lamb-producing farms and accounted for 31% of total lambs sold.
Note: Based on preliminary estimates.
Source: ABARES Australian Agricultural and Grazing Industries Survey
In 2018–19, lamb marking rates ranged from 82% on small farms to 95% on very large farms (Table 10). Higher lamb marking rates on larger lamb-producing farms reflects a range of factors including management decisions, feed availability and flock structure. Larger lamb-producing farms operate larger areas and have a more diverse enterprise mix on average than smaller farms. Larger farms also have higher turn-on and turn-off rates than smaller lamb-producing farms.
Note: Based on preliminary estimates.
Source: ABARES Australian Agricultural and Grazing Industries Survey
Cost sheep production
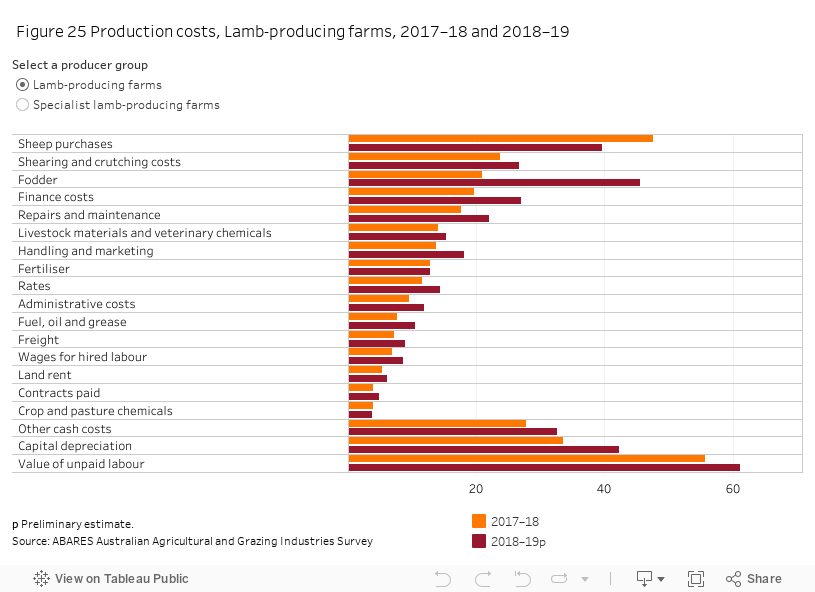
In 2018–19, the average cost of sheep production (measured per kilogram of live weight – see Box 2 for description of method) increased by 69 cents from the previous year for lamb-producing farms (Table 11). Much of the increase in cost of production between 2017–18 and 2018–19 was the result of increased expenditure on fodder due to continuing dry seasonal conditions in south-eastern Australia and high prices for feed-grains and hay. Lamb-producing farms increased expenditure on fodder by 25 cents per kilogram live weight from 2017–18 to 2018–19 (Figure 25).
For specialist lamb-producing farms (farms with greater than 50% of receipts from lambs), the average per kilogram live weight cost of sheep production increased by 29 cents in 2018–19. Expenditure on most cost items increased, with fodder costs increasing by 16 cents per kilogram live weight, but this was partially offset by reductions in sheep purchases and the value of unpaid family labour (Figure 25).
p Preliminary estimate.
Note: Specialist lamb-producing farms are defined as having greater than 50% of receipts from lambs. Figures in parentheses are standard errors expressed as a percentage of the estimate. Estimates have been rounded to the nearest whole number and are presented in 2019–20 dollars.
Source: ABARES Australian Agricultural and Grazing Industries Survey
This tableau figure may not meet accessibility requirements. For information about the content of this figure contact ABARES
Box 2 Calculation of the per kilogram live weight cost of sheep production
The Australian Agricultural and Grazing Industries Survey of Australian broadacre farms collects detailed financial, physical and production data. ABARES included additional questions in the 2007–08, 2008–09 and 2012–13 to 2018–19 surveys so it could calculate the per kilogram live weight cost of beef cattle and sheep production.
These additional questions covered the live weight of cattle, calves, sheep and lambs sold or transferred off-farm and the proportion of key variable costs attributable to beef, sheep and cropping enterprises on mixed enterprise farms. Key variable costs included crop and pasture chemicals, fertiliser, fodder, fuel, repairs and maintenance, contracts paid, veterinary and livestock materials, and hired and family labour.
Fixed (overhead) costs such as accountancy, telephone, insurance and capital depreciation were attributed to enterprises on the basis of their share of total farm cash receipts.
ABARES calculated total live weight of sheep production as the total live weight sold and transferred off-farm, adjusting for changes in total live weight of the flock at the beginning and end of each financial year. Total live weight of the flock at the beginning and end of each financial year was calculated by applying average live weights to the categories of sheep on hand (ewes, lambs, wethers and rams) at the beginning and end of each financial year.
Per kilogram live weight costs of production were calculated by dividing the sheep enterprise share of costs by the total live weight of sheep produced. The methodology used did not disaggregate wool production costs from sheep and lamb production costs.
Operating margins
In this context, operating margins are defined as the difference between per-kilogram prices received and the cost of production.
For lamb-producing farms, operating margins averaged 89 cents per kilogram live weight produced in 2017‒18, then declined to 66 cents per kilogram in 2018‒19 (Figure 26). Despite increased cost of production, continued high prices for lambs and sheep helped prevent operating margins from declining further.
For all sheep producers, operating margins averaged 106 cents per kilogram live weight in 2017‒18, then declined to 77 cents per kilogram in 2018‒19. From 2016–17 to 2018‒19, margins for all sheep producers exceeded those for lamb-producing farms as prices received for wool increased by more than prices received for lamb.

This tableau figure may not meet accessibility requirements. For information about the content of this figure contact ABARES
Cost of sheep production by size
The on-farm costs of sheep production vary across farm businesses depending on size, enterprise mix, the farm’s location, the quality of farm management and climatic and other production conditions during the year.
Over the three years to 2018–19, the total cost of production for the smallest lamb-producing farms (200 to 500 lambs sold) averaged 441 cents per kilogram, compared with 319 cents per kilogram for the largest lamb-producing farms (more than 2,000 lambs sold). As production scale increased, cash costs of production rose slightly, but capital depreciation and the value of unpaid operator and partner labour declined substantially (Table 12).
Note: Figures in parentheses are standard errors expressed as a percentage of the estimate. Estimates have been rounded to the nearest whole number and are presented in 2019–20 dollars.
Source: ABARES Australian Agricultural and Grazing Industries Survey
In the short term, to continue operating an enterprise, farm businesses need to generate only sufficient receipts to cover cash operating costs. This enables them to avoid drawing on receipts from other enterprises or borrowing or using financial assets to cover cash shortfalls.
Over a longer period, farm businesses need to replace farm capital (such as vehicles, machinery, plant, sheds and fencing) to maintain productivity as capital wears out. This cost is mostly captured in capital depreciation, but repairs and maintenance included in cash costs also include replacement and upgrading of some farm capital. Farms often vary their expenditure on capital items depending on need, available cash flow and access to finance. In some years farms invest more than the calculated depreciation and in other years much less. A farm business that continually invests less than the calculated depreciation will lose production capacity over the medium to long term.
ABARES includes the value of unpaid labour in its measurement of farm financial performance. Valuation of this labour input enables ABARES to compare the performance of all farm businesses equally regardless of the (paid or unpaid) labour arrangements in place. Valuation of unpaid labour also captures the requirement for the farm’s operators to receive a fair return for their labour input. ABARES values unpaid labour inputs at standard industry award wage rates.
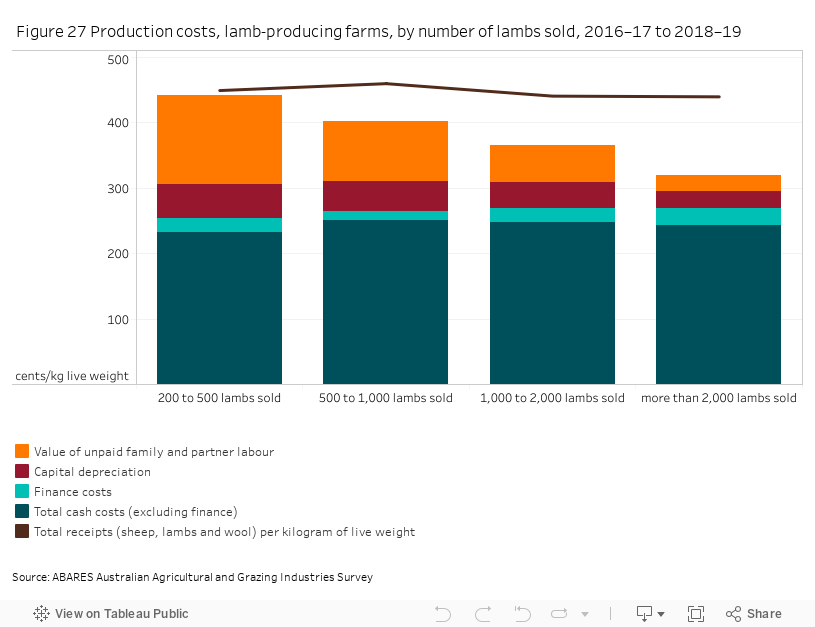
From 2016‒17 to 2018‒19, operating margins for lamb producers at all scales of operation were positive on average, even when accounting for the value of unpaid owner–manager, partner and other family labour (Figure 27). A large amount of unpaid labour is used in family-operated sheep-producing farms, particularly smaller farms.
Operating margins increased as the scale of lamb production increased. Over the three years to 2018‒19, operating margins after accounting for all costs averaged 7 cents per kilogram for farms selling 200 to 500 lambs for slaughter and increased to 120 cents per kilogram for farms selling more than 2,000 lambs.
This tableau figure may not meet accessibility requirements. For information about the content of this figure contact ABARES
These results suggest significant economies of scale in the sheep meat industry. Economies of scale for sheep producers mainly arise from greater efficiency in the use of farm capital and labour as the scale of the sheep enterprise increases. Generally, increases in the scale of sheep enterprises bring only small reductions in cash operating costs per kilogram in both variable and fixed cash costs (overhead costs such as administrative costs, insurance and rates).
Cost of sheep production by state
The total cost of sheep production varied across the states over the three years to 2018–19, due in part to differences in seasonal conditions. New South Wales had the highest cost of production per live weight and the lowest operating margin over the period (Table 13). Tasmania had the lowest cost of production and the highest margin over the three years to 2018–19, partly due to a lower value of unpaid family labour than the other states.
Note: Figures in parentheses are standard errors expressed as a percentage of the estimate. Estimates have been rounded to the nearest whole number and are presented in 2019–20 dollars.
Source: ABARES Australian Agricultural and Grazing Industries Survey
Productivity
Agricultural productivity estimates are available for the sheep industry.
References
ABS 2020a, Agricultural commodities, Australia, 2018–19, cat. no. 7121.0 Australian Bureau of Statistics, Canberra, accessed 29 May 2020.
ABS 2020b, Value of agricultural commodities produced, Australia, 2018–19, cat. no. 7503.0 Australian Bureau of Statistics, Canberra, accessed 29 May 2020.
Rural Bank 2020, Australian Farmland Values 2020 report, Rural Bank, Adelaide, accessed 23 July 2020.
Data and other resources
Beef, lamb and sheep industries data
A large selection of ABARES farm survey data on the beef, slaughter lambs and sheep industries
See our previous research page for previous versions of the report Australian lamb: financial performance of lamb-producing farms.
Farm surveys definitions and methods
Further information about our survey definitions and methods.
Farm performance: broadacre and dairy farms
This web report provides a detailed profile of the financial performance of farm businesses in the grains, livestock and dairy industries in the years 2017–18 to 2019–20.