Authors: Tim Westwood, Rhys Downham, John Walsh and Mihir Gupta
Data visualisation
Source: ABARES
The PowerBI dashboard may not meet accessibility requirements. For information about the contents of these dashboards contact ABARES.
Summary
The purpose of this report is to provide forecasts for water allocation prices and irrigation activity in the southern Murray–Darling Basin (sMDB) for the year ahead (2022–23). Prices are forecast under four representative scenarios aligned with state water agency allocation outlooks: ‘extreme dry’, ‘dry’, ‘average’ and ‘wet’. A summary of current market conditions in 2021–22 is provided as context for the likely market outcomes in 2022–23.
ABARES considers the wet scenario to be most likely for 2022–23, based on the latest climate outlook from the BOM. The forecasts presented in this report are based on the latest data from the BOM and state water agencies, and changes in the underlying data will result in changes to the forecasts. Readers should consult the BOM and state water agency websites to keep up to date with the latest outlook for seasonal conditions and water supply.
| 2021–22 | Extreme dry | Dry | Average | Wet |
|---|---|---|---|---|
| $77 | $171 | $146 | $99 | $58 |
Water prices are forecast to remain low for a third consecutive year
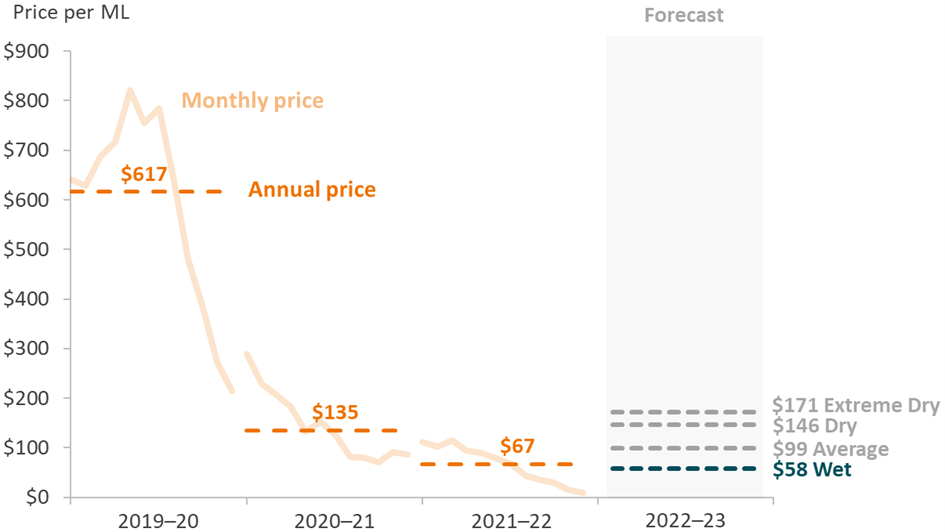
The annual average water allocation price in the sMDB is forecast to decrease from $67 per ML in 2021–22 to $58 per ML in 2022–23 in the wet scenario. In all scenarios the price is forecast to remain well below the annual average of $617 per ML during the last drought in 2019–20.
The difference in prices across the forecast scenarios for 2022–23 is small, with only a $113 per ML difference between the wet and extreme dry scenarios. This reflects the highly favourable water supply and seasonal conditions forecast for 2022–23.
Exceptional outlook for 2022-23 with wet conditions likely to continue
Favourable weather conditions are forecast to continue in 2022–23 and will help to keep water prices low. La Niña conditions have dissipated at the start of 2022–23, but there is a 50% chance of it re-forming in spring 2022. If La Niña re-forms, conditions are likely to be even wetter than forecast in the wet scenario.
The continuation of wet conditions would mark the third consecutive year of excellent seasonal conditions for irrigated agriculture. The allocation outlook is exceptional and the volume of carryover water available is the highest in a decade. As a result, there is a high degree of certainty around the volume of water expected to be available in 2022–23. This will support the planting decisions made by irrigators as well as providing flexibility in water management strategies.
Water availability was high across the southern Basin
The volume of water available for irrigation in the southern Murray–Darling Basin (sMDB) in 2021–22 was the highest since 2012–13. Water allocation prices decreased to a nine–year low, with an average annual price of $67 per ML across the sMDB.
Back–to–back La Niña events have led to consecutive years of above average rainfall, recharging storages and supporting high allocations across all major entitlements.
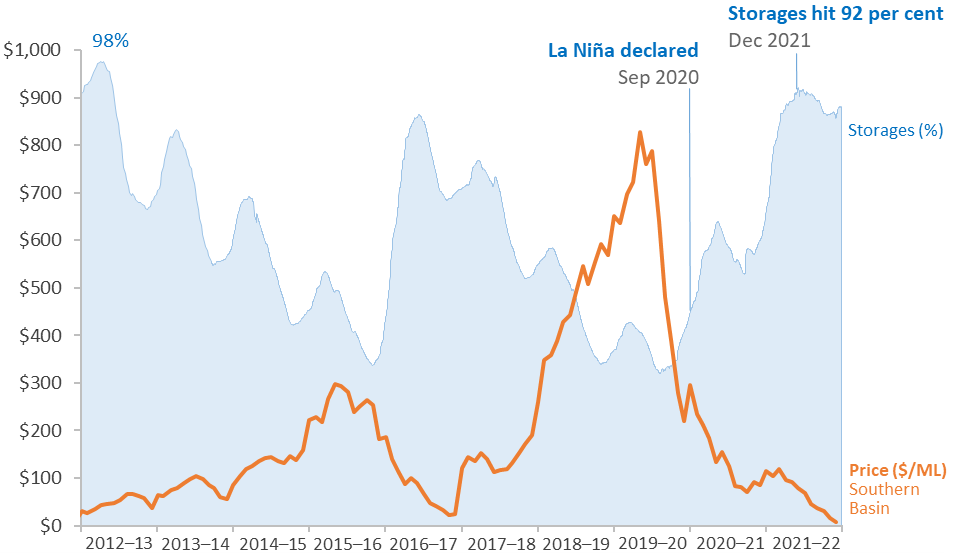
Water storages in the MDB peaked at 92%, the highest since 2012–13
The continued improvement in water availability throughout 2021–22 was reflected in allocation prices. The average sMDB price fell from $115 per ML in July 2021 to $9 per ML in June 2022 (Figure 1), with prices in the Murrumbidgee and the NSW Murray above the Barmah Choke sinking as low $1 per ML.
Figure 1 Water storages and average price in the MDB, 2012-13 to 2021-22
Note: Dam storages are reported for the Murray–Darling Basin as a percentage of total capacity. Price is volume weighted average for the southern Murray–Darling Basin in 2021–22 dollars.
Carryover balances have been replenished
The formation of La Niña conditions at the beginning of 2020–21 and the increase in rainfall, meant that irrigators were less reliant on water allocations. This allowed irrigators to rebuild carryover reserves, which had been drawn down during 2019–20. The volume of unused water at the end of 2021–22 carried over into 2022–23 was the highest volume in a decade.
Allocations increased throughout the year
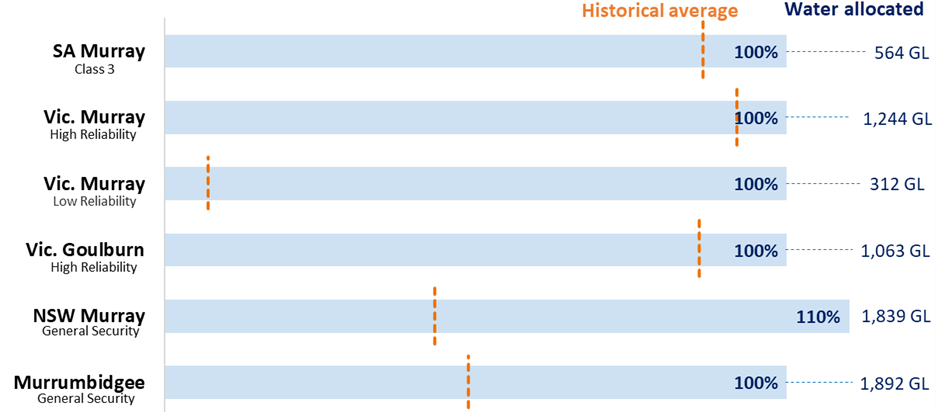
Opening allocations in 2021–22 were above the historical average for all major entitlements. Allocations steadily increased throughout the year as storages continued to rise. By the end of 2021–22 all major entitlements across the sMDB were at full allocations (Figure 2). Victorian Murray low reliability entitlements received 100% allocation for the first time since they were established in 2006–07 (NVRM 2022b).
Figure 2 Closing allocations for major entitlements in 2021–22
Note: Historical average of closing allocations calculated over the 20–year period from 2002–03 to 2021–22, except Victorian Murray low reliability entitlements which are calculated from their inception in 2006–07.
Wet conditions provided opportunities for cotton and rice
Significant carryover balances, coupled with rainfall at the beginning of 2021–22 provided a boost to on and off–farm water storages, in time to support plantings of irrigated cotton and rice (ABARES 2022b). General security allocations in the NSW Murrumbidgee had already reached 100% by 1 November 2021, supporting cotton and rice irrigators in their planting decisions for the summer of 2021–22.
The area planted to irrigated cotton in the sMDB in 2021–22 was the highest on record and the area planted to rice was the highest since 2016–17.
The value of cotton production hit a record high in 2021–22 supported by the strongest export prices in a decade (ABARES 2022b). Rice production rebounded strongly from a low of 45,000 paddy tonnes in 2019–20 up to 675,000 paddy tonnes in 2021–22 (SunRice 2022a).
Inter-valley trade still a watchpoint
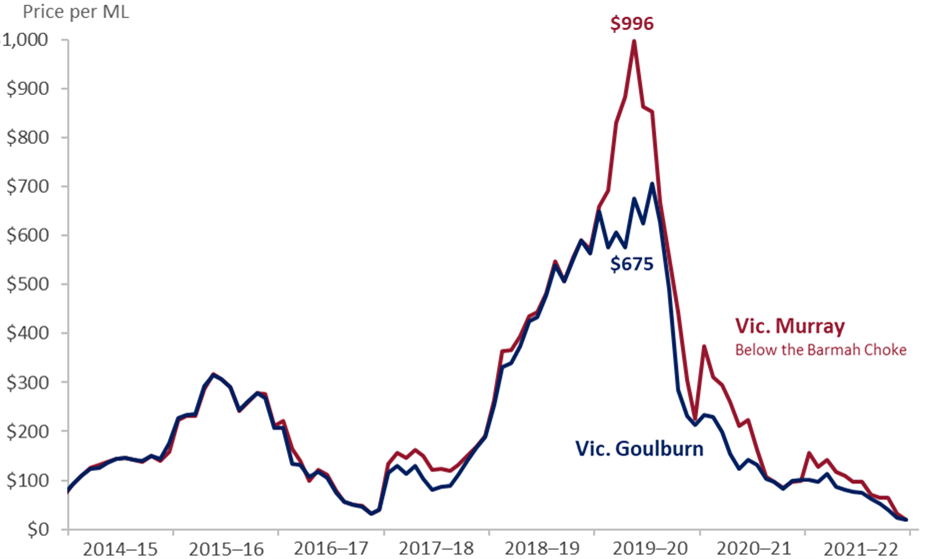
Overall, inter–valley trade (IVT) rules continued to limit trade in 2021–22, resulting in price gaps between regions. However, with a return to wetter conditions, the magnitude of these gaps was much smaller – for instance, the average annual price was $70 per ML in the Goulburn compared to $91 per ML in the Victorian Murray below the Barmah Choke (Figure 3).
The limited hydrological capacity to move water through the Barmah Choke continues to affect prices in the connected southern basin water market. Regions below the Barmah Choke have a high proportion of water intensive permanent plantings (such as almonds and fruit trees), compared to regions above the choke which have a high proportion of opportunistic crops (such as rice, cotton and pastures). These differences in cropping mix create demand pressures to move water through the choke. The Murray–Darling Basin Authority and basin states are actively exploring options to maintain and where possible improve capacity through the Barmah Choke (MDBA 2021).
Trade from the Goulburn to the Murray now operates on a more certain delivery schedule designed by Vic. DELWP (DELWP 2022a). While these changes provide more certainty and transparency to irrigators, the operation under a broader range of seasonal conditions remains to be seen.
It has become clear in recent years that, regardless of seasonal conditions, access to trade opportunities is highly competitive. While 2022–23 is shaping up to be a wet year with high water availability, on 1 July 2022, over 80 GL of trade opportunity from the Goulburn to Murray and over 40 GL through the Barmah Choke (upstream to downstream), was quickly allotted. As of 15 July 2022, all the major trade limits are closed (MDBA 2022, DELWP 2022b, WaterNSW 2022).
Figure 3 Price gaps between the Victorian Goulburn and Murray continued in 2021–22
Note: Prices reported in 2021–22 dollars.
ABARES has developed scenarios for water availability in 2022–23 that draw upon the latest allocation outlooks from state water agencies (as at 15 July 2022). Four representative scenarios are considered—‘extreme dry’, ‘dry’, ‘average’ and ‘wet’—that align with the allocation outlooks published by state water agencies (NSW DPIE, NVRM and SA DEW). ABARES uses these allocation forecasts and opening carryover (excluding environmental water) to determine the volume of water available in 2022–23 for irrigation in the southern Murray–Darling Basin (sMDB) under each scenario. See Appendix A for more details.
The scenarios are indicative only, and conditions could be better or worse than forecast, which would in turn affect prices. Readers should consult state water agency forecasts and BOM climate outlooks throughout the year to inform their decisions.
Wet scenario considered most likely in 2022–23
It is increasingly likely that a negative Indian Ocean Dipole (IOD) event will develop during winter and La Niña conditions have a 50% chance of re–forming in spring 2022 (BOM 2022a). These climate drivers indicate the wet scenario is most likely in 2022–23 (BOM 2022b), which is a significant change from previous climate outlooks that indicated the average scenario was most likely (ABARES Water Market Outlook: April 2022). However, all four outlook scenarios are discussed in each edition of the Water Market Outlook to provide consistent information on the effects of different seasonal conditions and related on–farm decisions such as carryover and irrigation water use.
The likely wet scenario provides a favourable outlook for irrigators, with above average rainfall and allocations forecast to bolster irrigated crop production. However, there are some potential downsides to wet conditions.
Exceptional rainfall towards the end of 2021–22 has affected the production of some irrigated crops (such as almonds, cotton, fruit and vegetables) by delaying harvest and reducing crop potential (Fresh Plaza 2022, ABC 2022a, ABC 2022b). There is a risk that production in 2022–23 may be affected by heavy rainfall and localised floods hampering access to farms and affecting planting and harvest activities.
See ABARES Seasonal conditions: June quarter 2022 for further information regarding the climate outlook for 2022–23.
Allocation forecasts are well above historical averages
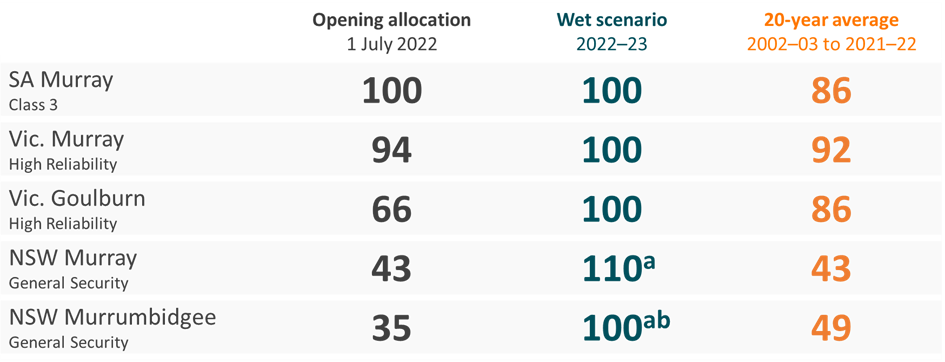
Most of the major entitlements in the sMDB are forecast to receive 100% allocations in 2022–23 in the wet scenario (Figure 4). High allocations are forecast in all scenarios (Table A5) – even in the extreme dry scenario (100% for the Victorian Murray and 78% for the Goulburn).
These outlooks are further supported by exceptional opening allocations on 1 July, with most major entitlements receiving more than double the 20-year opening average. For example, Victorian Murray high reliability entitlements received 94% allocation (the highest opening since 2002–03) and Goulburn high reliability entitlements received 66%.
The outlook for Murrumbidgee general security allocations is less favourable at 52% in the average scenario (NSW does not provide a wet scenario forecast, see footnote Figure 4). However, it’s worth noting that NSW allocation outlooks only go out to November 2022 and Murrumbidgee allocations may increase further in the second half of 2022–23 (with NSW DPIE noting the possibility of additional allocations if certain conditions are met – see Appendix A).
Figure 4 Water allocation scenario for 2022–23
Note: Entitlement type refers to general and high security entitlements in NSW.
a Forecast includes allocations and carryover. The general security account limit for NSW Murray and for NSW Murrumbidgee is 110% and 100% of entitlements on issue respectively.
b Based on indicative analysis of past outlooks and realised seasonal conditions, ABARES has assumed that allocations for 2022–23 would be around 25 percentage points higher than the NSW average scenario if wet conditions were realised. Carryover balances are very high at 28% of entitlements on issue, which means that water available in the NSW Murrumbidgee is automatically set to 100% after the assumed 25% increase from the average scenario.
High water availability reflects seasonal conditions
Water availability in 2022–23 will be supported by high allocations, large volumes of water carried over from 2021–22 and the likely continuation of wet seasonal conditions. The relatively small difference in water availability between the scenarios in 2022–23 reflects higher than usual certainty in the state water allocation forecasts.
The timing of water availability is also an important consideration for irrigators. High water supply at the beginning of 2022–23 from exceptional opening allocations and high carryover balances from 2021–22 will provide irrigators greater confidence in their annual crop planting decisions.
Water prices are forecast to remain low in 2022–23
Water allocation prices are forecast to remain low for a third consecutive year in 2022–23 (Figure 5). The weighted average sMDB price in the wet scenario is forecast to decrease from $67 per ML in 2021–22 to $58 per ML in 2022–23. Prices are forecast to increase in all other scenarios but remain low compared to historical average prices.
The difference in prices across the forecast scenarios for 2022–23 is small, with only a $113 per ML difference between the wet and extreme dry scenarios. This reflects the highly favourable and certain water supply and seasonal conditions forecast for 2022–23.
The forecast prices are modelled estimates of the average annual price for 2022–23. In practice, prices are expected to fluctuate throughout the year around the annual average price. ABARES has also produced a dashboard visualisation to accompany this report, which presents the price forecasts for each region in the sMDB.
Regional differences in water prices are forecast for 2022–23 as IVT limits continue to affect water market outcomes in the sMDB. However, as wet conditions are likely, the magnitude of these price gaps is forecast to remain small (Table A2).
Figure 5 Water allocation price scenarios, sMDB average, 2019–20 to 2022–23
Note: Water prices in 2021–22 dollars.
Production boosted by high water availability and low prices
Almond production is forecast to increase in 2022–23, as almond trees continue to mature and increase yields (Table 1). However, there is a risk that almond production could be lower than forecast due to pollination delays caused by restrictions on the transport of commercial honey bees. An incursion of the Varroa mite (the most serious pest of commercial honey bees) was detected in NSW in June 2022 (NSW DPI 2022b) and emergency biosecurity isolation zones were established (NSW DPI 2022a).
Cotton production is forecast to decrease in 2022–23 in all scenarios. The decrease in cotton production is largely driven by a forecast 20% decrease in cotton prices, and higher water prices in the NSW Murrumbidgee.
Rice production is also forecast to decrease in 2022–23 in all scenarios, following an exceptional year in 2021–22. Forecast higher water prices in the NSW Murrumbidgee is the major driver of lower rice production volumes as most rice is grown in this region.
| Industry | 2021–22 modelled (tonnes) | Extreme dry (tonnes) | Dry (tonnes) | Average (tonnes) | Wet (tonnes) |
|---|---|---|---|---|---|
| Almonds | 109,401 | 117,046 | 117,046 | 117,046 | 117,046 |
| Cotton | 139,329 | 85,133 | 87,097 | 93,929 | 98,930 |
| Rice | 675,000 | 337,173 | 369,369 | 491,282 | 647,552 |
Source: ABARES, ABS, Cotton Australia and SunRice
Note: Modelled production in 2021–22 for cotton and rice is exogenous and incorporates the best available information. Rice production reported in paddy tonnes.
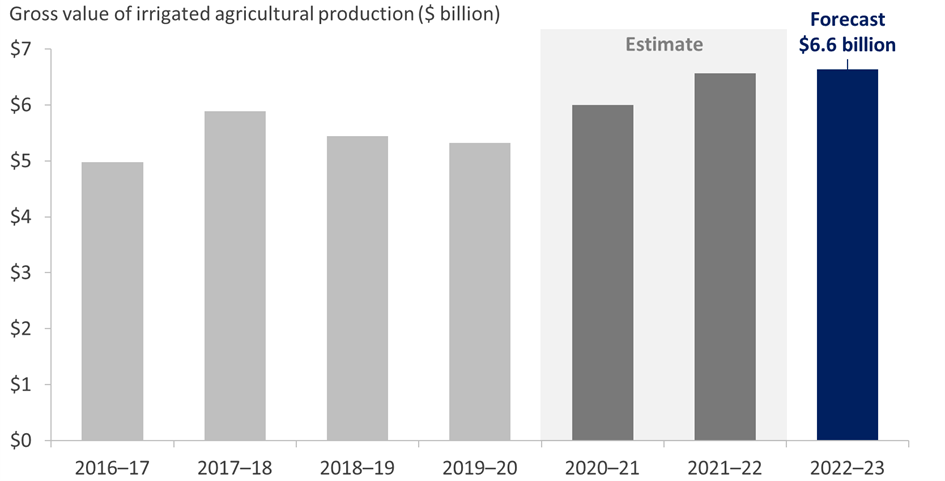
Total gross value of irrigated agricultural production (GVIAP) in the sMDB is forecast to remain around $6.6 billion in 2022–23 under the wet scenario (Figure 6).
GVIAP for almonds is forecast to grow by 18% in 2022–23 as both production and almond prices are forecast to increase. In contrast, cotton GVIAP is forecast to decrease by 45% from a record high in 2021–22, driven by a significant reduction in production and cotton prices.
Figure 6 Gross value of irrigated agricultural production in the sMDB, 2016–17 to 2022–23
Note: GVIAP estimates do not include nursery production and are therefore not comparable to ABS estimates. Values in 2021–22 dollars.
Outlook scenarios
ABARES designed four outlook scenarios for 2022–23 (Table A1). Outlook scenarios released by the states remain indicative only. Actual water allocations will depend on realised seasonal conditions. Outlook scenarios are also subject to updates throughout the year.
As shown in Table A1, the definition of outlook scenarios and the level of information provided varies by state water agency. The ABARES outlook scenarios are largely based on those used by the Northern Victoria Resource Manager (NVRM). Outlook scenarios from other states were matched against the ABARES scenario definitions.
| ABARES scenario | NVRM scenario | SA DEW scenario | NSW DPIE scenario |
|---|---|---|---|
| Extreme dry In 99 years out of 100, inflows to storages exceed those experienced in this scenario. Rainfall is in the 1st percentile of historical levels. |
Extreme dry Inflow volumes to storages that are greater in 99 years out of 100. |
Exceptionally dry 99% likelihood that actual allocations will exceed allocation forecast |
Extreme 99 chances in 100 of exceeding the allocation forecast |
| Dry In 90 years out of 100, inflows to storages exceed those experienced in this scenario. Rainfall is in the 10th percentile of historical levels. |
Dry Inflow volumes to storages that are greater in 90 years out of 100. |
Very Dry 90% likelihood that actual allocations will exceed allocation forecast |
Very Dry 9 chances in 10 of exceeding the allocation forecast |
| Average In 50 years out of 100, inflows to storages exceed those experienced in this scenario. Rainfall is in the 50th percentile of historical levels. |
Average Inflow volumes to storages that are greater in 50 years out of 100. |
Average 50% likelihood that actual allocations will exceed allocation forecast |
Average 1 chance in 2 of exceeding the allocation forecast |
| Wet In 10 years out of 100, inflows to storages exceed those experienced in this scenario. Rainfall is in the 90th percentile of historical levels. |
Wet Inflow volumes to storages that are greater in 10 years out of 100. |
Wet 25% likelihood that actual allocations will exceed allocation forecast |
Wet ABARES has assumed this value. |
Source: ABARES, NVRM, SA DEW and NSW DPIE
Note: Allocation forecasts made by NVRM are created using a model of historical inflow volumes, and the chance that actual inflows will be higher than those presented. The wet scenario defined by SA DEW uses a higher likelihood measure, meaning this is a drier scenario than the wet scenario used by ABARES and defined by NVRM.
The scenarios describe four potential outcomes for the volume of water available for irrigation use in the sMDB in 2022–23. In each scenario, the aggregate demand for irrigation water is assumed to be the same as 2021–22 levels. Therefore, prices in each scenario are primarily influenced by seasonal conditions, the volume of water available (which is affected by allocations and carryover), rainfall (which affects crop watering requirements) and trade limits that restrict the flow of water between regions.
Murrumbidgee allocations could be 5% higher if certain conditions are met
When water physically spills from Murrumbidgee storages, NSW water managers must decide whether to spill or retain the inter–valley trade (IVT) balance (water owed to the NSW Murray). This decision is based on the difference in water availability between the NSW Murray and Murrumbidgee around the time of the physical water spill.
- A decision to spill the Murrumbidgee IVT balance is likely when Murrumbidgee allocations are significantly lower than NSW Murray allocations. What this means for irrigators is typically an increase in Murrumbidgee allocations for the year. Since NSW Murray general security allocations are already forecast to reach 110% (including carryover) in the average and wet scenarios, an IVT spill is more likely and NSW has indicated that Murrumbidgee general security allocations could increase by 3-5 percentage points if this happens in 2022–23 (see NSW Murrumbidgee Valley water allocation statement: 15 July 2022).
- A decision to retain the Murrumbidgee IVT balance (despite a physical water spill from Murrumbidgee storages) is likely when Murrumbidgee allocations are similar or higher than NSW Murray allocations. This typically means spilling Murrumbidgee water and preventing a loss of water owed to NSW Murray irrigators.
Water allocation price scenarios
Table A2 shows annual average water allocation prices in 2021–22 and ABARES forecasts for 2022–23.
| Region | 2021–22 average ($/ML) | Extreme dry ($/ML) | Dry ($/ML) | Average ($/ML) | Wet ($/ML) |
|---|---|---|---|---|---|
| NSW Murrumbidgee | 53 | 199 | 180 | 113 | 67 |
| NSW Murray Above | 57 | 177 | 151 | 94 | 53 |
| VIC Murray Below | 91 | 180 | 155 | 113 | 67 |
| Northern Victoria | 70 | 121 | 90 | 58 | 32 |
| SA Murray | 99 | 180 | 155 | 113 | 67 |
| Weighted sMDB average | 67 | 171 | 146 | 99 | 58 |
Source: ABARES, BOM, Waterflow
Note: Water prices in 2021–22 dollars. Northern Victoria comprises the Goulburn, Broken, Loddon and Campaspe regions.
Rainfall scenarios
Table A3 shows the amount of rainfall for 2021–22 and ABARES forecasts for 2022–23. Scenario forecasts for 2022–23 by region were calculated as a percentile of historical annual rainfall between 1990–91 and 2019–20.
| Industry | 2021–22 (mm) | Extreme dry (mm) | Dry (mm) | Average (mm) | Wet (mm) |
|---|---|---|---|---|---|
| NSW Murrumbidgee | 522.6 | 191.8 | 221.8 | 297.3 | 463.7 |
| NSW Murray Above | 417.2 | 191.9 | 220.3 | 296.1 | 443.4 |
| NSW Murray Below | 346.8 | 160.3 | 174.6 | 248.5 | 389.7 |
| NSW Lower Darling | 310.9 | 124.0 | 137.4 | 187.2 | 311.6 |
| VIC Murray Above | 635.5 | 261.6 | 347.8 | 467.0 | 642.3 |
| VIC Murray Below | 318.2 | 143.6 | 162.4 | 216.6 | 349.5 |
| VIC Goulburn–Broken | 454.0 | 238.9 | 265.8 | 357.9 | 527.3 |
| VIC Loddon–Campaspe | 452.9 | 233.1 | 267.5 | 360.9 | 511.3 |
| SA Murray | 217.7 | 145.6 | 168.1 | 214.1 | 324.0 |
Source: BOM
Carryover scenarios
Table A4 shows an estimate of the volume of water carried over into 2022–23 and ABARES forecasts for carryover in 2023–24. Carryover is modelled based on forecasts for rainfall, entitlements on issue and allocations, along with state–based carryover rules. Included in ABARES forecasts are modelled irrigator expectations around climate in 2022–23 (see Hughes et al. 2021 for more details).
| Industry | Carryover into 2023–24 | ||||
|---|---|---|---|---|---|
| Carryover into 2022–23 (ML) | Extreme dry (ML) | Dry (ML) | Average (ML) | Wet (ML) | |
| NSW Murrumbidgee | 525,494 | 399,874 | 377,438 | 520,126 | 567,599 |
| Above the Barmah Choke | 822,599 | 426,782 | 451,108 | 590,117 | 722,524 |
| Below the Barmah Choke | 623,892 | 398,348 | 397,541 | 436,069 | 699,097 |
| Northern Victoria | 883,928 | 361,075 | 497,667 | 657,206 | 936,498 |
| Total | 2,855,913 | 1,586,079 | 1,723,755 | 2,203,519 | 2,925,717 |
Note: Scenario values are ABARES forecasts. Above the Barmah Choke comprises NSW and Victorian Murray regions above the Barmah Choke. Below the Barmah Choke comprises NSW and Victorian Murray regions below the Barmah Choke. No carryover is assumed for SA Murray. Northern Victoria comprises the Goulburn, Broken, Loddon and Campaspe.
Water allocation scenarios
Table A5 shows water allocation forecasts by entitlement type for 2022–23. While these forecasts mostly reflect the outlook scenarios released by state water agencies, ABARES has also made some additional assumptions:
- Victorian low reliability entitlements will receive no allocations in 2022–23.
- SA Class 3 entitlements are comparable to high reliability entitlements in Victoria and high security entitlements in NSW.
- SA Class 3 allocations are assumed to be 100% under all scenarios, based on historical trends. An opening allocation of 100% was announced on 15 June 2022 (SA DEW 2022).
- For NSW regions, allocations in the wet scenario are assumed to be 25 percentage points greater than the average scenario. In cases where the assumed allocations and carryover exceed the allowable limits set by NSW DPIE, allocations are set to their maximum level.
- Victorian Murray above and below (the Barmah Choke) will receive the same allocation percentage. The same assumption is made for NSW Murray above and below regions.
| Region | Entitlement type | Extreme dry (%) | Dry (%) | Average (%) | Wet (%) |
|---|---|---|---|---|---|
| NSW Murray | General | 49 | 63 | a 110 | a 110 |
| NSW Murray | High | 97 | 97 | 100 | 100 |
| NSW Lower Darling | General | 100 | 100 | 100 | 100 |
| NSW Lower Darling | High | 100 | 100 | 100 | 100 |
| NSW Murrumbidgee | General | 38 | 38 | 53 | ab 100 |
| NSW Murrumbidgee | High | 95 | 95 | 95 | 95 |
| VIC Murray | High | 100 | 100 | 100 | 100 |
| VIC Goulburn | High | 82 | 100 | 100 | 100 |
| VIC Campaspe | High | 70 | 84 | 100 | 100 |
| VIC Loddon | High | 82 | 100 | 100 | 100 |
| VIC Broken | High | 44 | 100 | 100 | 100 |
| SA Murray | High | 100 | 100 | 100 | 100 |
Source: NSW DPIE, NVRM and ABARES
Note: Entitlement type refers to general and high security entitlements in NSW.
a Forecast includes allocations and carryover. The general security account limit for NSW Murray and for NSW Murrumbidgee is 110% and 100% of entitlements on issue respectively.
b Based on indicative analysis of past outlooks and realised seasonal conditions, ABARES has assumed that allocations for 2022–23 would be around 25 percentage points higher than the NSW average scenario if wet conditions were realised. Carryover balances are very high at 28% of entitlements on issue, which means that water available in the NSW Murrumbidgee is automatically set to 100% after the assumed 25% increase from the average scenario.
Annual inter-valley trade limits
Table A6 shows the annual trade limits used by ABARES to approximate IVT rules within the sMDB.
These limits are intended to reflect average annual limits on irrigation water trade, after adjusting for expected environmental transfers (as opposed to limits on accumulated IVT account balances). In practice, trade limits can vary across and within years depending on river operation decisions and changes in trading rules.
| Region | Import limit (ML) | Export limit (ML) |
|---|---|---|
| NSW Murrumbidgee | 0 | 250,000 |
| Above the Barmah Choke | No limit | 40,600 |
| Below the Barmah Choke | No limit | No limit |
| Northern Victoria | 50,000 | 150,000 |
| NSW Lower Darling | 0 | 0 |
Source: ABARES, MDBA, NSW DPIE and NVRM
Note: Above the Barmah Choke comprises NSW and Victorian Murray regions above the Barmah Choke. Below the Barmah Choke comprises NSW and Victorian Murray regions below the Barmah Choke. Northern Victoria comprises the Goulburn, Broken, Loddon and Campaspe regions.
| Term | Definition |
|---|---|
| Allocation | Proportion of a water entitlement that can be taken from the river that year. |
| Barmah Choke | A narrow section of the Murray River that runs through the Barmah–Millewa Forest. The Barmah Choke is a major hydrological constraint in the sMDB that restricts the flow of the Murray River to around 7 GL per day. |
| BOM | Bureau of Meteorology |
| carryover | Water allocated to entitlements that is carried over into the next year. |
| CEWH | Commonwealth Environmental Water Holder |
| ENSO | El Niño–Southern Oscillation |
| entitlement | The right to receive up to a certain volume of water in a year. Only surface water entitlements were considered in this report. |
| IOD | Indian Ocean Dipole |
| IVT | Inter-valley trade |
| ML | Megalitre |
| Northern Victoria | Northern Victoria is specified in this report as the Goulburn, Broken, Loddon and Campaspe regions. Does not include the Victorian Murray region. |
| NSW DPIE | NSW Department of Planning and Environment |
| NVRM | Northern Victoria Resource Manager |
| reliability | Measure of the average volume of water allocated to a particular entitlement type. Provides an indication of the likelihood that an entitlement will receive 100% of its nominal volume by the end of the water year, with high reliability entitlements receiving allocations before low reliability entitlements. |
| SA DEW | SA Department for Environment and Water |
| security | See reliability. |
| sMDB | Southern Murray–Darling Basin |
| Vic. DELWP | Victorian Department of Environment, Land, Water and Planning |
ABARES 2022a, Agricultural Commodities: June quarter 2022, Australian Bureau of Agricultural and Resource Economics and Sciences, Canberra.
ABARES 2022b, Agricultural Commodities: March quarter 2022, Australian Bureau of Agricultural and Resource Economics and Sciences, Canberra.
ABARES 2022c, Seasonal conditions: June quarter 2022, Australian Bureau of Agricultural and Resource Economics and Sciences, Canberra.
ABC 2022a, Cotton harvest delayed by months of wet weather in NSW, ABC Rural, Canberra, accessed 30 June 2022.
ABC 2022b, Sydney flood crisis expected to worsen fruit and vegetable price hike, ABC Rural, Canberra, accessed 5 July 2022.
BOM 2022a, Climate driver update, Bureau of Meteorology, Canberra, accessed 19 July 2022.
BOM 2022b, Climate outlook, Bureau of Meteorology, Canberra, accessed 14 July 2022.
BOM 2021, Australian Water Market Report 2020–21, Bureau of Meteorology, Canberra.
BOM 2020, La Niña underway in the tropical Pacific, Bureau of Meteorology, Canberra, accessed 5 July 2022.
FreshPlaza 2022, Australian almond crop estimate revised, FreshPlaza, accessed 30 June 2022.
DELWP 2022a, Long-term Goulburn to Murray trade rule to take effect from 1 July 2022, Department of Environment, Land, Water and Planning, Melbourne, accessed 1 July 2022.
DELWP 2022b, Trade limits and opportunities, Department of Environment, Land, Water and Planning, Melbourne, accessed 15 July 2022.
Hughes, N, Gupta, M, Whittle, L & Westwood, T 2021, A model of spatial and inter–temporal water trade in the southern Murray–Darling Basin, ABARES, Canberra, February.
MDBA 2022, Barmah Choke trade balance, Murray–Darling Basin Authority, Canberra, accessed 15 July 2022.
MDBA 2021, Barmah-Millewa Feasibility Study, Murray–Darling Basin Authority, Canberra, accessed 15 June 2022.
NSW DPI 2022a, Statewide emergency order issued for varroa mite in NSW, Department of Primary Industries, Orange, New South Wales, accessed 5 July 2022.
NSW DPI 2022b, Varroa mite incursion detected in NSW, Department of Primary Industries, Orange, New South Wales, accessed 5 July 2022.
NSW DPIE 2022a, Water allocation statements: 1 July 2022, NSW Department of Planning and Environment.
NSW DPIE 2022b, Water allocation statements: 15 July 2022, NSW Department of Planning and Environment.
NVRM 2022a, Outlook for the 2022/23 season, Northern Victoria Resource Manager, Tatura, accessed 1 July 2022.
NVRM 2022b, Seasonal determination: 15 February 2022, Northern Victoria Resource Manager, Tatura, accessed 30 June 2022.
SA DEW 2022, Current and historical allocations, SA Department for Environment and Water, Adelaide, accessed 1 July 2022.
SunRice 2022a, 2022 Annual Report, SunRice Group, Leeton, New South Wales.
WaterNSW 2022, Murrumbidgee IVT account status, WaterNSW, Sydney, accessed 15 July 2022.
Watch the WMO July 2022 Summary video
Watch the full ABARES Perspectives: Water Market Outlook July 2022 webinar
Video transcript: ABARES Perspectives: Water Market Outlook July 2022 webinar (DOCX 32 KB)
Download the report
Water Market Outlook: July 2022 (PDF 931 KB)
Water Market Outlook: July 2022 (DOCX 1.5 MB)
If you have difficulty accessing these files, visit web accessibility for assistance.
Previous reports
Water Market Outlook: April 2022
Water Market Outlook: August 2021
For access to other past water markets outlook reports, visit the ABARES publications library.

