
02 November 2022
The Australian Agricultural Census 2020–21 visualisations is based on the most recent agricultural census data collected by the Australian Bureau of Statistics (ABS) for 2020–21.
The dashboards present the data for two sets of regions:
- Australian Statistical Geography Standard Edition 3 regions for Statistical Area level 2 (SA2), state and national data
- Local Government Area (LGA), state and national data
The visualisations are designed to showcase the Agricultural Census data in a simple and intuitive way – as maps and charts with a focus on national, state and regional summaries for:
- Area
- Production including the area planted or harvested, production and number of livestock or trees
- Number of businesses
- Gross value of productions
The data is presented for two sets of regions:
- Australian Statistical Geography Standard Edition 3 regions for Statistical Area level 2 (SA2), state and national data
- Local Government Area 2021, state and national data
Each dashboard has two pages:
- By crop commodity – shows information about specific crop and horticulture commodities
- By livestock commodity – shows information about specific livestock commodities
- By regions – shows all commodities for selected regions
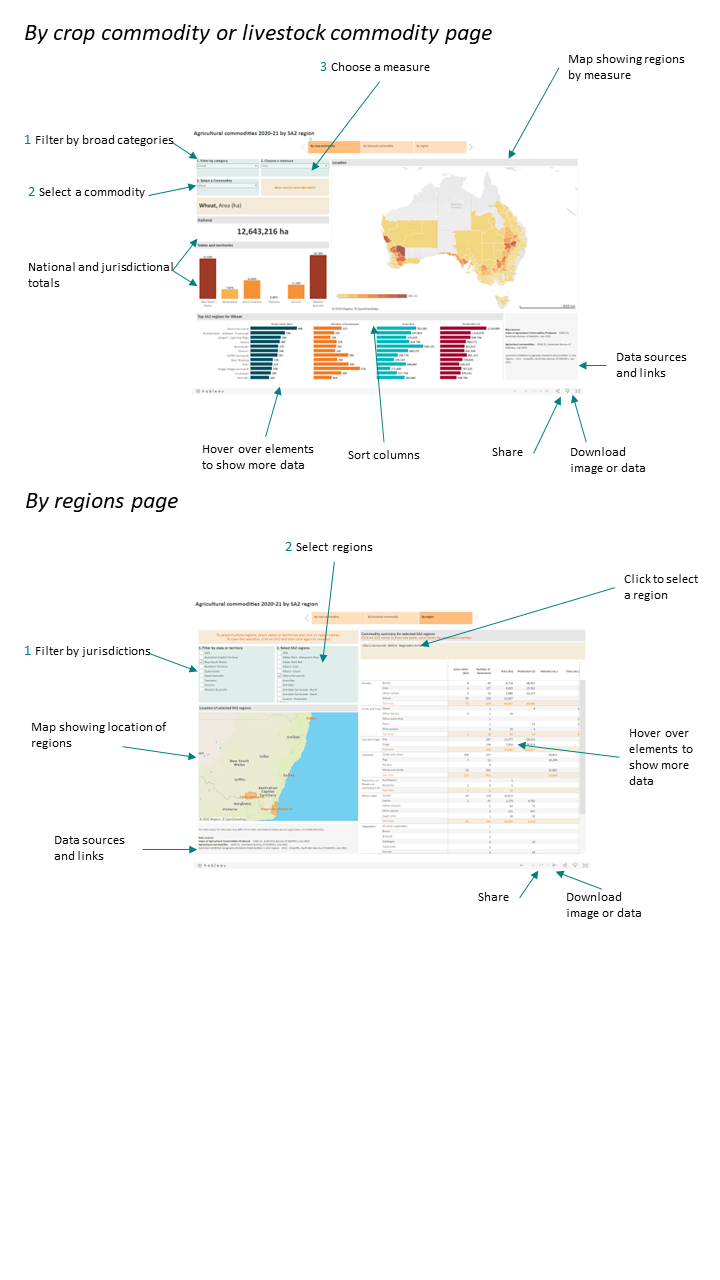
Using the By crop commodity or the By livestock commodity page
1. Filter by:
- Broad agricultural industry – crops, horticulture or livestock
- Commodity name
- Measure – area, gross value, production or businesses
2. Explore the maps, charts and tables for more information
- Hover over the state bar chart to see the Share of Australia
- Hover over a region in the Regions map to see the region name, and share of Australia
- Hover over a bar in the top regions to see the rank in Australia
- Top regions – By default regions are sorted by area, click on Sort button (in top right of the Measure header) to sort by another measure
Using the By Regions page
1. Filter by:
- state or territory
- select one or more regions, click on All to select all regions and click again to deselect
2. Explore the maps, charts and tables for more information
- Hover over the map to see the name of the region
- Click a list of regions to select a specific region, click again to see aggregated table
- Hover over table to see the share of region
The main purpose of the Agricultural Census is to provide benchmark information on agricultural industries. The ABS collects agricultural census data every 5 years from agricultural businesses that are recorded in the ABS’ Business Register and have an estimated value of their agricultural operations of $40,000 or greater.
The ABS publish the data at a number of levels. The visualisations are reported at:
- Statistical Areas Level 2 (SA2): SA2s are medium-sized general purpose areas built up from whole Statistical Areas Level 1. Their purpose is to represent a community that interacts together socially and economically. There are 2,473 SA2s in Australia of which 1,124 report agriculture.
- Local Government areas: Local Government Areas are administrative regions as defined by each state and territory. The spatial data are based on ABS Mesh Block approximation of gazetted local government boundaries. There are 566 LGAs in Australia of which 476 report agriculture.
- State or territories
- Australia
Data sources:
- 7503.0 – Value of Agricultural Commodities Produced, Australia, 2020–21 – abs.gov.au/statistics/industry/agriculture/agricultural-commodities-australia/latest-release
- 7121.0 – Agricultural Commodities, Australia, 2020–21 – abs.gov.au/statistics/industry/agriculture/value-agricultural-commodities-produced-australia/2020-21
Historical agricultural census data can be found here:
- Agricultural commodities – abs.gov.au/statistics/industry/agriculture/agricultural-commodities-australia
- Value of agricultural commodities produced – abs.gov.au/statistics/industry/agriculture/value-agricultural-commodities-produced-australia