Revision date: 27 June 2024
Publication date: 26 February 2024
This is the latest compilation of land use mapping information for Australia’s regions as at December 2023. The land use data are supported by a supplementary commodities dataset, containing extra information on the location of selected predominantly agricultural commodities. These datasets replace the previous 2020 December updates. These data were compiled by the Australian Bureau of Agricultural and Resource Economics and Sciences (ABARES) from vector land use datasets collected as part of state and territory mapping programs and other authoritative sources through the Australian Collaborative Land Use and Management Program (ACLUMP). These datasets are not recommended for change analysis or for national land use statistics—instead use the Land use of Australia 2010-11 to 2015-16.
Version 2 fixes issues caused by the conversion of the state vector datasets to rasters, where single pixel horizontal lines were generated in local areas. This does not affect the date or scale of mapping.
Data, metadata and maps have been updated as at June 2024.
- Version 2 June 2024 corrects minor processing issues in WA and Tasmania. This does not affect the date or scale of mapping.
- A seamless raster dataset that combines land use vector data for all state and territory jurisdictions, at a spatial resolution of 50 by 50 metres.
- Shows a single dominant land use for each location, based on the management objective of the land manager (as identified by state and territory agencies).
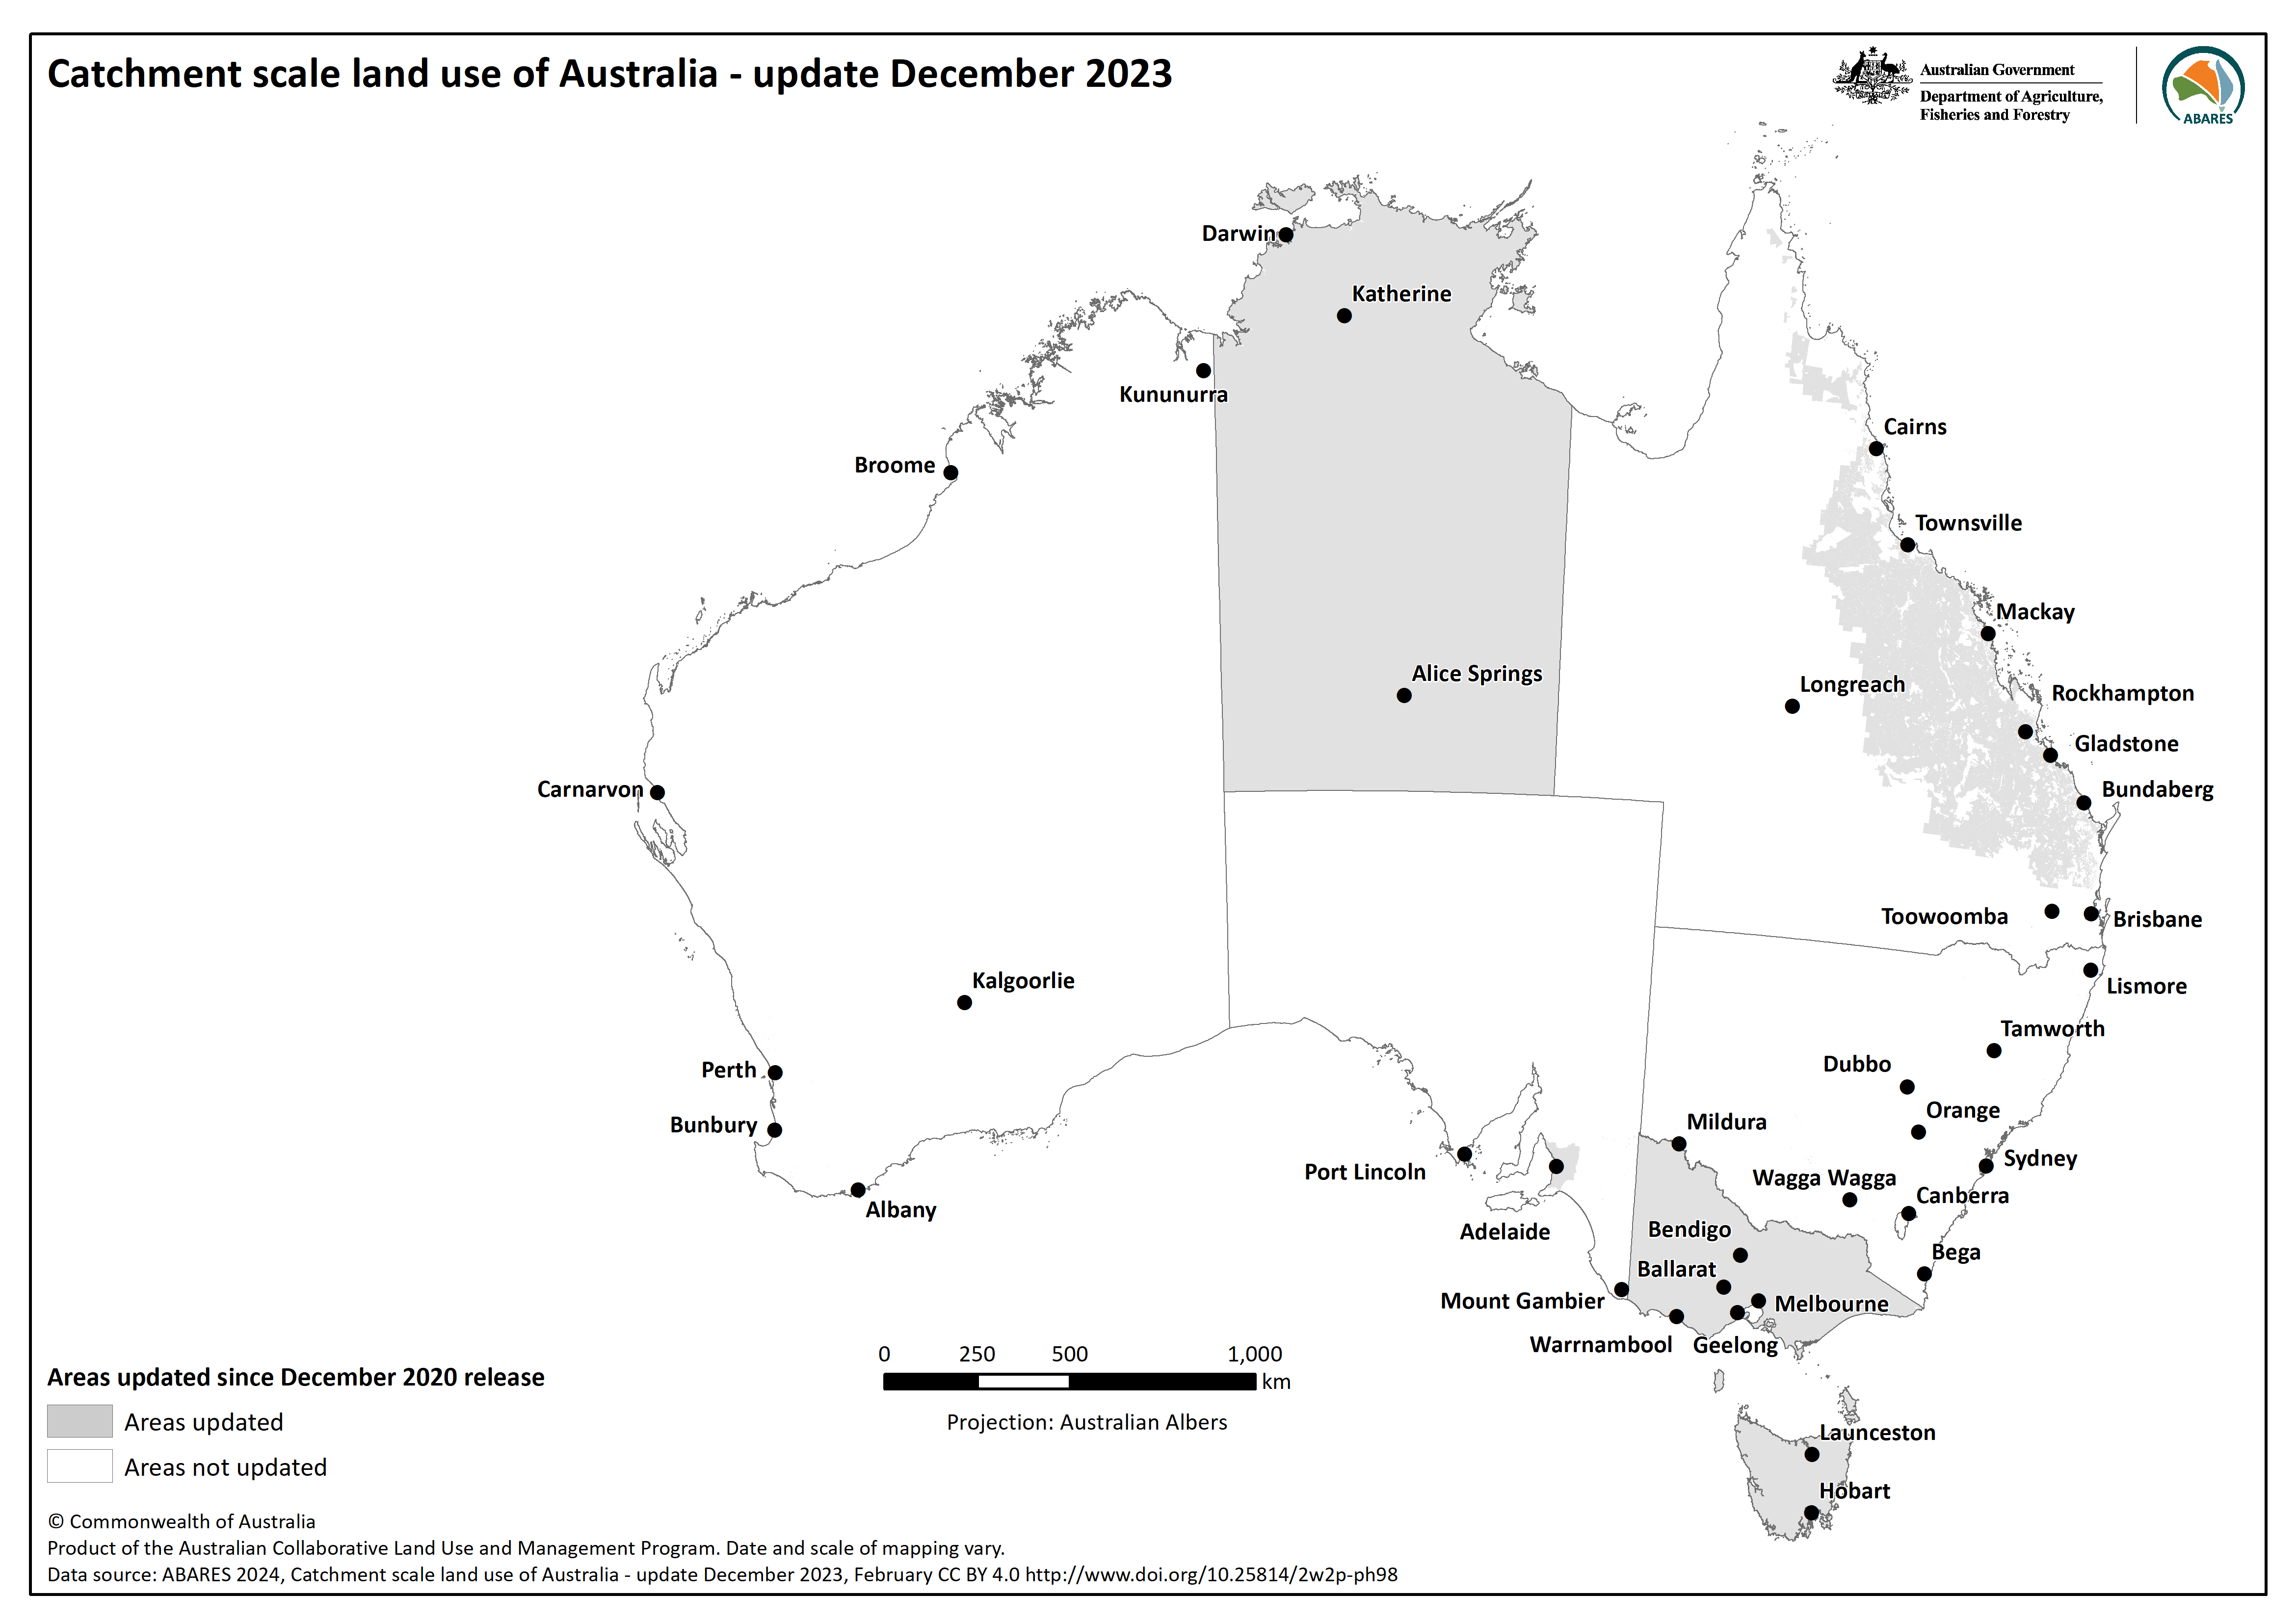
- Updates have been made to New South Wales, Northern Territory, Tasmania, Victoria, the capital city of Adelaide, parts of the Great Barrier Reef NRM regions, and national updates to select horticultural tree crops and protected cropping structures. There are also minor corrections to Western Australia, and more accurate representation of mining areas in South Australia.
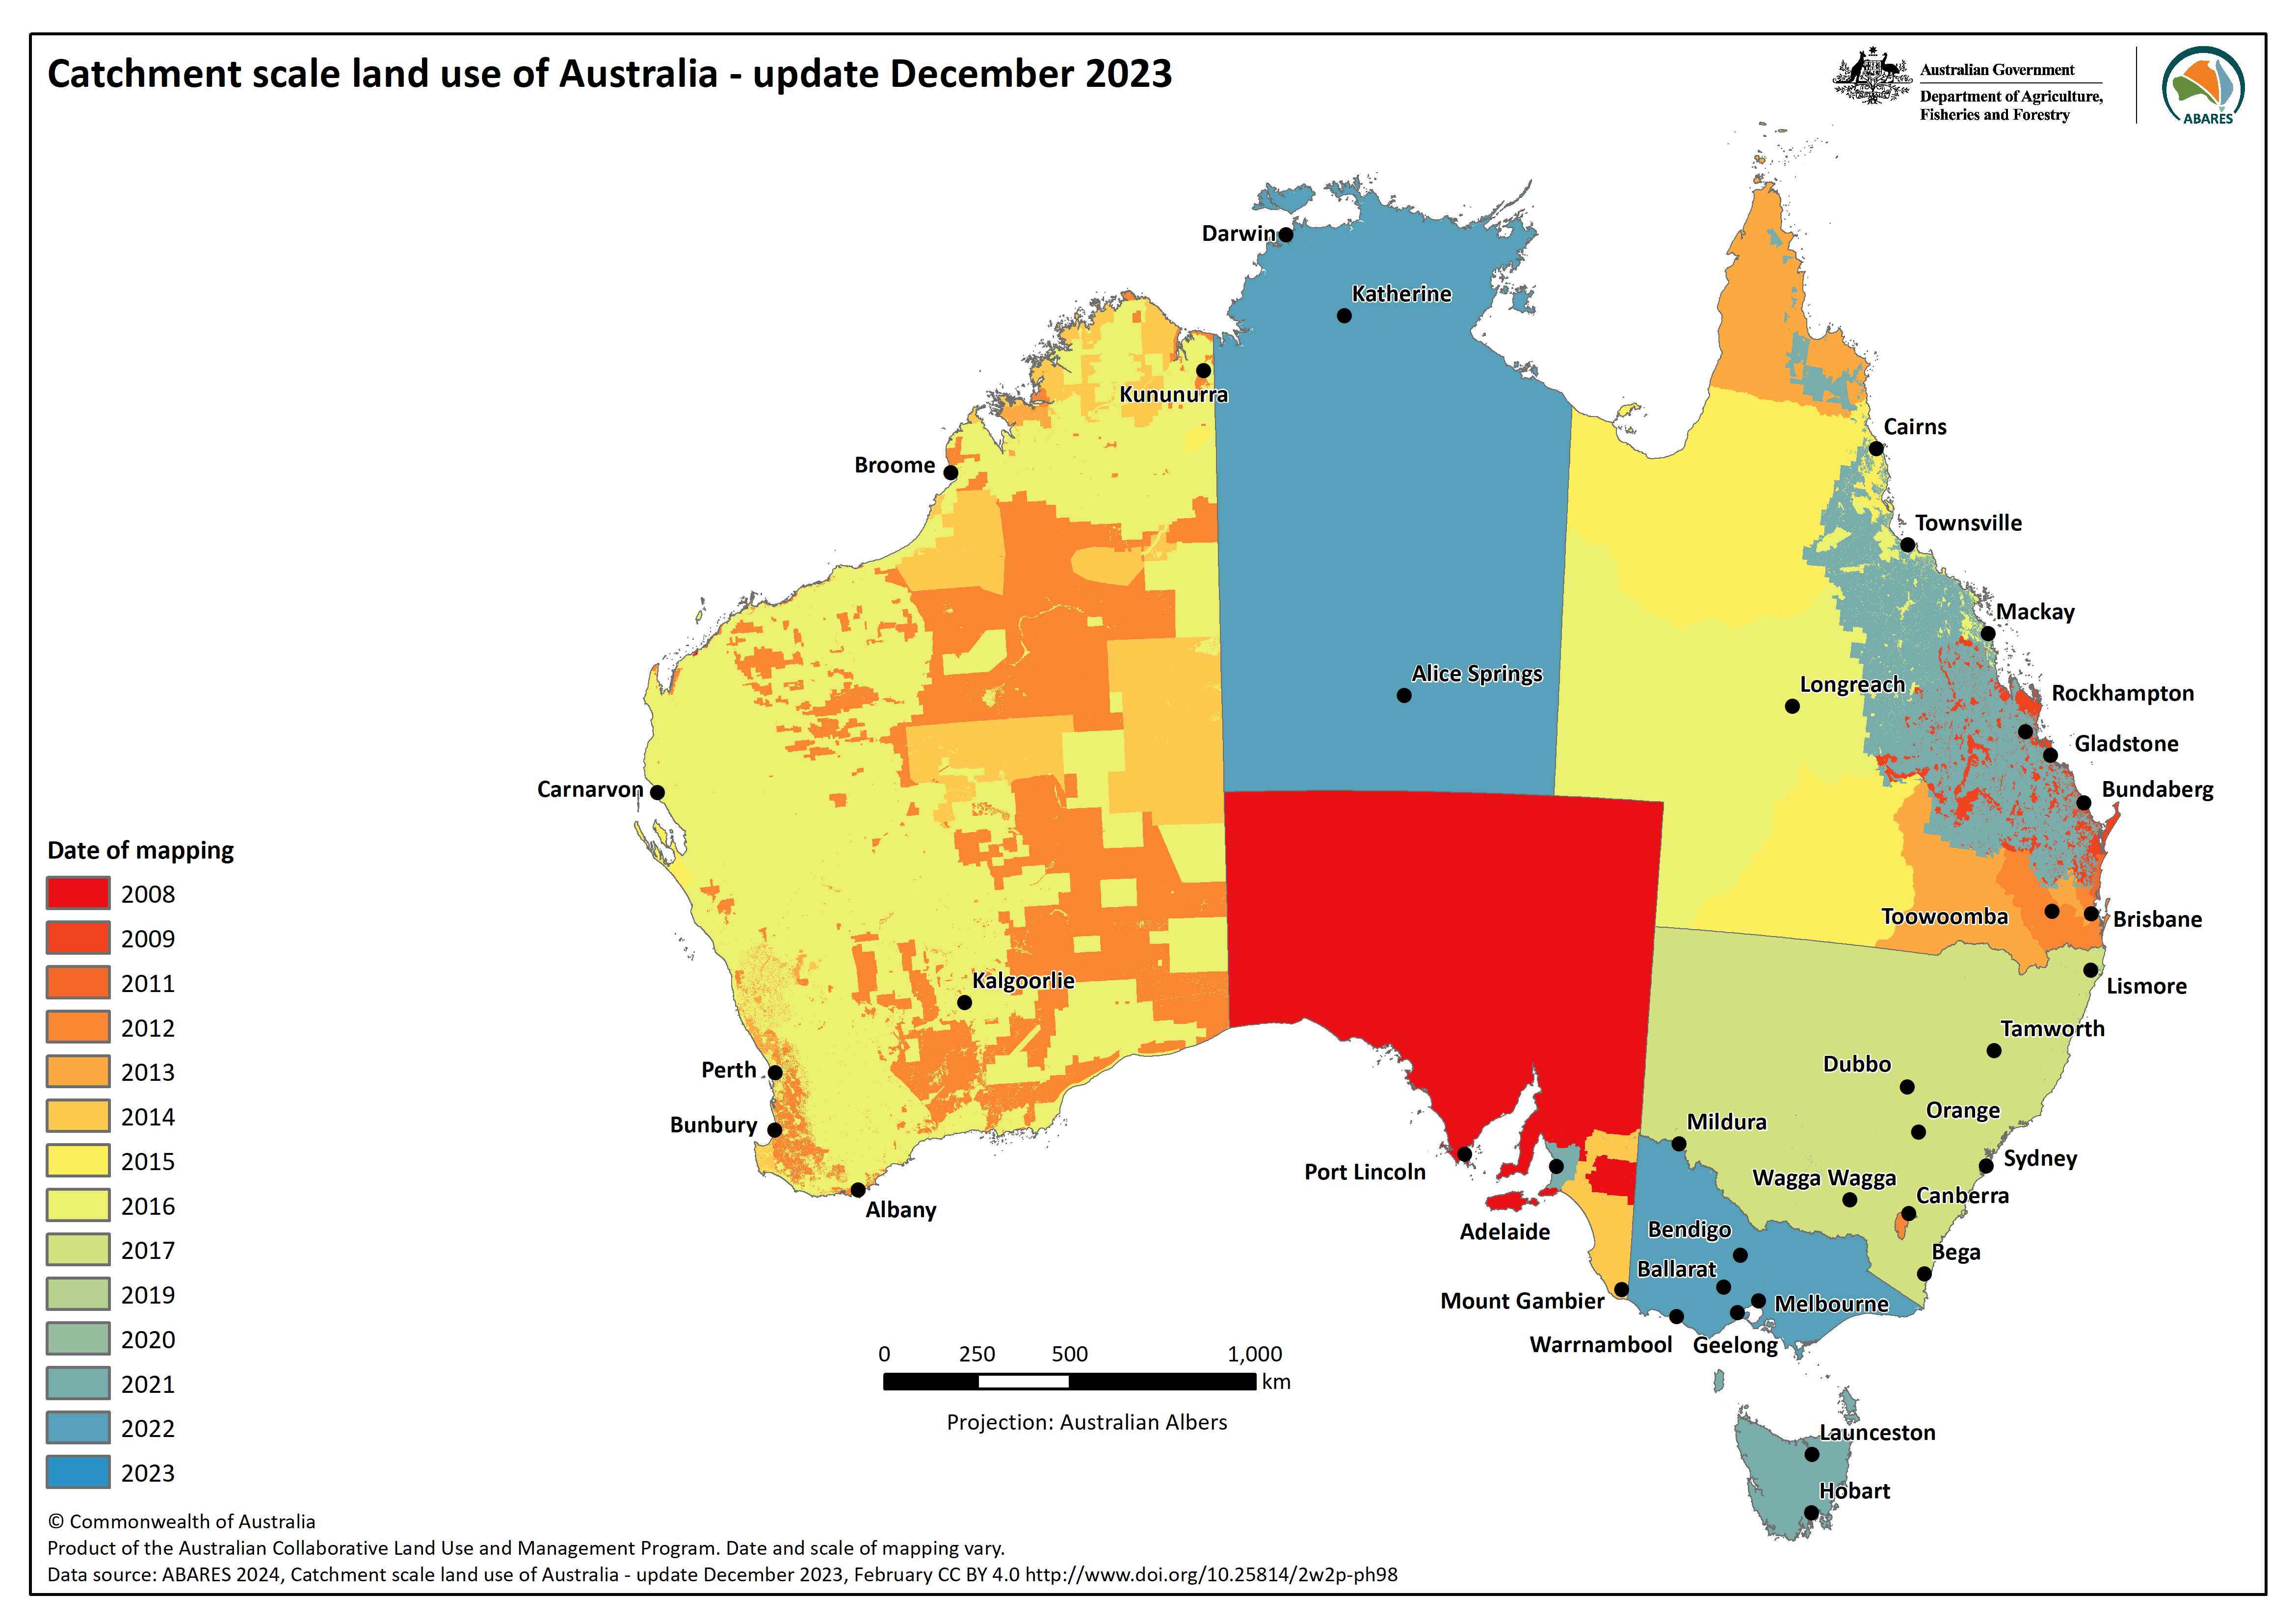
- The date of mapping (2008 to 2023) and scale of mapping (1:5,000 to 1:250,000) vary and are provided as supporting datasets.
- Produced by combining land tenure and other types of land use information, fine-scale satellite data and information collected in the field.
- Areas corrected in V2 were in (longitude, latitude in decimal degrees):
- North-east Tasmania
- From 146.296, -41.564 to 147.726, -41.436
- From 146.628, -41.665 to 147.467, -41.586
- Western Australia
- Northern Agricultural Region: from 115.843, -30.078 to 116.178, -30.116
- Avon: from 116.916 -30.643 to 115.843, -30.078
- Mt Barker: from 117.400, -34.509 to 118.039, -34.568
- North-east Tasmania
- Refer to the metadata for additional information.
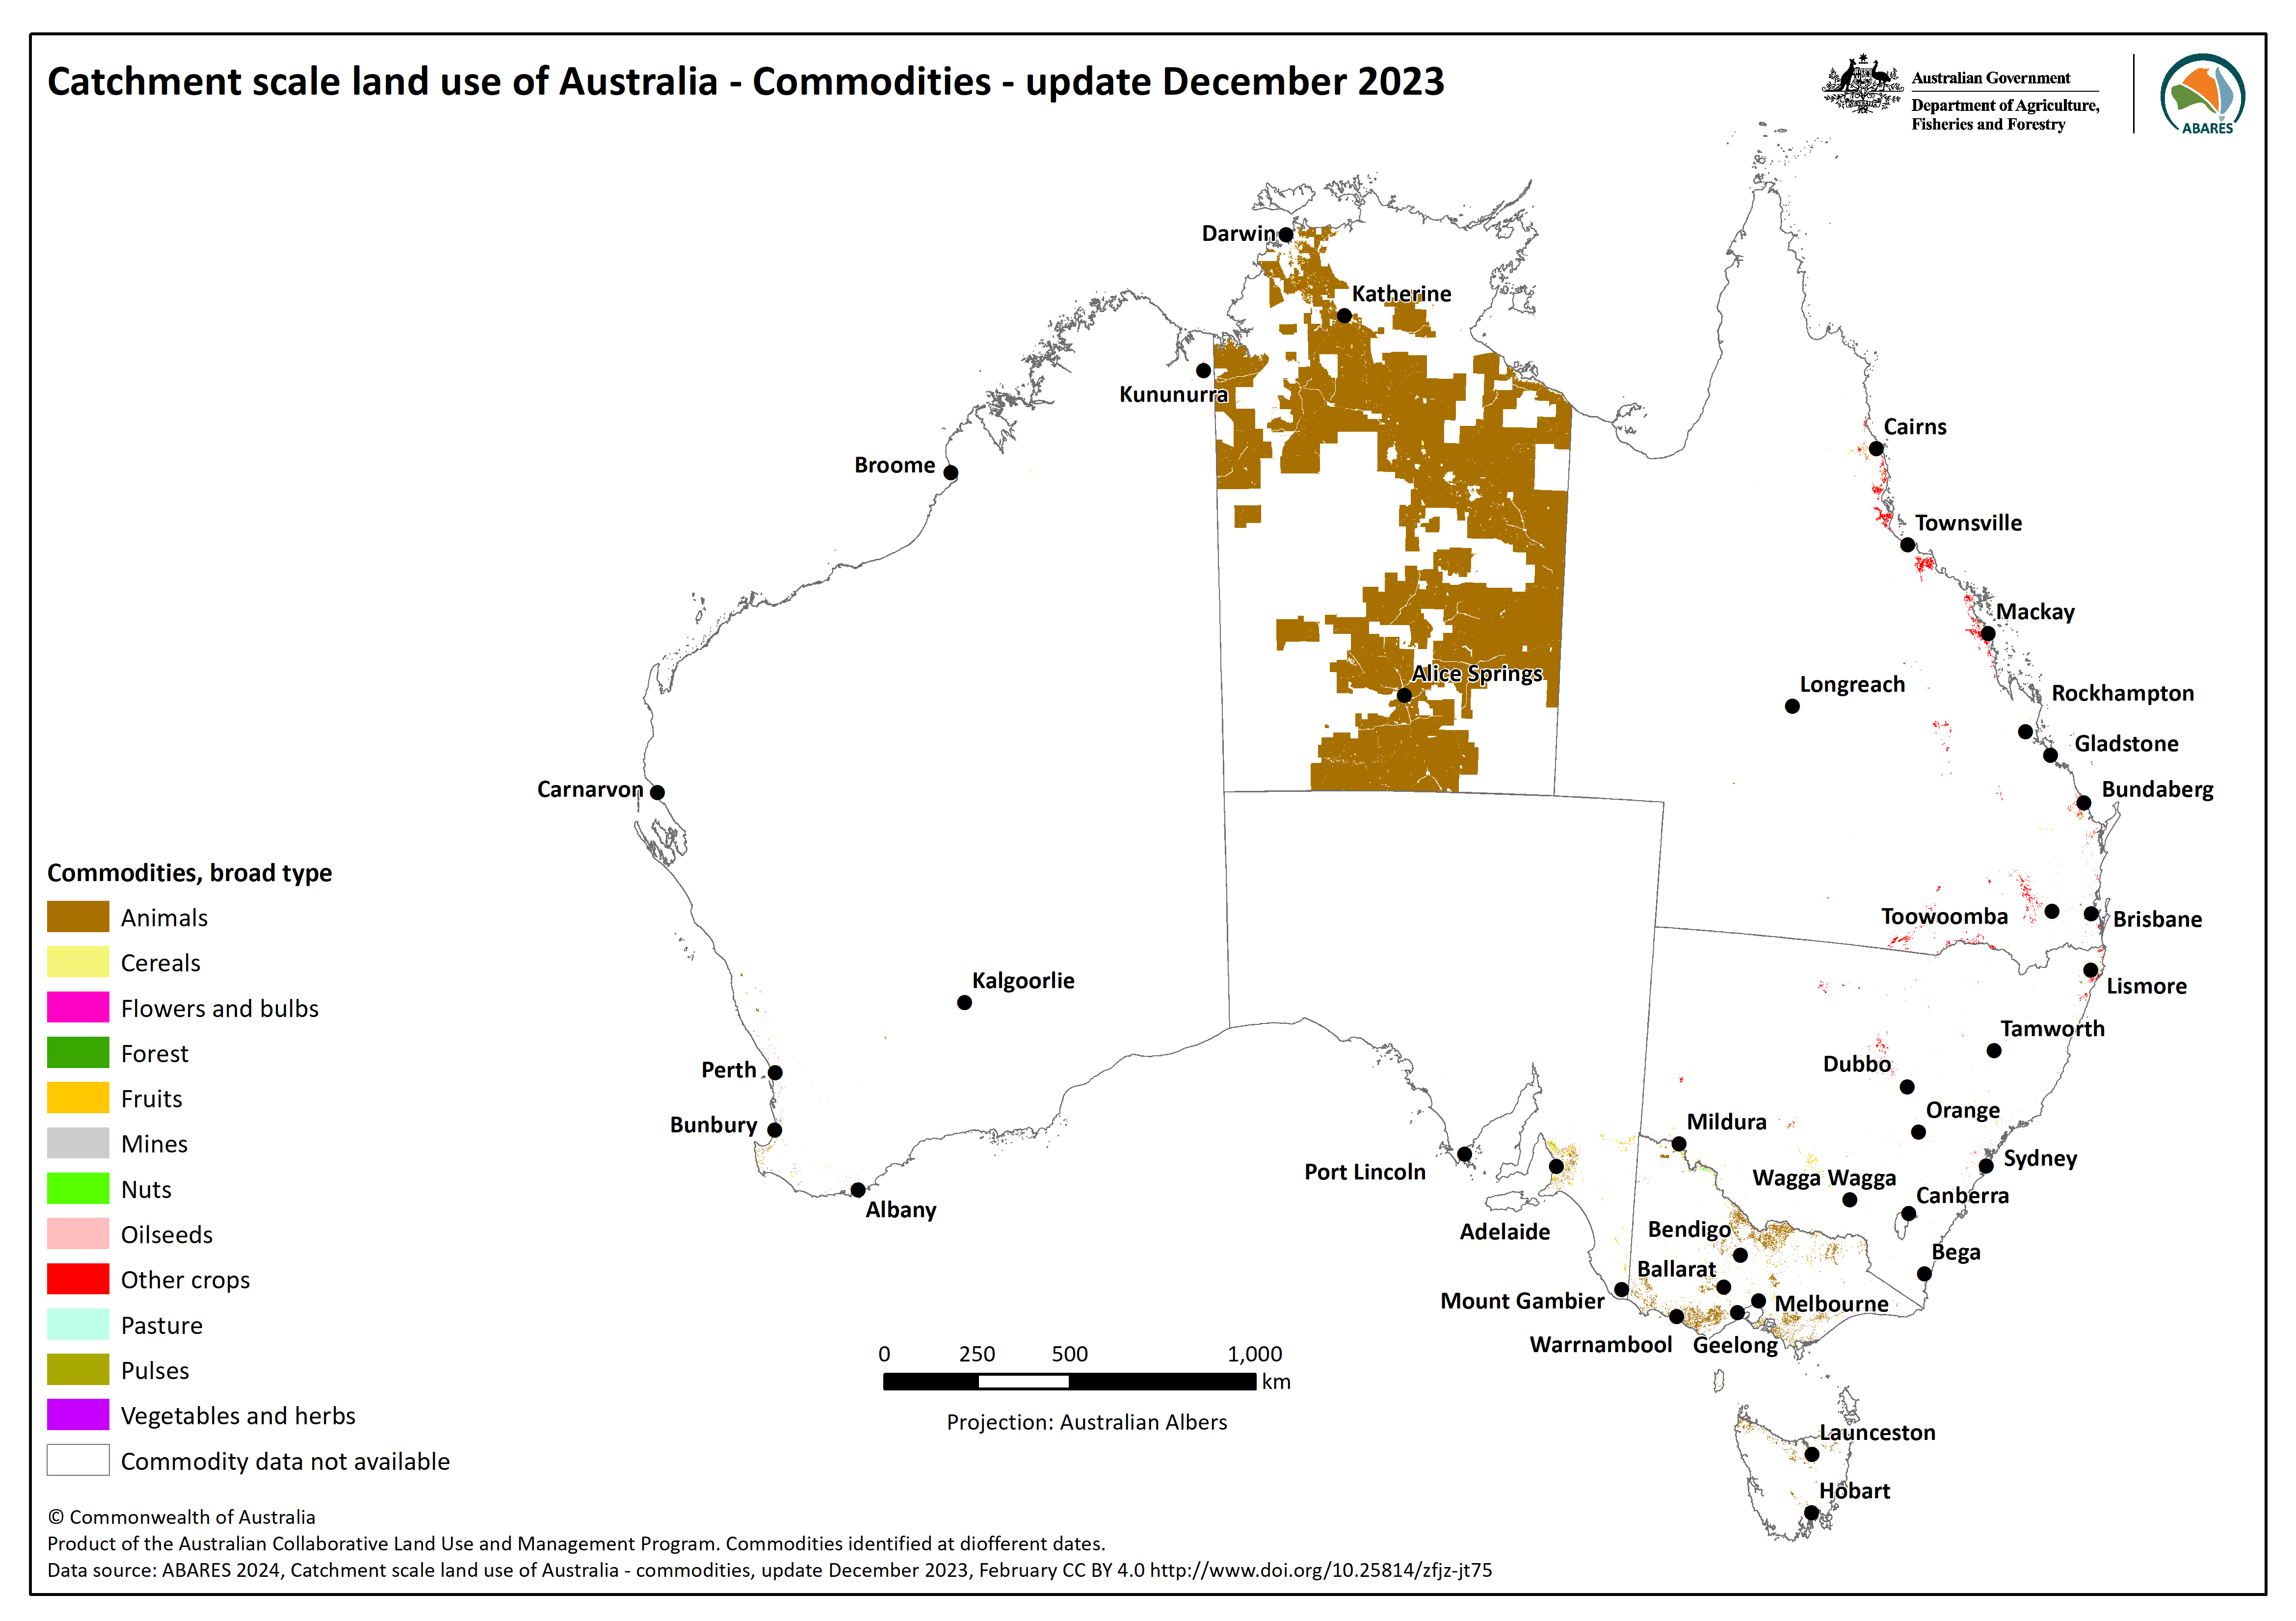
- Provides location, extent and year verified for 185 commodities, where mapped, as a vector dataset.
- Commodity data are validated in the field and using other sources.
- Generally, a single commodity is shown at a location reflecting the most recent date that location was verified.
- The location of a commodity may change on a seasonal to annual basis, depending on factors such as climate, markets or farming systems.
- Not nationally complete or comprehensive, and with various dates of capture (1967 to 2023) and input mapping products (2014 to 2023).
- Refer to the metadata for additional information.
Data
Also available on data.gov.au
Land use
- Catchment Scale Land Use of Australia v2 – raster package (GeoTIFF and supporting files) – ZIP [126 MB]
- Catchment Scale Land Use of Australia – date and scale of mapping shapefile raster package (GeoTIFF and supporting files) – ZIP [398 MB]
Commodities
- Catchment Scale Land Use of Australia – Commodities – package (shapefile) – ZIP [44.5 MB]
Metadata
- Catchment Scale Land Use of Australia version 2 – descriptive metadata – MS Word [685 KB] and PDF [746 KB]
- Catchment Scale Land Use of Australia – Commodities – descriptive metadata – MS Word [256 KB] and PDF [435 KB]
Maps
Land use
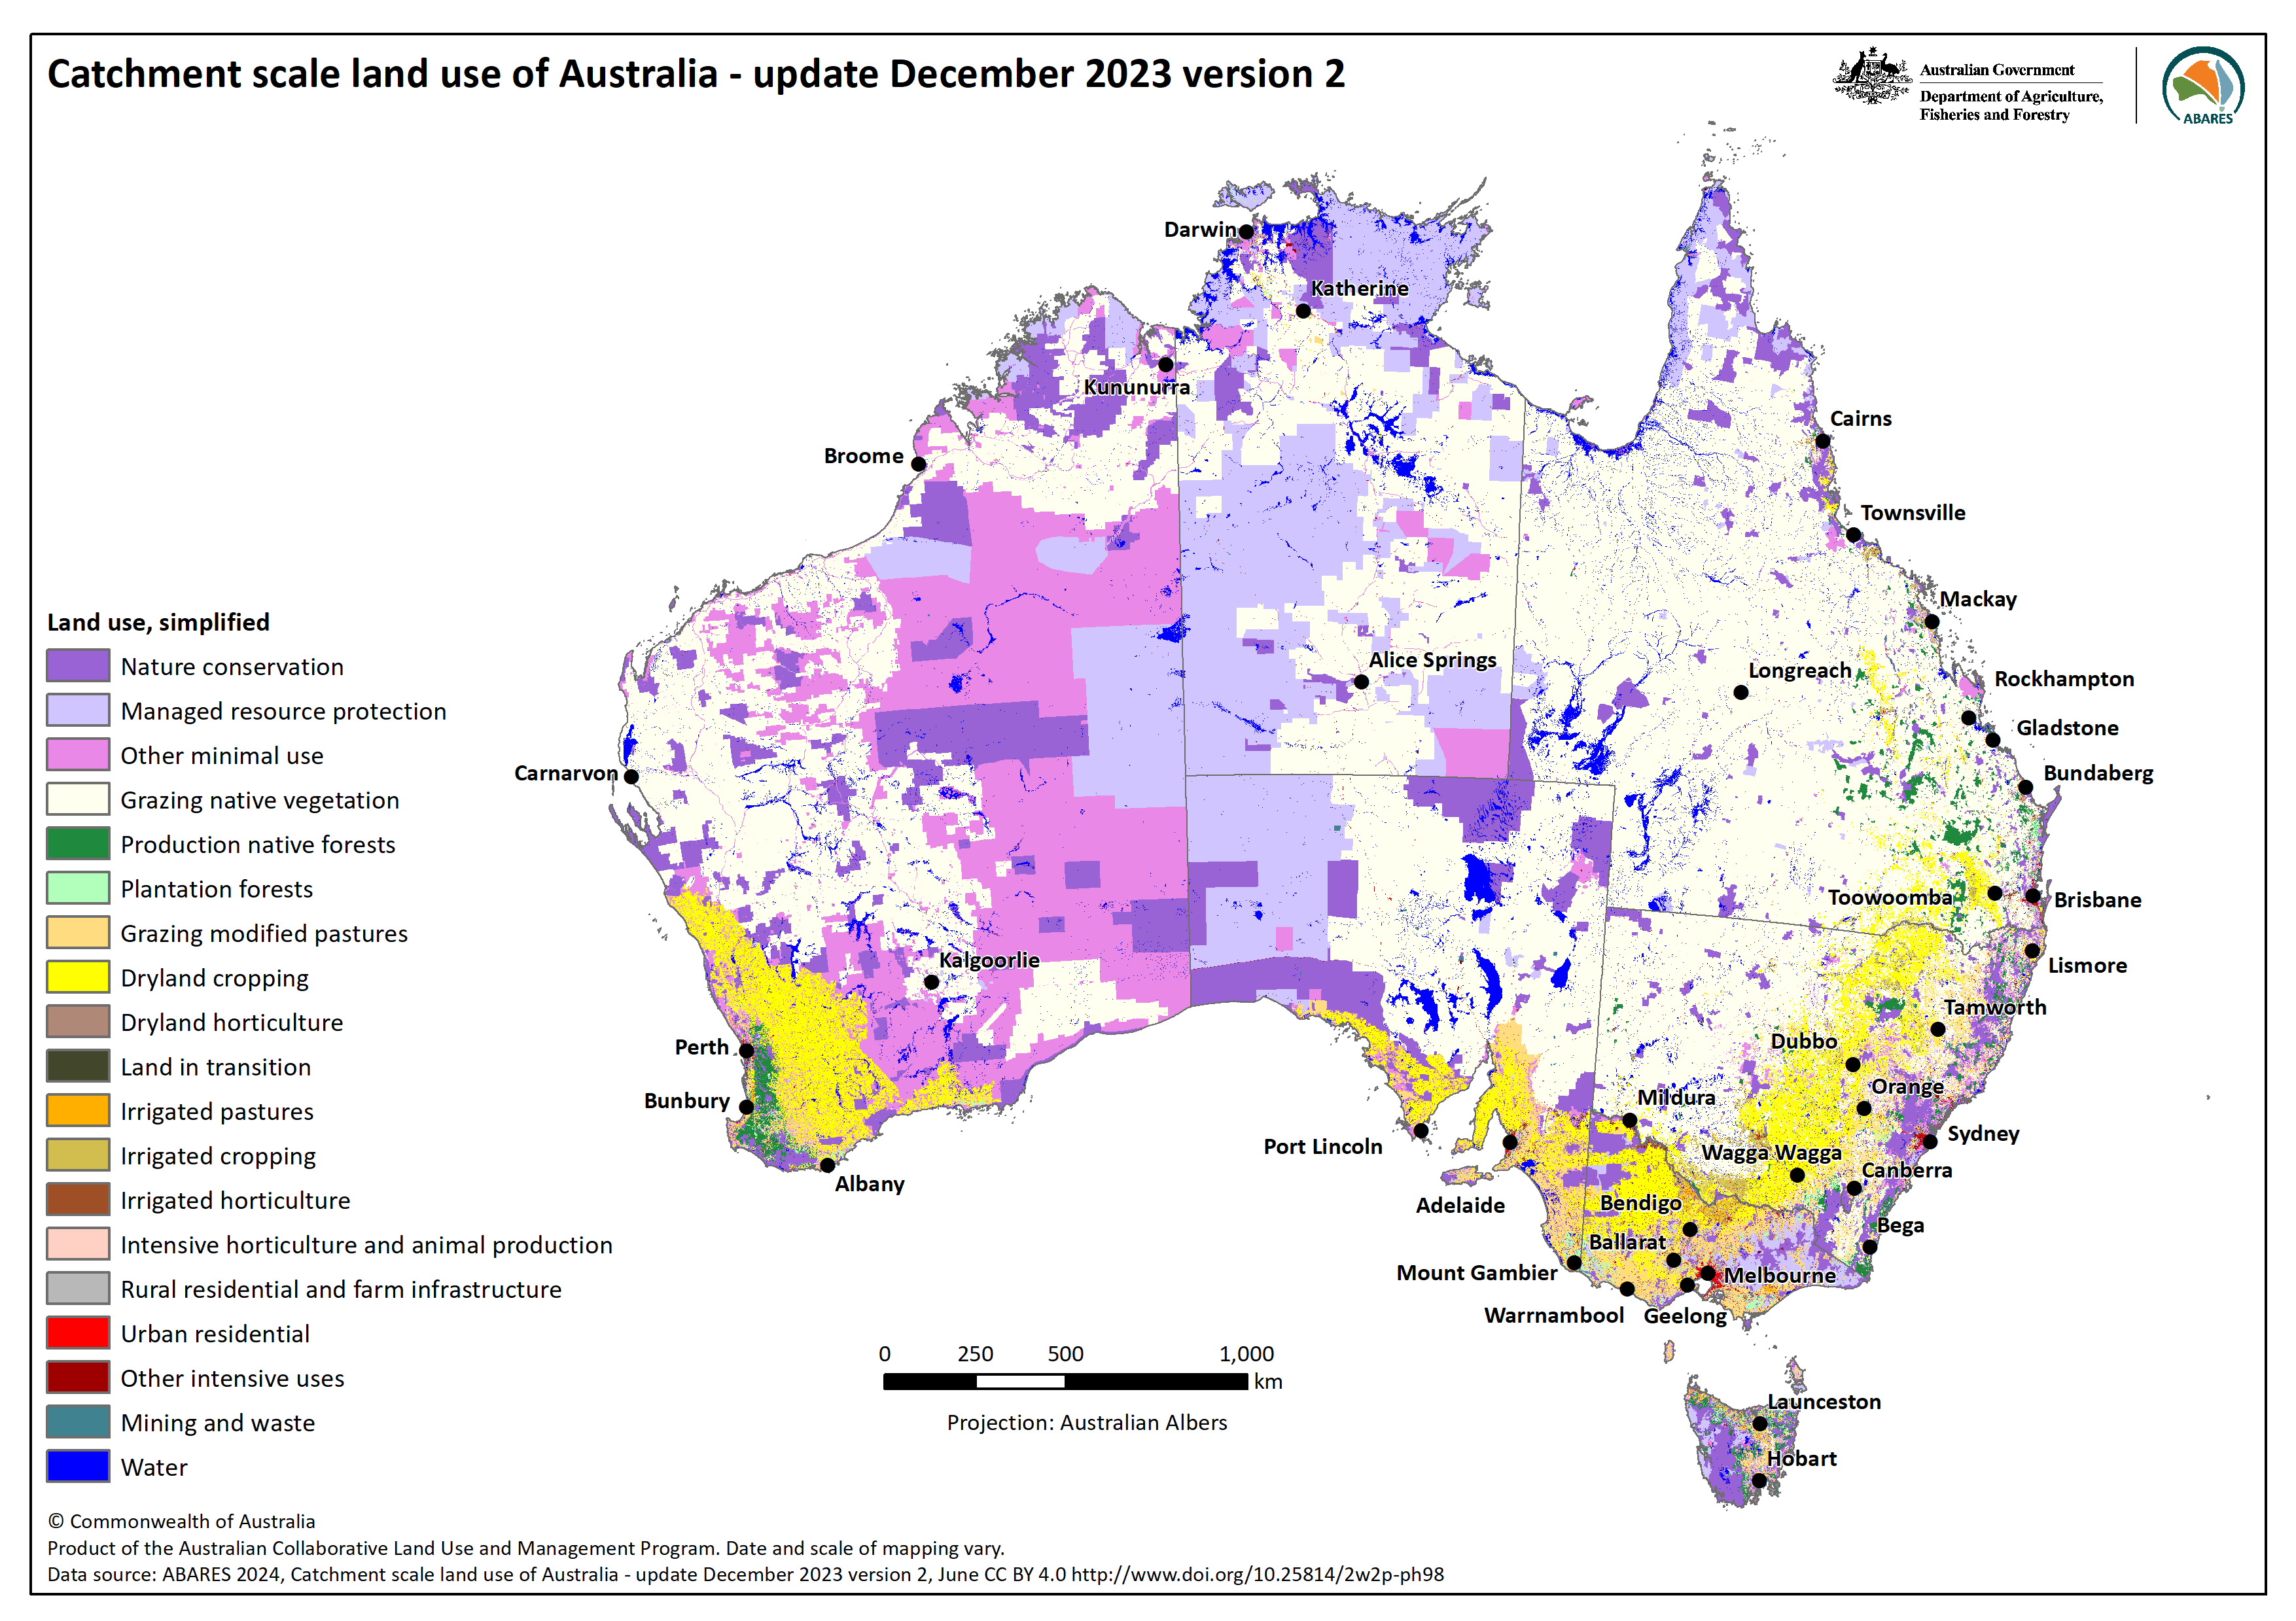
- Catchment Scale Land Use of Australia v2 – Map showing simplified land use – PNG [1.3 MB]
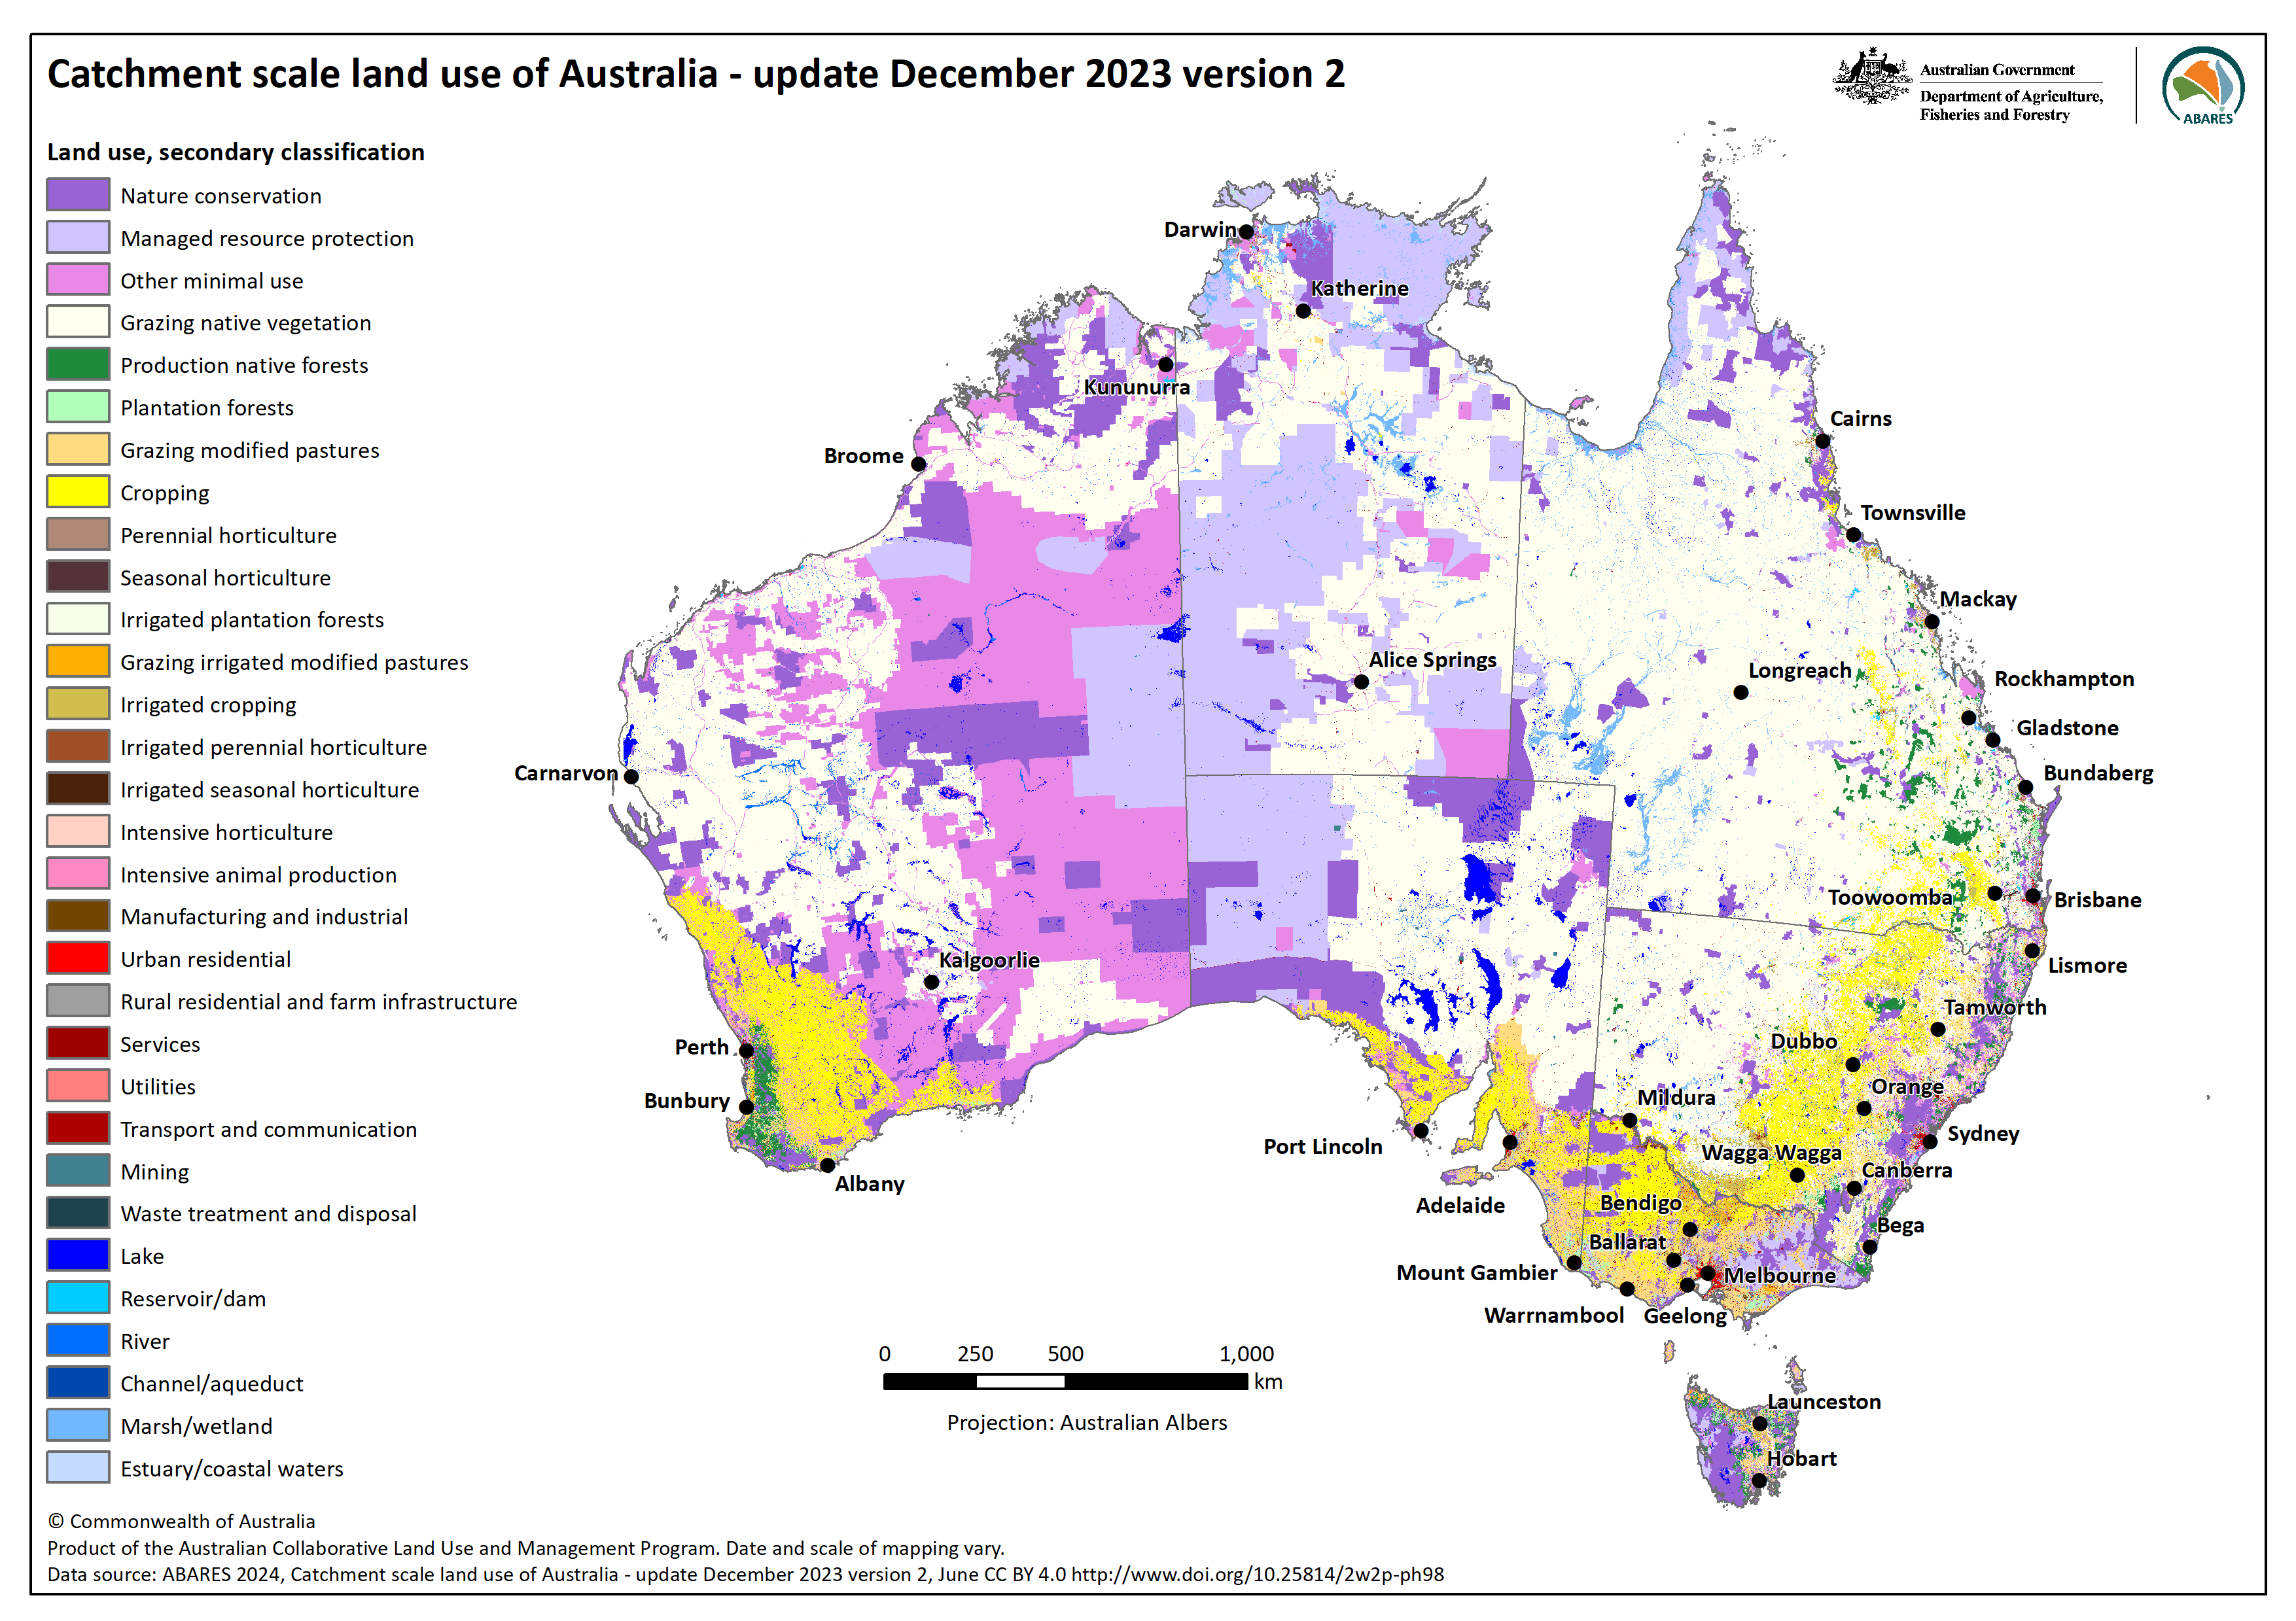
- Catchment Scale Land Use of Australia v2 – Land use map based on the ALUM secondary classes – PNG [1.3 MB]
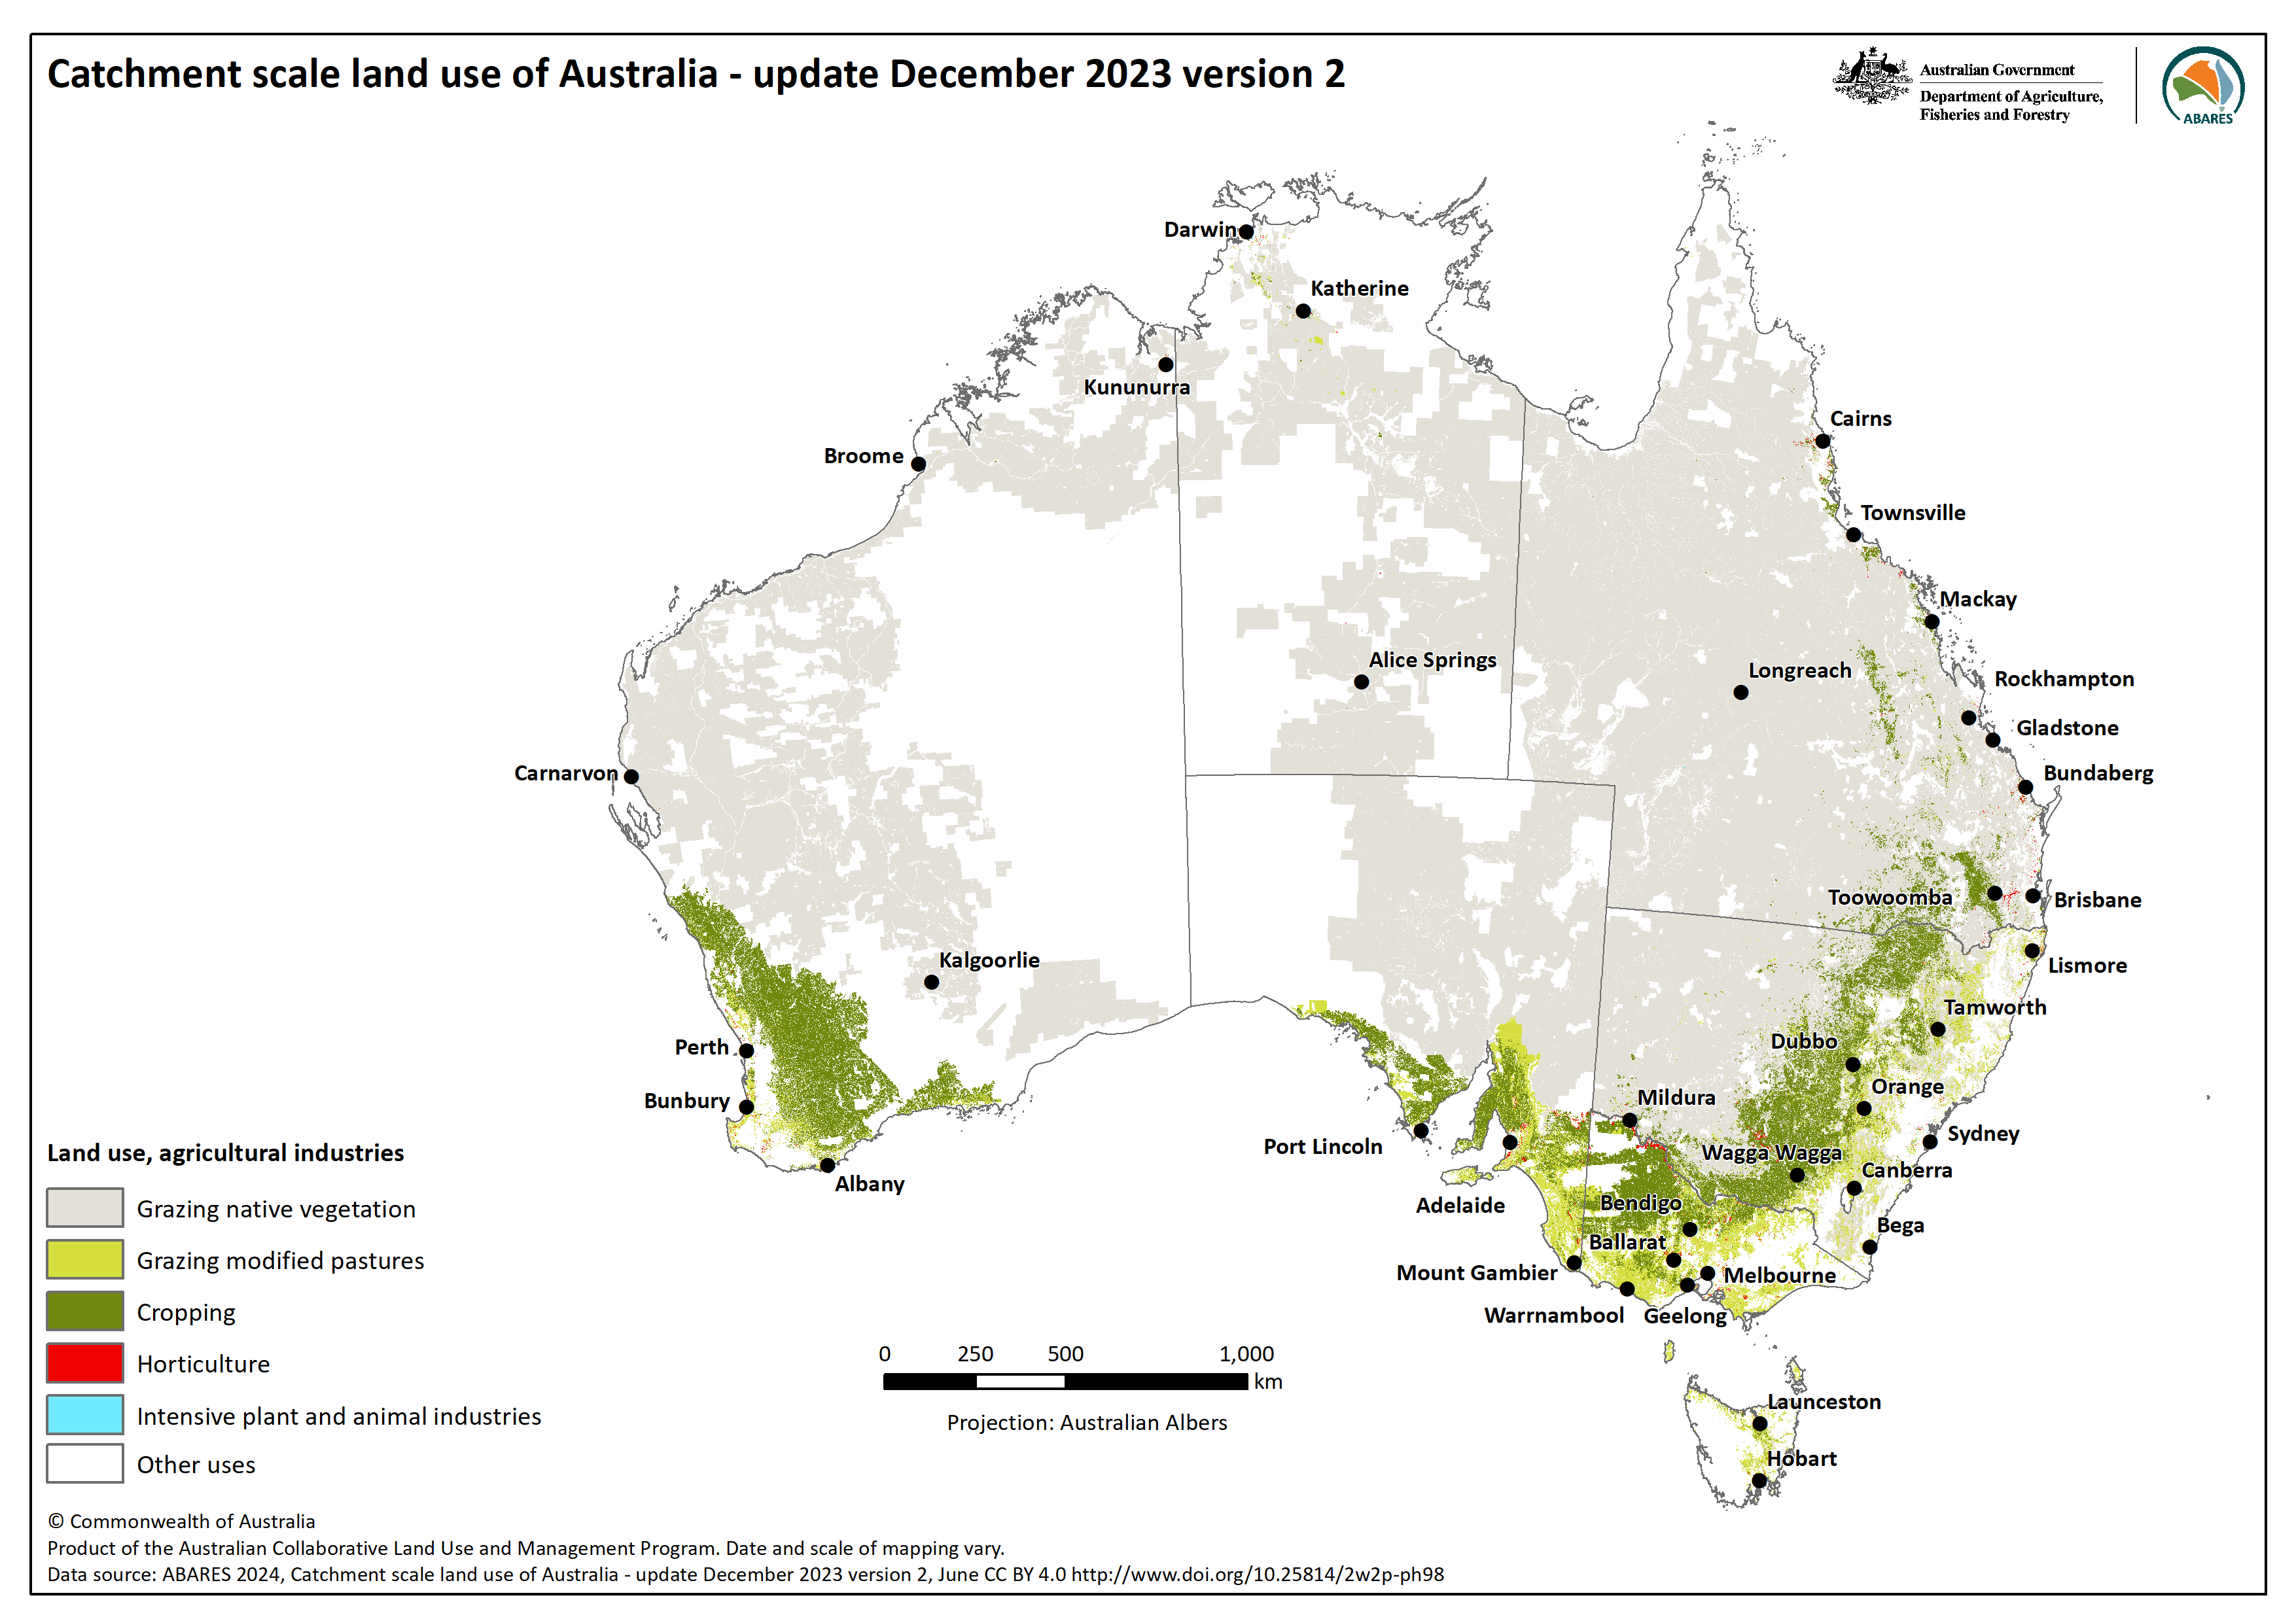
- Catchment Scale Land Use of Australia v2 – Land use map based on agricultural industries – PNG [0.9 MB]
- Catchment Scale Land Use of Australia – Map showing the year of CLUM mapping – PNG [0.4 MB]
- Catchment Scale Land Use of Australia – Map showing scale of CLUM mapping – PNG [0.5 MB]
- Catchment Scale Land Use of Australia – Map showing the areas updated since December 2020 release – PNG [0.3 MB]
Commodities
Land use: ABARES 2024, Catchment Scale Land Use of Australia – Update December 2023 version 2, Australian Bureau of Agricultural and Resource Economics and Sciences, Canberra, June, CC BY 4.0, DOI: 10.25814/2w2p-ph98
Commodities: ABARES 2024, Catchment Scale Land Use of Australia – Commodities – Update December 2023, Australian Bureau of Agricultural and Resource Economics and Sciences, Canberra, February CC BY 4.0. DOI: 10.25814/zfjz-jt75
Land use is classified according to the Australian Land Use and Management (ALUM) Classification Version 8, a three-tiered hierarchical structure. There are five primary classes, identified in order of increasing levels of intervention or potential impact on the natural landscape. Water is included separately as a sixth primary class. Primary and secondary levels relate to the principal land use. Tertiary classes may include additional information on commodity groups, specific commodities, land management practices, or vegetation information.
These data are a product of the Australian Collaborative Land Use and Management Program (ACLUMP). ACLUMP, a consortium of Australian, state and territory government partners, promotes the development of nationally consistent information on land use, land cover, and land management practices underpinned by common technical standards. See the metadata for more detailed acknowledgments for each dataset.
Graphics
Interactive views
Web services for the Catchment Scale Land Use of Australia are available from Digital Atlas Australia
Simplified classification - Catchment Scale Land Use 2023, Simplified Classification
Secondary classification - Catchment Scale Land Use 2023, Secondary Classification
Agricultural Industries - Catchment Scale Land Use 2023, Agricultural Industries Classification
Date of mapping - Catchment Scale Land Use 2023, Date of mapping
Scale of mapping - Catchment Scale Land Use 2023, Scale of mapping
Contact

