Skip to main content Skip to main navigation Skip to search

Help for those affected by flood

Visit nema.gov.au.

Close
ABARES - Land use and management

Top navigation abares

  • Department
  • Ministers
  • Media Centre
Main menu

Main navigation ACLUMP

  • Land home
    Land home
  • About ACLUMP
    About ACLUMP
  • Land use
    Land use
  • Publications
    Publications
  • Data download
    Data download
  • Latest news
    Latest news
Department of Agriculture

Breadcrumb

  1. DAFF Home
  2. ABARES
  3. Land use and management
  4. Land use

Secondary ACLUMP

  • ACLUMP
    • About ACLUMP
    • Latest news
    • Land use
      • Land use mapping
      • Catchment scale land use profiles
      • Mapping technical specifications
      • Land use apps
      • Data download
      • Publications
      • Australian Land Use and Management Classification
        • ALUM Classification Version 8 (October 2016)
      • Australian Agricultural Census 2020–21 visualisations
      • Land tenure of Australia 2010–11 to 2015–16
    • Land Management Practices
      • Collating LMP Information
      • Data and Maps
      • Drivers for LMP Information
      • Information System
      • Mapping ground cover management
      • Publications
    • Land Cover
      • Dynamic land cover
      • Ground cover monitoring for Australia
      • Publications
    • Land Use Change Overview
      • Catchment scale examples
      • National scale examples
    • Publications
    • Definitions
    • Multi-Criteria Analysis Shell for Spatial Decision Support
      • MCAS-S tool
      • Australian national map layers
      • Quick Start Guide
        • 1. Introduction
        • 2. Set Up
        • 3. Input and Classification
        • 4. Composition and Comparison
        • 5. Building Criteria
        • 6. Reporting and Analysis
        • 7. Exporting
      • Preparing your own data
      • Updates
      • Disclaimer
      • MCAS-S-version-4

Land use

Land uses have a major effect on Australia's natural resources through their impacts on water, soil, nutrients, plants and animals. There is also a strong link between changing patterns of land use and economic and social conditions, particularly in regional Australia.

A summary of Australia's land use is provided in Land Use in Austral​ia​ at a Glan​ce PDF​ [1.11 MB, 4 pages].​​

What is land use?

Land use information shows how our land resources are used. This includes the production of goods (such as crops, timber and manufactures) and services (such as defence, recreation, biodiversity and natural resources protection).

There is often confusion between the terms 'land use' and 'land cover' because of the common use of remotely sensed data (either satellite or airborne) for mapping. The distinction between land use and land management practice is also poorly understood.

Examples of ALUM land use classes

Australia's Land Use

​​​Land use mapping in Australia is conducted broadly at two scales: national scale and catchment scale.

The map and area statistics below show national scale land use mapping for Australia for 2015–16.

Catchment scale mapping can be viewed via the National​ Map. This mapping has been completed across the country for different time periods.​ ​

Both national scale and catchment scale land use datasets can be accessed via the data download page. Detailed information about how Australia's land use is mapped is available on the Mapping technical​ specifications page.

Land use of Australia 2015–16 – Land use based on ALUM secondary classification

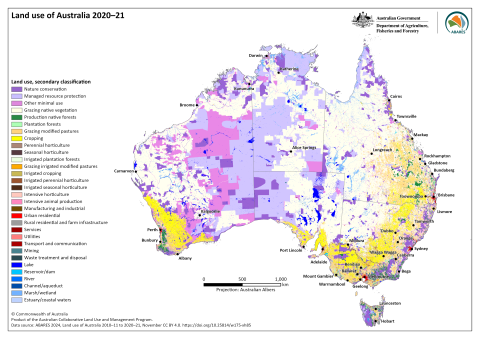
National scale land use (based on Land Use of Australia 2010–11 to 2015–16, 250 m, ABARES 2022)


Land use in 2015–16 Area (sq. km) Percent
Nature conservation 729,298 9.5%
Managed resource protection 1,367,011 18%
Other minimal use 1,042,370 14%
Grazing native vegetation 3,253,707 42%
Production native forests 77,553 1.0%
Plantation forests (commercial and other) 26,945 0.35%
Grazing modified pastures 467,048 6.1%
Dryland cropping 342,551 4.4%
Dryland horticulture 605 0.01%
Irrigated pastures 7,817 0.10%
Irrigated cropping 13,940 0.18%
Irrigated horticulture 4,586 0.06%
Intensive horticulture and animal plant production 1,124 0.01%
Urban intensive uses 26,808 0.35%
Rural residential and farm infrastructure 20,958 0.27%
Mining and waste 7,214 0.09%
Water 314,826 4.1%
Total 7,704,360 100%

Links and downloads

Land Use Information for Australia brochure

Land Use in​ Australia at a Glance​​​

Catchment Scale Land Use on the National Map​

  • Definitions
Thanks for your feedback.
Thanks! Your feedback has been submitted.

We aren't able to respond to your individual comments or questions.
To contact us directly phone us or submit an online inquiry

CAPTCHA
This question is for testing whether or not you are a human visitor and to prevent automated spam submissions.

Please verify that you are not a robot.

Skip

Footer

  • Contact us
  • Accessibility
  • Disclaimer
  • Privacy
  • FOI
Last updated: 01 July 2022

© Department of Agriculture, Fisheries and Forestry

We acknowledge the Traditional Owners of country throughout Australia and recognise their continuing connection to land, waters and culture. We pay our respects to their Elders past, present and emerging.