The Land use of Australia Web Map is an interactive map displaying land use data, which provides the spatial representation how our land resources are used.
The data is this web map is superseded. For the most current data for land use of Australia see the Land use of Australia 2010-11 to 2020-21. This will be updated later in 2025.
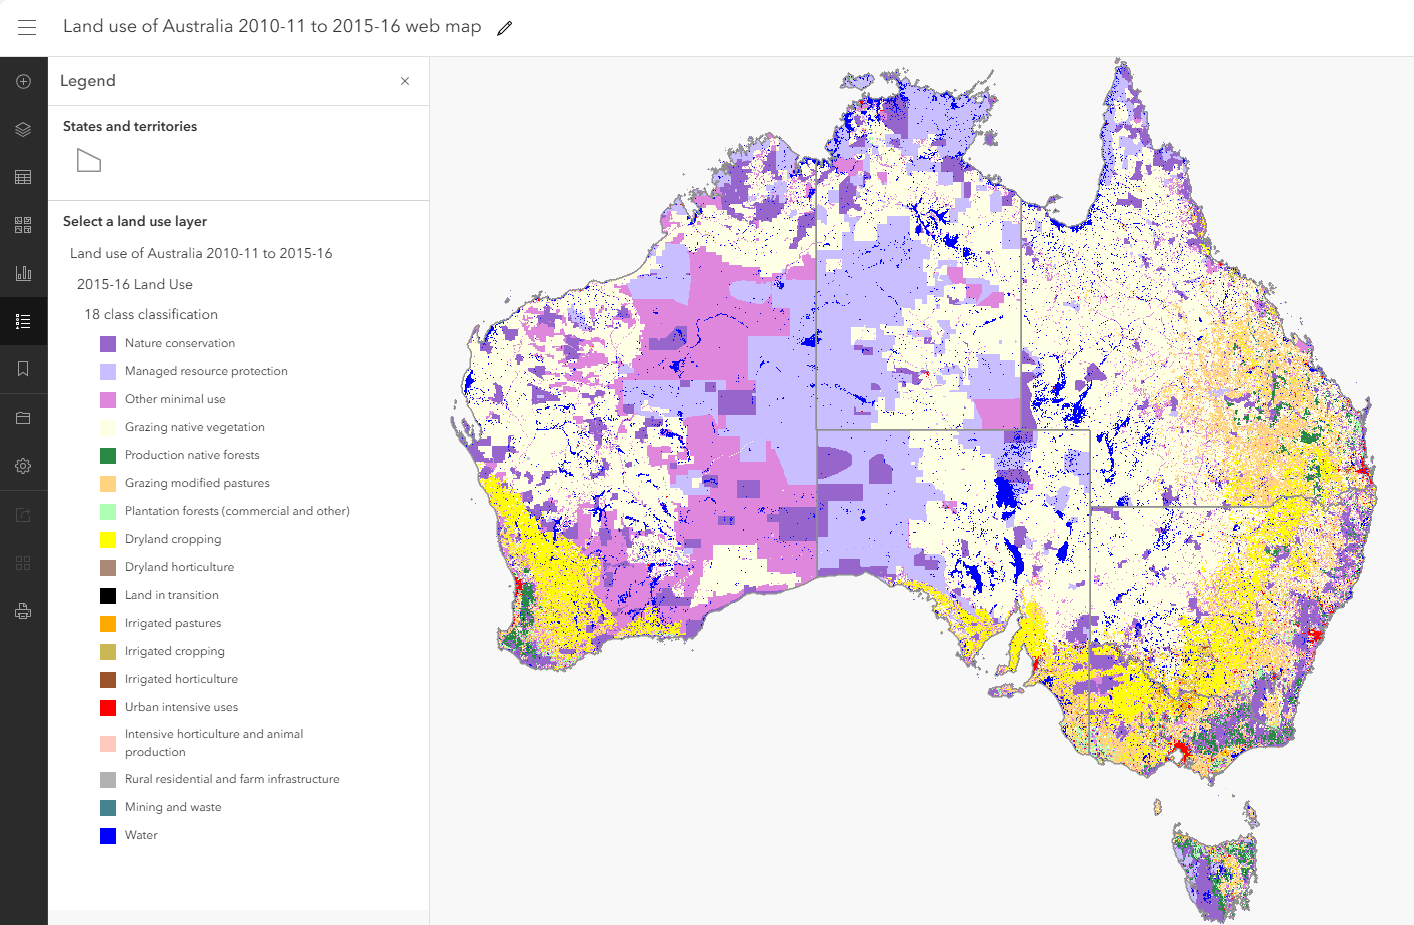
The Web Map displays data from Land use of Australia 2010–11 to 2015–16, 250 m dataset and includes land use data for both 2010–11 and 2015–16, and the change between the two years. The web map also displays states and territories, ABS Statistics Area Level 2 (SA2) regions, Federal electoral division boundaries, Local Government Areas, About my region boundaries, Australia Agricultural and Grazing Industries Survey (AAGIS) regions, Natural Resource Management Regions and the Australian rangelands.
Open the Land Use of Australia Web Map in a new Window.