
Author: Linden Whittle
Australia’s forests are diverse, extensive, and highly regarded for their ecological, economic and social values.
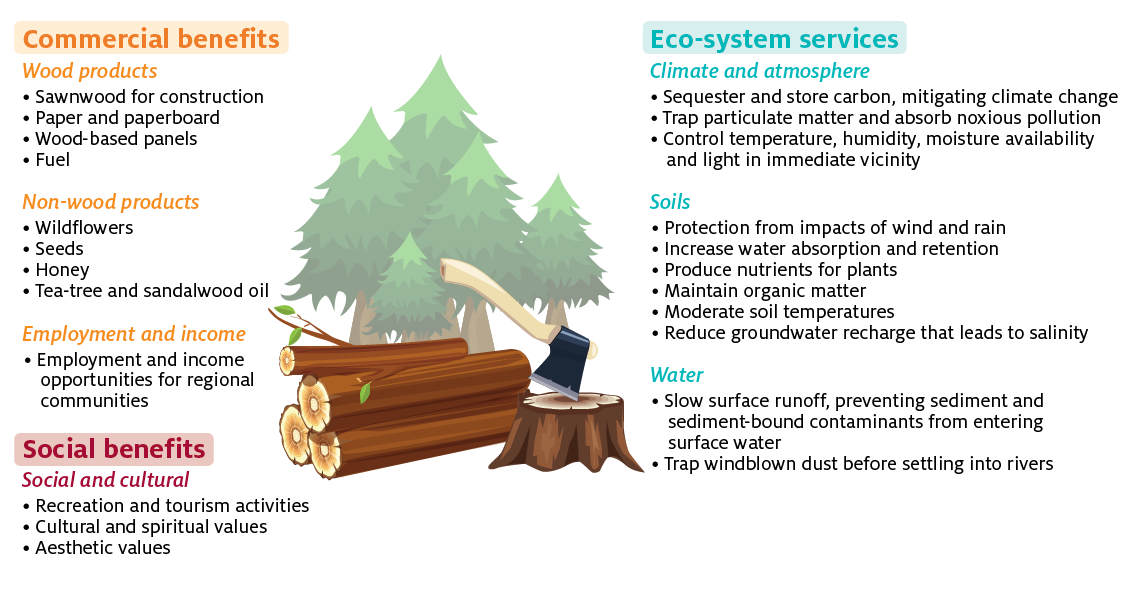
In addition to producing a range of wood and non-wood products (for example, oils) forests also provide valuable ecosystem services—such as carbon sequestration and storage, soil and water protection, and wildlife habitat—and provide aesthetic, recreational and spiritual value.
[expand all]
Contribution to the Australian economy
Australia harvests logs from native forests, hardwood plantations and softwood plantations. Logs harvested from different forest types have different physical characteristics and are used for different purposes.
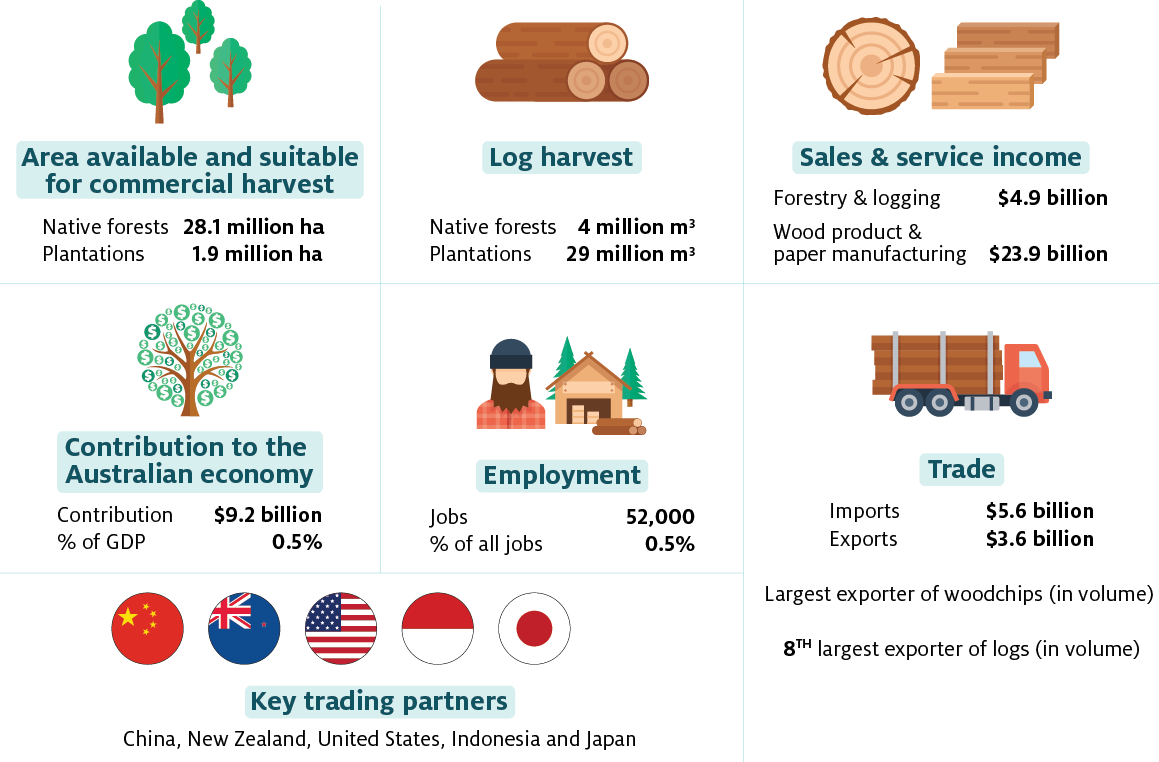
In 2017–18 32.9 million m3 of logs were harvested in Australia, generating $4.9 billion in sales and service income across the forestry and logging industries.
In the same year, downstream wood product manufacturing industries generated $23.9 billion in sales and according to the latest housing and population census these industries supported over 52,000 jobs in 2016.
Taking into account the cost of intermediate goods and services purchased, the forest and wood product manufacturing industries are estimated to have added $9.2 billion (0.5%) to the national economy in 2017–18. This is the total value of profits earned and wages paid to workers in the industry.
While the total volume of logs harvested in Australia is small compared to countries such as the United States, Canada and Russia, Australia was the second largest exporter of woodchips (in value terms) and the 8th largest exporter of whole logs (in volume terms) in 2017–18. The vast majority of Australia’s log and woodchip exports currently go to China but Australia also exports woodchips to Japan and paper products to New Zealand. Over the last decade Australia has imported processed wood products from many countries including China, the United States, Indonesia and Malaysia.
Forest policy
The harvesting of native forests is closely regulated in Australia through Commonwealth Regional Forest Agreements (RFAs) and state and territory legislation. RFAs are 20-year plans that seek to balance the economic, social and environmental benefits of forests (Figure 1). They ensure certainty of log supply to industry, sustainable forest management and preservation of forest conservation areas. Each state or territory also has its own legislation designed to ensure the conservation and sustainable management of native forests.
Plantations are regulated through state and territory legislation but significant plantation reforms commenced at the national level with the 1992 National Forest Policy Statement. In 1997, the Commonwealth launched Plantations for Australia: the 2020 Vision which had the primary objective of expanding the plantation estate. One of the main strategies to achieving this was to attract private investment through favourable tax arrangements under the Managed Investments Scheme Act 1998.
Forests are abundant
Native and plantation forests are spread throughout Australia, particularly along the south and east coasts, Western Australia and Tasmania (Figure 2).
In 2015–16 there were around 132 million hectares of native forest. However, only 28 million hectares were available and suitable for commercial harvesting and only a fraction of this was actually harvested. For example, only 1.5% of the 5 million hectares of net harvestable area of public native forests was actually harvested in 2015.
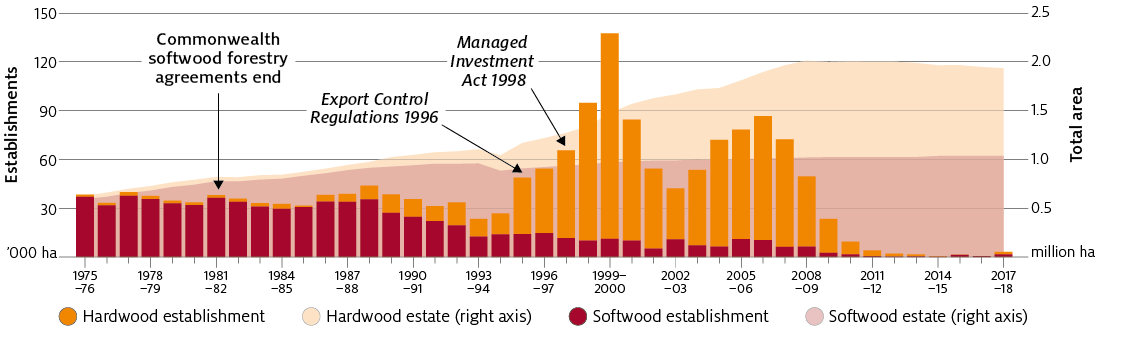
The area of commercial timber plantations in Australia is much smaller than that of native forests— around 1.9 million hectares in 2017–18 (Figure 3). However, plantations are managed more intensively than native forests and produce a much higher volume of wood per hectare per year.
Much of the historical growth in the plantation estate was driven by state and territory government investment in softwood species on cleared native forests. The establishment of these plantations was assisted by low interest loans from the Australian Government to State and Territory governments in the 1960s and 1970s.
Since 1995–96 almost all growth in the plantation estate was the result of rapid expansion of the hardwood plantation estate, which was associated with the removal of exports controls on hardwood woodchips (Export Control (Hardwood Wood Chips) Regulations 1996) and the Managed Investments Act 1998. This allowed investors to claim immediate tax deductions for investment costs associated with establishing new timber plantations. In 2008–09 several companies using managed investment schemes for funding collapsed and establishment rates for hardwood plantations declined substantially.
While the vast majority of the plantation estate is replanted after harvest, a small area is converted to other land uses each year. In recent years, these areas have exceeded new establishments, resulting in a decline in the total plantation estate.
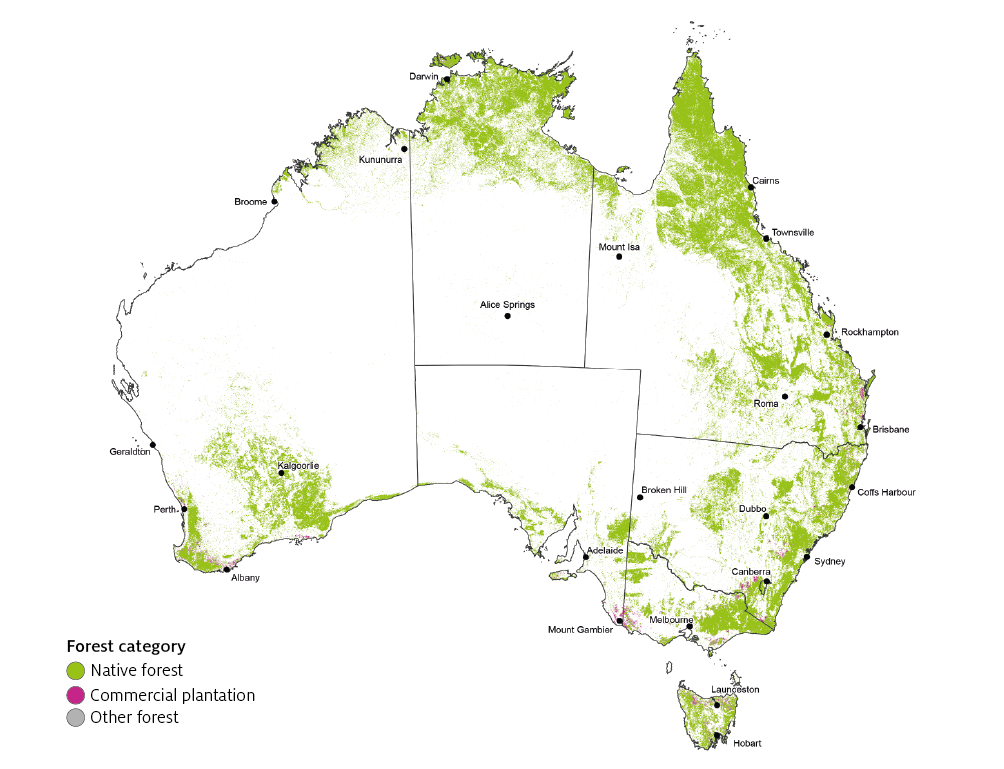
Note: ‘Other forest’ may not be visible at this scale.
Source: Montreal Process Implementation Group for Australia and National Forest Inventory Steering Committee (2018)
Log harvest
In 2017–18 a total of 32.9 million m3 of logs were harvested in Australia, comprising 17.4 million m3 of softwood plantation logs, 11.3 million m3 of hardwood plantation logs and 4.3 million m3 of native forest logs (Figure 4). The total value of logs harvested is currently the highest on record, reaching almost $2.7 billion in 2017–18.
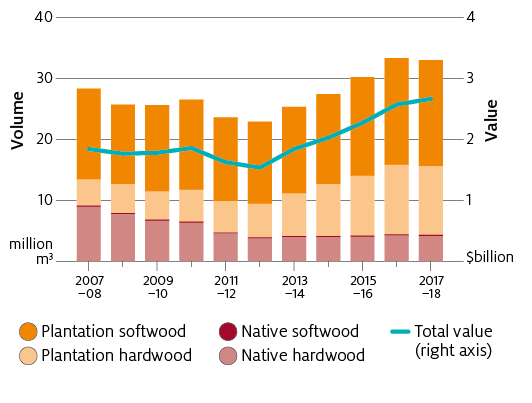
Plantations have become an increasingly important source of logs in Australia in the last decade with the share of logs harvested from plantations increasing from 68% in 2007–08 to 88% in 2017–18. This has largely been the result of hardwood plantings established in the late 2000s reaching maturity as well as a decline in the area of native forest available for harvesting.
Logs harvested from native forests, hardwood plantations and softwood plantations are not always directly substitutable for one another. This is because of differences in species, age and silvicultural practices which affect the properties of the wood and what they can be used for. For example, many consumers have a preference for hardwood over softwood sawnwood when it comes to appearance applications and the different characteristics of hardwood and softwood pulp make them suitable for different paper and paperboard products. Also, the uniformity of plantation pulplogs reduces processing costs and makes them better suited for use in paper and wood-based panel manufacturing.
Log harvest by use
Almost all softwood plantations in Australia are managed for sawlog production with rotation lengths of 25 to 30 years. Most softwood sawlogs harvested in Australia are processed domestically to produce sawnwood for residential construction and furniture manufacturing. However, some sawlogs are exported for processing overseas.
Softwood plantations also produce lower grade pulplogs as a by-product of thinning and final harvest operations. Softwood pulplogs are typically converted into woodchips to be used in paper and wood-based panel manufacturing domestically or overseas (Figure 5).
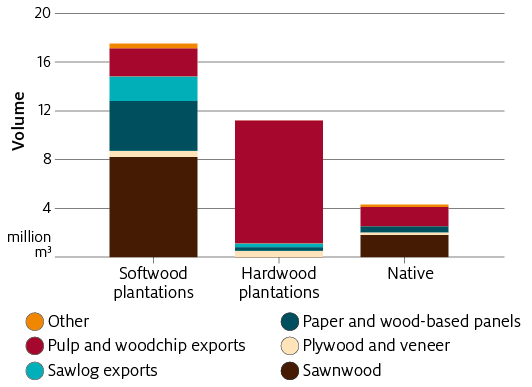
In contrast, almost all of the hardwood plantation estate in Australia is managed for pulplog production, with forest stands being harvested once every 10 to 15 years. In 2017–18 almost all (95%) hardwood plantation logs were exported whole or as woodchips (Figure 5). There is limited demand for hardwood woodchips in Australia as many of the panel and paper products produced in Australia utilise softwood fibre instead.
Native forests are similar to softwood plantations in that both sawlogs and pulplogs are harvested but native forest stands are harvested much less frequently—once every 60 to 100 years. Also, given limited demand for hardwood pulp in Australia, a much larger proportion of pulplogs harvested from native forests are exported whole or as woodchips, rather than used domestically (Figure 5).
Production and consumption of final wood products
Australia produces a range of wood products from logs processed domestically. In 2017–18 this included 3.9 million m3 of softwood sawnwood, 0.7 million m3 of hardwood sawnwood, and 3.2 million tonnes of paper and paperboard products (Figure 6). Data on the total volume of wood-based panel production is not available for 2017–18 but was estimated to be around 1.7 million m3 for selected products in 2016–17.
Note: Panels includes plywood, particleboard and medium density fibreboard for 2016–17. Paper and paperboard, and woodchips are measured in kilotonnes while all other products are measured in cubic metres.
Source: ABARES (2019)
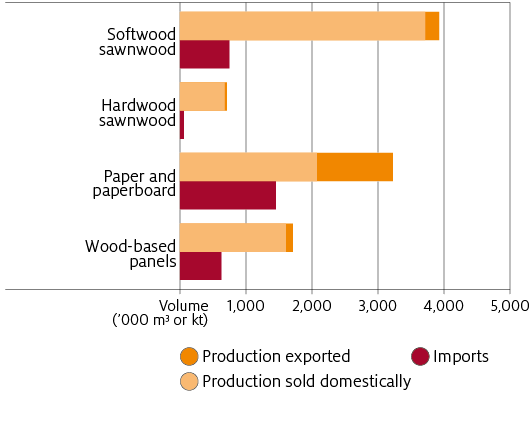
Most of Australia’s production of sawnwood and wood-based panels is sold in domestic markets but over a third of paper and paperboard production is exported. A significant share of domestic consumption of sawnwood, wood-based panels, and in particular paper and paperboard, is met through imports.
The specific types of products Australia produces and imports, within the same broad product group, differ. For example, Australia tends to produce and export packaging and newsprint paper products while importing household and sanitary paper, and printing and writing products.
Trade in wood products is growing
Access to international markets is crucial to the sustainability and profitability of the Australian forest and wood processing industries. Export opportunities allow domestic growers and processors to take advantage of increasing overseas demand and manage fluctuations in log availability and domestic demand—while imports provide the industry and consumers access to cheaper goods that are not produced in sufficient quantity in Australia.
The total value of trade in forest and wood products has increased substantially over the last 5 years (Figure 7). Since 2012–13, exports have risen by 76% to $3.6 billion while imports have risen by 36% to $5.6 billion.
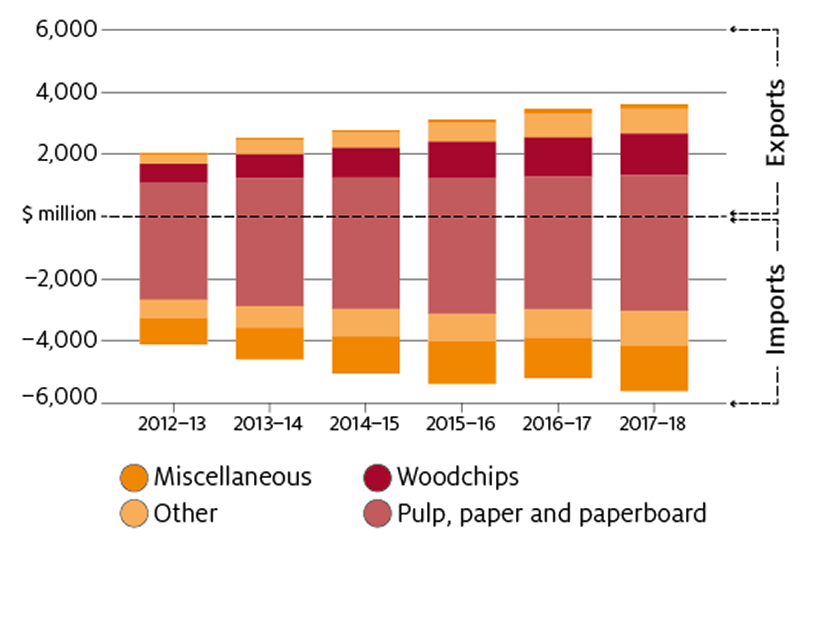
Source: ABARES (2019)
Growth in exports has been primarily driven by growth in log and woodchip exports to China while the increase in imports is largely associated with miscellaneous products such as builders’ carpentry and mouldings.
The wood processing industry is consolidating
Industry structure
Australia’s wood processing industry is diverse, with mills of all types and sizes producing a wide range of wood products.
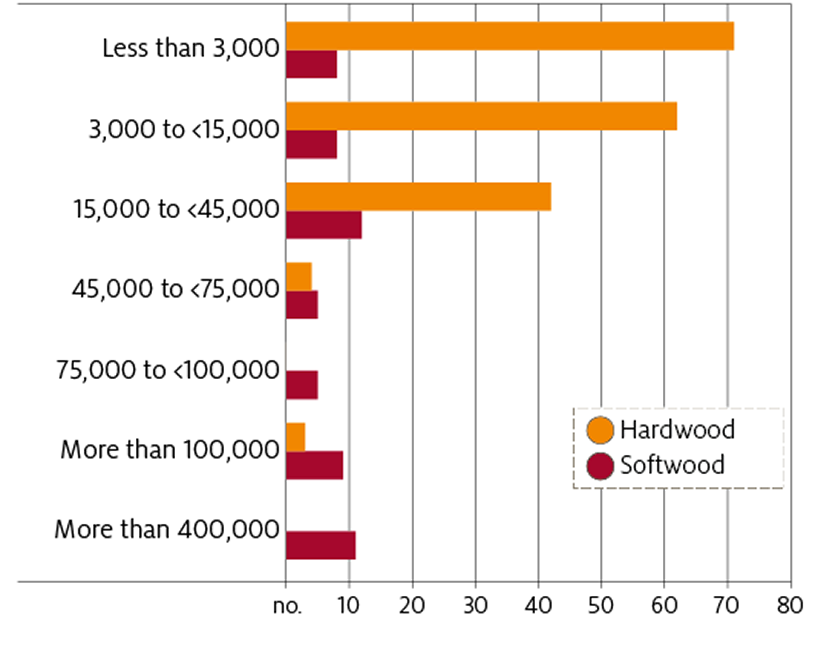
In 2016–17 there were around 257 sawmills, 23 wood-based panel mills and a small number of pulp and paper facilities. Of the 257 sawmills in Australia, 182 processed hardwood sawlogs, 58 processed plantation softwood sawlogs, and 17 processed cypress pine (a softwood) from native forests.
While there are more hardwood sawmills than softwood sawmills in Australia, hardwood sawmills tend to be much smaller in size. In 2016–17 only 4% of hardwood sawmills (compared to 52% of softwood sawmills) had an annual log input capacity greater than 45,000 m3 a year, while all of the largest sawmills in Australia (capable of processing more than 400,000 m3 a year) were softwood sawmills (Figure 8).
The reason hardwood sawmills tend to be smaller than softwood sawmills is because the native forest resource (the primary source of hardwood sawlogs) is lower yielding and more dispersed. Concentrating hardwood sawmill processing capacity in a single area would require transporting logs over economically unviable distances.
Mill consolidation in the softwood sector
Consolidation is an important process in many industries—ensuring that resources are used in the most efficient way possible and ultimately improving the competitiveness of the industry.
Over the last 17 years there has been considerable consolidation in the softwood sawmill industry with more logs being processed by fewer, larger sawmills. For example, from 1999–00 to 2016–17, the number of softwood sawmills decreased by around 73% (from 279 to 75) while the volume of softwood sawlogs processed domestically increased by 27%. Most of the closures over this period were smaller mills, with annual processing capacities of less than 3,000 cubic metres (Figure 9).
In contrast, the hardwood sawmill sector has not undergone the same degree of consolidation with the number of sawmills and volume of logs processed both falling.
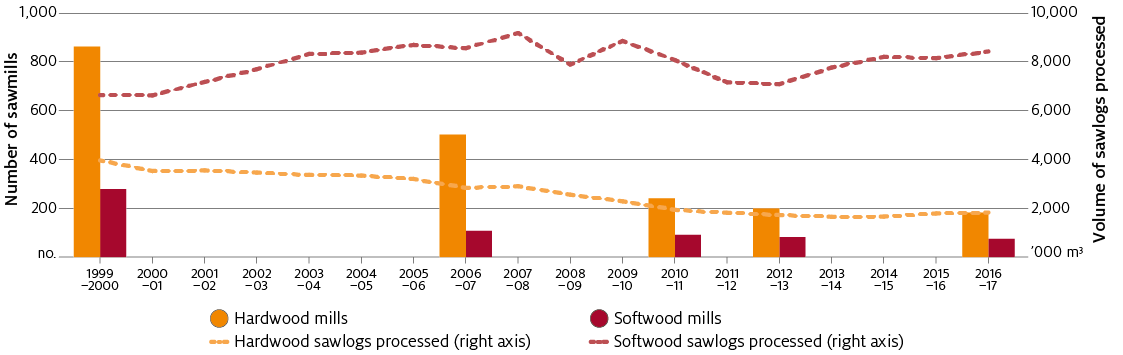
Note: Excludes post and pole mills; softwood includes cypress pine; sawlog harvest excludes estimates of sawlog exports.
Source: Downham et al. (2019)
Demand for logs will continue to grow
Demand for logs (and in particular softwood sawlogs) is expected to grow over the coming decades as Australia’s demand for new housing increases.
In a recent report, ABARES estimated that the total volume of softwood sawlogs available to the domestic market could fall short of demand in 2050 by 3.4 million m3 per year if log exports remain at 2015–16 levels. This has raised concerns that the industry could be missing out on opportunities for growth that may be taken up by other countries or industries.
To explore these issues the Government released the report Growing a better Australia: A billion trees for jobs and growth in 2018, outlining a plan to assist the forest industries to meet future challenges. The plan focusses on the creation of regional forest hubs, reducing barriers to expansion and extracting greater value from forest products. In addition, the Government will also provide up to $500 million dollars in concessional loans and review policies to promote expansion of the plantation estate.
References
ABARES 2018, Australian forest and wood products statistics, March and June quarter 2018, Australian Bureau of Agricultural Resource Economics and Sciences, Canberra, June.
——2019, Australian forest and wood products statistics, September and December quarter 2018, Australian Bureau of Agricultural Resource Economics and Sciences, Canberra, June.
Downham, R, Gavran, M & Frakes, I 2019, ABARES National Wood Processing Survey: 2016–17, ABARES technical report 19.3, Canberra, June. CC BY 4.0. https://doi.org/10.25814/5cf8ebadb377f
Food and Agriculture Organisation of the United Nations 2019, FAOSTAT Database, accessed 10 October 2019
Montreal Process Implementation Group for Australia and National Forest Inventory Steering Committee, 2018, Australia’s State of the Forests Report 2018, ABARES, Canberra, December. CC BY 4.0.
Whittle, L, Lock, P & Hug, B 2019, Economic potential for new plantation establishment in Australia: outlook to 2050, ABARES research report, Canberra, February. CC BY 4.0. https://doi.org/10.25814/5c6e1da578f9a