
Key issues
- For the week ending 6 September 2023, thunderstorms brought showers to the east coast and a front brought showers to southern parts of the country.
- Across cropping regions, rainfall totals of up to 10 millimetres were recorded in the eastern fringes of Queensland and New South Wales, southern Victoria, northern and central Western Australia and across South Australia, while southern areas Western Australia received up to 50 millimetres. Given the lack of rainfall across most cropping regions in New South Wales and Queensland, these regions are continuing to see a gradual decline in soil moisture reserves. This represents an increased risk of declines in crop yields if follow-up rainfall is not received in the next few weeks (see Section 1.1).
- Rainfall during August 2023 was around 50% below the long-term average at a national level. In cropping regions, August rainfall was extremely low to below average in western and northern parts of Western Australia, across large areas of South Australia and Queensland, northern New South Wales and southern Victoria. With a continuous decline in the sub-soil moisture seen across numerous regions and above average day-and nighttime temperatures, the below average August rainfall has exposed crops to increased moisture stress (see Section 1.2).
- For the 3 months to August 2023 pasture growth was above average to extremely high across large areas of western New South Wales, central Victoria, eastern Tasmania, and in scattered areas of South Australia, central and northern Western Australia, and southern Northern Territory. This growth is likely to enable farmers to maintain stock numbers. In contrast, modelled pasture growth was extremely low to below average across scattered areas of western and southern Western Australia and in eastern Queensland and New South Wales. These below average levels of pasture growth have likely seen a shift from maintaining livestock number to a period of destocking (see Section 1.4).
- Over the next 8-days, isolated showers are expected to bring some rainfall to southern parts of the country, elsewhere the next 8-days is expected to be mainly dry conditions (see Section 1.6).
- Across most cropping regions, rainfall totals of up to 15 millimetres are expected in Western Australia, Victoria and New South Wales, with up to 25 millimetres in South Australia. The falls in southern areas are expected to benefit to crops and pastures. Following a dry August and given the current well below average levels of soil moisture, crops and pastures in Queensland, northern New South Wales and northern Western Australia will be disposed to heat and moisture stress, negatively affecting production potential (see Section 1.6).
- Water storage levels in the Murray-Darling Basin (MDB) increased between 31 August 2023 and 7 September 2023 by 32 gigalitres (GL). Current volume of water held in storage is 20 705 GL. This is 3 percent or 664 GL less than at the same time last year.
- Allocation prices in the Victorian Murray below the Barmah Choke increased from $155 on 31 August 2023 to $173 on 7 September 2023. Prices are lower in the Goulburn-Broken due to the binding of the Goulburn intervalley trade limit.
Climate
For the week ending 7 September 2023, thunderstorms brought showers to the east coast and a front brought showers to southern parts of the country. A high-pressure system kept the remainder of the country dry and clear.
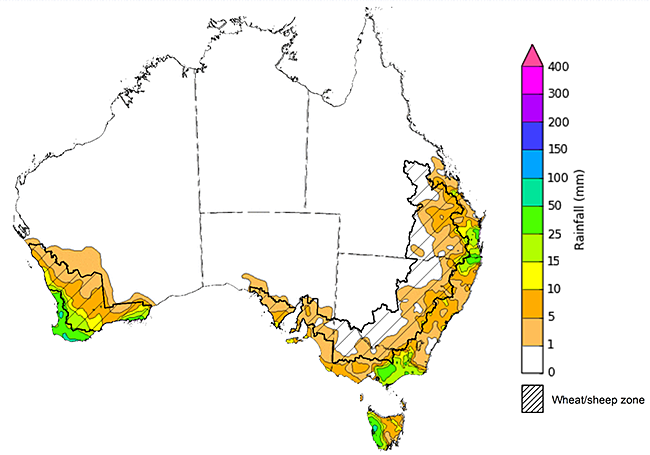
Across cropping regions, rainfall totals of up to 10 millimetres were recorded in the eastern fringes of Queensland and New South Wales, southern Victoria, northern and central Western Australia and across South Australia, while southern areas Western Australia received up to 50 millimetres. Given the lack of rainfall across most cropping regions in New South Wales and Queensland, these regions are continuing to see a gradual decline in soil moisture reserves. This represents an increased risk of declines in crop yields if follow-up rainfall is not received in the next few weeks.
Rainfall for the week ending 6 September 2023
Note: The rainfall analyses and associated maps utilise data contained in the Bureau of Meteorology climate database, the Australian Data Archive for Meteorology (ADAM). The analyses are initially produced automatically from real-time data with limited quality control. They are intended to provide a general overview of rainfall across Australia as quickly as possible after the observations are received. For further information go to http://www.bom.gov.au/climate/rainfall/
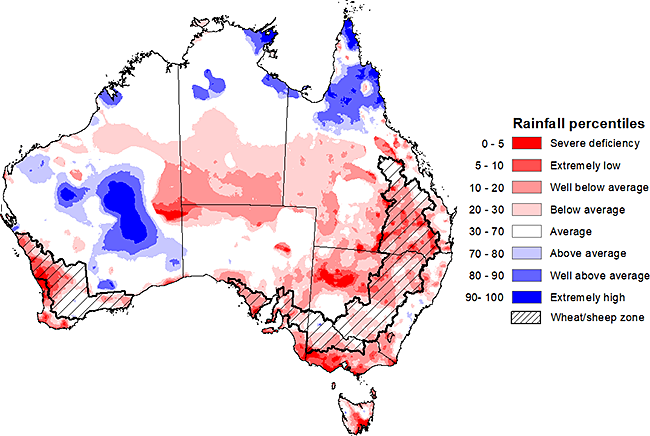
Rainfall during August 2023 was highly variable and close to 50% below the long-term average at a national level and 10th driest on record for the month of August. It was below average for the lower two-thirds of Queensland, most of New South Wales, Victoria and Tasmania, parts of South Australia, southern Northern Territory, and parts of eastern and south-western Western Australia.
In cropping regions, August rainfall was extremely low to below average in western and northern parts of Western Australia, across large areas of South Australia and Queensland, northern New South Wales and southern Victoria. Average rainfall was recorded in parts of southern New South Wales, northern Victoria and southern Western Australia. With a continuous decline in the sub-soil moisture seen across numerous regions and above average day-and nighttime temperatures, below average August rainfall has exposed crops to increased moisture stress.
Rainfall percentiles for August 2023
Upper layer soil moisture in August 2023 was above average to extremely high for the tropical north of Australia and central Western Australia. It was extremely low to below average for southwestern Western Australia, isolated areas in South Australia, large areas in northern New South Wales, southern Queensland and southern Victoria, as well as in eastern Tasmania. August upper layer relative soil moisture levels were generally average in the remaining areas.
At this time of year, upper layer soil moisture is less critical for well-established winter crops. However, upper layer soil moisture will be critical for supporting the germination and establishment of summer crops in the coming months. In cropping regions, upper layer soil moisture was generally below average to extremely low. However, it was close to average across southern New South Wales, much of Victoria and parts of eastern South Australia and eastern and southern Western Australia. Average levels to above average of soil moisture would have supported winter crops crop yield potential especially in those areas that have seen a decline in lower layer soil moisture in recent months. However, extremely low upper layer soil moisture across northern New South Wales and much of Queensland present a significant production risk to summer crops and pasture growth.
Modelled upper layer soil moisture for August 2023
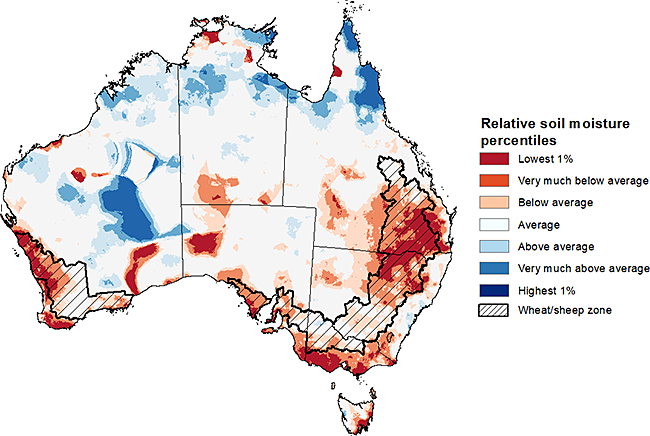
Source: Bureau of Meteorology (Australian Water Resources Assessment Landscape model)
Relative lower layer soil moisture for August 2023 was highly variable across Australia. It was above average across most of northern and central Australia. Relative lower layer soil moisture was very much below average for much of south-eastern Queensland, north-eastern and coastal New South Wales, western and south-eastern Western Australia, southern South Australia, and in eastern Victoria and Tasmania. Relative lower layer soil moisture was average elsewhere.
Lower layer soil moisture is a larger, deeper store that is slower to respond to seasonal conditions and tends to reflect the accumulated effects of events that have occurred over longer periods. Lower layer soil moisture will be important for winter crops as they enter flowering and grain filling over the coming months, particularly given the warm and dry spring rainfall outlook. In cropping regions, lower layer soil moisture was extremely low to below average across much of Queensland, northern and central Western Australia and most of South Australia. It was generally average in Victoria, southern Western Australia and southern New South Wales and in eastern South Australia. Areas with below average levels of lower layer soil moisture will be highly dependent on timely and sufficient in-season rainfall to support current levels of winter crop production. A lack of lower layer moisture will also weigh on crop and livestock producers’ decision-making as we enter the spring and summer crop planting season and peak pasture growth period.
Modelled lower layer soil moisture for August 2023
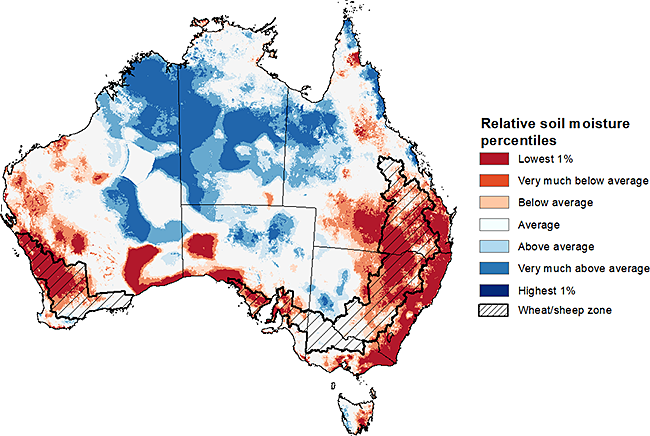
Source: Bureau of Meteorology (Australian Water Resources Assessment Landscape model)
Pasture growth during the June to August period is low across large areas of central and northern Australia as it enters a seasonally low growth period due to typically cooler temperatures and little to no rainfall. Across southern Australia, June to August pasture growth influences the number of livestock than can be supported without supplementary feeding over winter and the level of reliance on hay and grain during this period.
Modelled pasture growth was above average to extremely high across large areas of western New South Wales, central Victoria, eastern Tasmania, and in scattered areas of South Australia, central and northern Western Australia, and southern Northern Territory. This growth is likely to enable farmers to continue to maintain stock numbers and provide opportunities to replenish fodder supplies during spring.
In contrast, modelled pasture growth was extremely low to below average across large areas of western and southern Western Australia and in eastern Queensland and eastern New South Wales. These below average levels of pasture growth have likely seen a shift from maintaining livestock number to a period of destocking. Given a relatively dry winter season, livestock producers in areas with below average pasture availability will require substantial rainfalls through spring to build soil moisture level and encourage pasture growth during the springtime peak, or switch to an extensive supplementary feeding program to maintain current stock numbers and avoid further destocking.
Relative pasture growth for 3-months ending August 2023 (1 June 2023 to 31 August 2023)
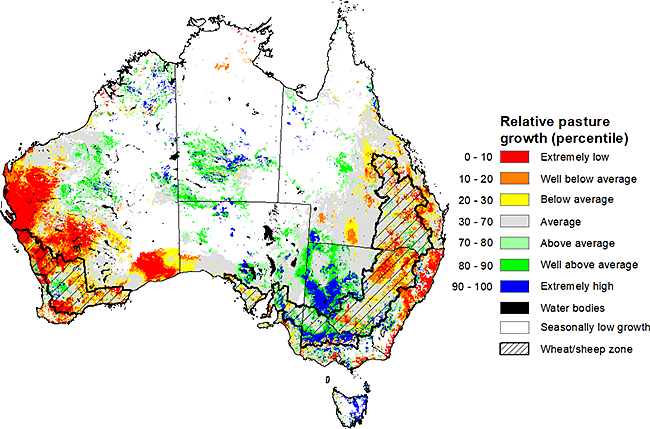
Source: Queensland Department of Science, Information Technology, and Innovation.
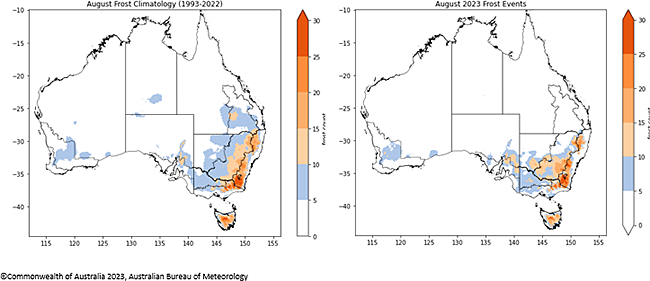
Frost occurs on clear nights during winter and early spring when the air temperature drops to 2°C or less and is most pronounced in the southern and eastern agricultural regions. The weather events that typically generate damaging frosts is from the passage of cold fronts, followed by cold southerly winds and a high-pressure ridge. The severity and extent of subsequent damage is variable across the landscape. Crop damage from frost may occur at any stage of development but is most damaging around flowering and grain filling in spring. In August, crops are in the flowering stage and are at high risk of frost damage.
Severe frosts (minimum temperatures below -2°C) can cause freezing damage to crop when there is rapid ice crystal formation form within the tissue. The ice crystals physically rupture cell walls and membranes within the cells causing physical damage. Damage can be seen once thawed as dark green water-soaked areas. Ten days after a frost event bleached leaves, stems and reproductive tissue might be evident depending on the growth stage of the crop.
Based on the 30-year (1993-2022) climatology for August, much of the southern Australia records less than 10 days of frosty conditions. In eastern Australia, up to 25 days of frost events can be seen in the eastern New South Wales, Victoria and Tasmania, up to 15 days in southern Queensland and in scattered areas of eastern South Australia. Over 25 days of frost events can be expected in southern New South Wales and eastern Victoria alpine regions and in central Tasmania. Across cropping regions, on average there are up to 15 frost events, except for along the eastern margins of New South Wales and isolated parts of southern and western Queensland where it can experience up to 20 frost events.
During August 2023, fewer than average potential frost events were recorded across cropping regions in Queensland, Victoria and northern New South Wales, while twice the average number of potential frost events were recorded in central New South Wales. Depending on the growth stage of crops and the severity and length of time crops were subjected to frost, this presents a localised risk to crop production potential in these areas.
Number of days with minimum temperature below 2°C in August
Over the 8-days to 14 September 2023, fronts and troughs are expected to bring isolated showers to southern parts of the country. A high-pressure system is expected to bring mainly dry conditions to the remainder of the country.
Across cropping regions, rainfall totals of up to 15 millimetres are expected in Western Australia, Victoria and New South Wales, with up to 25 millimetres in parts of South Australia. Minimal rainfall is expected in Queensland over the next 8-days. The expected falls in southern areas will be of some benefit to crops and pastures. However, following a dry August, and given the current well below average levels of soil moisture, crops and pastures in Queensland, northern New South Wales and northern Western Australia will be disposed to heat and moisture stress, negatively affecting production potential.
Total forecast rainfall for the period 7 September 2023 to 14 September 2023
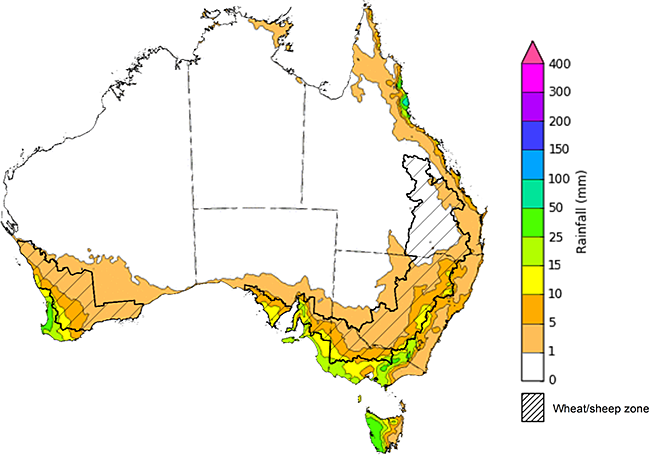
Note: This rainfall forecast is produced from computer models. As the model outputs are not altered by weather forecasters, it is important to check local forecasts and warnings issued by the Bureau of Meteorology.
Water
Water storages, water markets and water allocations - current week
The Tableau dashboard may not meet accessibility requirements. For information about the contents of these dashboards contact ABARES.

Commodities
Information on weekly price changes in agricultural commodities is now available at the Weekly commodity price update.