
Key issues
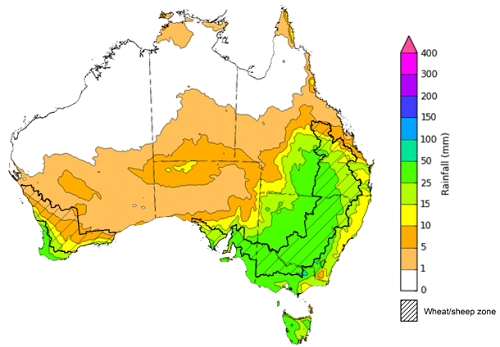
- For the week ending 7 September 2022, tropical moisture combined with a range of weather systems to produce significant rainfall over large parts of the country. Weekly rainfall totals exceeding 50 millimetres mm were recorded in inland areas of Western Australia and southern Queensland as well as along the northern coastline of New South Wales. Meanwhile, high-pressure systems over remaining parts of the country resulted in clear, dry conditions.
- Modelled pasture growth was above average to extremely high across large areas of New South Wales, western Victoria, southern and central Queensland, large areas of Western Australia and parts of eastern and southern South Australia. This growth is likely to enable farmers to continue to rebuild stock numbers and provide opportunities to replenish fodder supplies during spring.
- The Australian Bureau of Meteorology’s El Niño-South Oscillation (ENSO) Outlook remains at La Niña ALERT, with a 70% likelihood of a La Niña event forming over the coming months (triple the normal probability). A negative Indian Ocean Dipole (IOD) event is underway in the tropical Indian Ocean, and the Southern Annular Mode (SAM) is currently positive and expected to remain positive over the coming months. These climate drivers are associated with above average rainfall across parts of eastern Australia.
- The outlook for October to December 2022 suggests there is a 75% chance of rainfall totals between 50 and 200 millimetres across Victoria, most of New South Wales, Queensland and the Northern Territory, southern parts of South Australia, the south-west and far north of Western Australia and Tasmania. Rainfall totals in excess of 200 millimetres are forecast for alpine areas in New South Wales and Victoria, as well as eastern New South Wales and Victoria, parts of eastern and northern Queensland, the far north of Western Australia and the Northern Territory, and western Tasmania.
- Over the 8-days to 15 September 2022, troughs, low-pressure and frontal systems are forecast to draw down moist, tropical air, resulting in showers and scattered storms across south-eastern and south-western Australia. High-pressure systems will provide clear, dry conditions across remaining parts of the country. Waterlogging and frost events remain the biggest potential downside risk to yields over the coming weeks. For the most part, above average soil moisture levels will support strong yield potentials, with crops flowering and grain filling as we enter spring.
- Water storage in the Murray–Darling Basin (MDB) increased by 89 gigalitres (GL) between 31 August 2022 and 7 September 2022. The current volume of water held in storage is 23,282 GL, which represents 92% of total capacity. This is 9% or 1,826 GL more than at the same time last year.
- Allocation prices in the Victorian Murray below the Barmah Choke decreased from $62 per ML on 25 August 2022 to $53 per ML on 2 September 2022. Prices are lower in the regions above the Barmah choke due to the binding of the Barmah choke trade constraint.
Climate
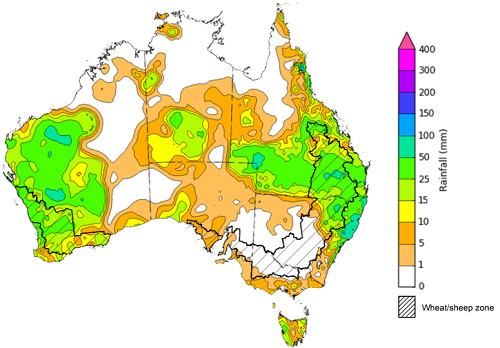
For the week ending 7 September 2022, tropical moisture combined with a range of weather systems to produce significant rainfall over large parts of the country. Weekly rainfall totals exceeding 50 millimetres were recorded in inland areas of Western Australia and southern Queensland as well as along the northern coastline of New South Wales. Meanwhile, high-pressure systems over remaining parts of the country resulted in clear, dry conditions.
In Australian cropping regions, rainfall totals of between 10 and 50 millimetres were recorded across north-eastern New South Wales, much of Queensland and Western Australia. Little to no rainfall was recorded across remaining cropping regions for the week ending 7 September 2022.
Moderate rainfalls across southern Queensland over the past week has likely seen a continuation of waterlogging in low lying areas given rootzone soil moisture levels are already well above average. Affected crops have already struggled due to exceptionally wet conditions thus far in the season. Moreover, the wet conditions across some cropping regions over recent weeks have limited field access for disease management and top dressing. Mostly dry conditions across other Australian cropping regions over the past week will have allowed soil moisture levels to subside reducing the risk of waterlogging.
The wet conditions have increased fungal disease pressure for winter crops, which may negatively impact yield potentials if not managed. As we enter spring, many producers that were unable to plant a winter crop will be keen to get their summer crop planting underway.
Rainfall for the week ending 7 September 2022
Pasture growth during the June to August period is typically low across large areas of central and northern Australia as it enters a seasonally low growth period due to cooler temperatures and little to no rainfall. Across southern Australia, June to August pasture growth influences the number of livestock than can be supported without supplementary feeding over winter and the level of reliance on hay and grain during this period.
For the months to August 2022, above average rainfall totals and mild winter temperatures resulted in well above average pasture production for this time of year across most grazing regions.
Modelled pasture growth was above average to extremely high across large areas of New South Wales, western Victoria, southern and central Queensland, large areas of Western Australia and parts of eastern and southern South Australia. This growth is likely to enable farmers to continue to rebuild stock numbers and provide opportunities to replenish fodder supplies during spring. In contrast, modelled pasture growth was extremely low to below average across scattered areas of central New South Wales, parts of south-eastern Queensland, eastern South Australia, and parts of the southwest and southeast of Western Australia.
A dry start to winter and below average soil moisture levels in parts of the east of South Australia resulted in below average to average pasture growth. As a result, livestock producers in eastern South Australia will require substantial rainfalls through spring to build soil moisture levels and supplementary feed to maintain current stock numbers. In contrast waterlogging is likely to affected pasture growth rates across part of central New South Wales, southeast Queensland and the far southwest of Western Australia.
Relative pasture growth for 3-months ending August 2022 (1 June to 31 August 2022)
Source: Queensland Department of Science, Information Technology and Innovation
Throughout Australia’s spring period the climate drivers with the largest potential impact on Australia’s climate patterns are the El Niño–Southern Oscillation (ENSO), the Indian Ocean Dipole (IOD), the Southern Annular Mode (SAM) and the Madden-Julian Oscillation (MJO). These climate drivers are likely to influence pasture growth across southern Australia, the growth and yield prospects for winter crops, as well as the planting of summer crops across northern cropping regions.
The Australian Bureau of Meteorology’s ENSO Outlook remains at La Niña ALERT, with a 70% likelihood of a La Niña event forming over the coming months (triple the normal probability). While the ENSO currently remains neutral, sea surface temperatures over the central and eastern tropical Pacific Ocean remain below average and the Southern Oscillation Index and Pacific trade winds have maintained a La Niña-like pattern. This is consistent with the possible redevelopment of La Niña by November 2022. A negative IOD event is underway in the tropical Indian Ocean, and the SAM is currently positive and expected to remain positive over the coming months. The MJO is weakening over the western Indian Ocean. Given current and expected conditions, the negative IOD event, the positive SAM and the development of a La Niña event are likely to be the major influences on spring rainfall across Australia.
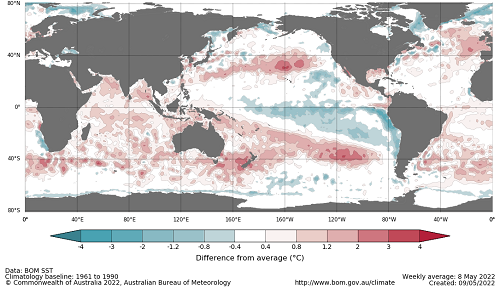
Sea surface temperature (SSTs) anomalies in the tropical Pacific Ocean close to the equator have remained below average across much of the equator. SSTs were slightly cooler than average over much of the tropical central and eastern Pacific south of the equator. A small pocket of weak warm anomalies remains in the eastern Pacific along the equator. Below average Pacific equatorial sea surface temperatures are associated with La Niña conditions.
Warm sea surface temperature anomalies continue across the eastern Indian Ocean and the southern Maritime Continent, while cool anomalies are present near the Horn of Africa and the north-west of the Indian Ocean basin. The temperature gradient established across the tropical Indian Ocean underpins the ongoing negative IOD event.
Difference from average sea surface temperature observations 22 August to 28 August 2022
Source: AMIS
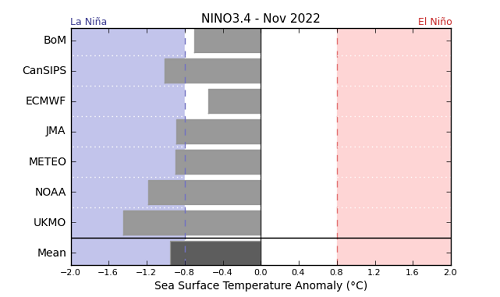
International climate model outlooks for the NINO 3.4 region in November 2022
Issued: 30/8/2021
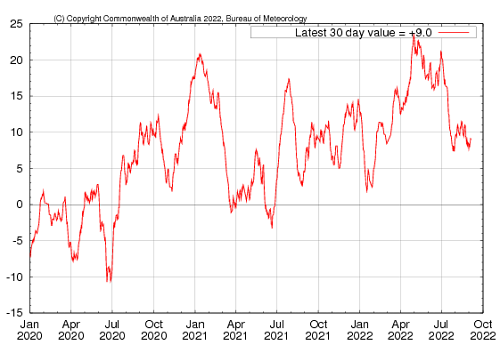
Five of the seven international models surveyed predict the formation of a La Niña event in November 2022, which is underpinned by atmospheric and oceanic indicators. For the period ending 5 September, the 30 day Southern Oscillation Index (SOI) value was 9.0 and the 90 day value for the period ending 28 August was 11.4, both of which are above the La Niña threshold of +7. La Niña events are associated with above average rainfall across eastern and northern Australia through spring and summer.
30-day Southern Oscillation Index (SOI) values ending 22 August 2021
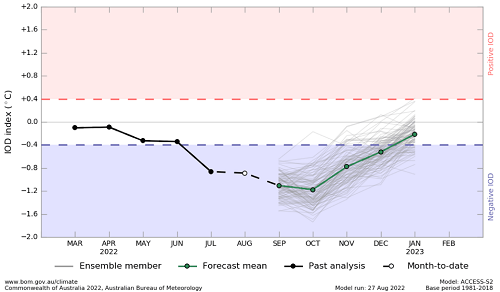
A negative IOD event continues in the Indian Ocean, with values exceeding the negative IOD threshold (−0.4 °C) since mid-June. Warmer than average water temperatures in the east of the Indian Ocean and cooler than average temperatures in the west are associated with above average rainfall across southern Australia throughout winter and spring, as well as the far north. It is also associated with the early onset of northern Australia rainfall.
As at 28 August 2022, the Indian Ocean Dipole (IOD) weekly value was -0.80°C. All international climate models surveyed by the Bureau of Meteorology predict the negative IOD event to persist throughout spring, then rapidly decay in early summer.
Monthly sea surface temperature anomalies for IOD region
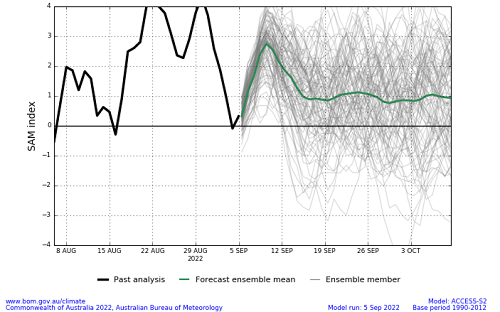
The Southern Annular Mode (SAM) has been predominantly positive over the past fortnight and is expected to remain positive over the coming weeks. The SAM refers to the north-south shift of the band of rain-bearing westerly winds and weather systems in the Southern Ocean compared to the usual position. A positive SAM in spring is associated with increased rainfall for parts of eastern New South Wales and Victoria as well as southern Queensland. It is also associated with decreased rainfall for parts of south-western and south-eastern Australia.
Southern Annular Mode (SAM) daily index
These climate outlooks are generated by ACCESS–S (Australian Community Climate Earth-System Simulator–Seasonal). ACCESS–S is the Bureau of Meteorology's dynamic (physics-based) weather and climate model used for monthly, seasonal and longer-lead climate outlooks.
For further information, go to http://www.bom.gov.au/climate/ahead/about/
The Bureau of Meteorology’s latest rainfall outlook indicates wetter than average conditions are expected across parts of Australia during October. The ACCESS-S climate model suggests there is close to a 60% chance of exceeding median for parts of eastern and northern Australia, with below median rainfall likely for the south-west and central parts of Western Australia.
The outlook for October 2022 indicates that there is a 75% chance of rainfall totals between 10 and 50 millimetres across much of New South Wales, eastern Queensland, Victoria, southern South Australia, the south-west of Western Australia, Tasmania, as well as isolated parts in the north of Western Australia and the Northern Territory. Rainfall totals in excess of 100 millimetres are expected across isolated areas of alpine New South Wales and Victoria, as well as western Tasmania.
Across cropping regions there is a 75% chance of rainfall totals of between 25 and 50 millimetres across eastern New South Wales, much of Queensland, southern Victoria and isolated parts of South Australia. There is a 75% chance of rainfall less than 25 millimetres for remaining parts of New South Wales, Queensland, Victoria and South Australia, as well as southern cropping regions of Western Australia. These falls are likely to be sufficient to support the current yield potential of winter crops and average or better pasture growth potential, given average to above average soil moisture level across most southern Australian growing regions.
Rainfall totals that have a 75% chance of occurring October 2022
Issued: 1/09/2022
The rainfall outlook for October to December 2022 suggests there is a greater than 65% chance of exceeding median rainfall across Victoria, most of New South Wales and Queensland, the south-east of South Australia, the north of the Northern Territory and eastern Tasmania. For remaining regions of Australia, there is no strong tendency towards above or below median rainfall, except for parts of eastern and south-western Western Australia where below median rainfall is likely between October and December 2022 (Bureau of Meteorology ‘National Climate Outlook’, 1 September 2022.
Bureau of Meteorology rainfall outlooks for October to December have greater than 55% past accuracy across most of Australia. Outlook accuracy is greater than 65% across most of New South Wales and Victoria, as well as parts of Queensland, South Australia and the Northern Territory. Past accuracy is low (less than 50%) for the south-west of Western Australia and parts of central Australia.
Chance of exceeding the median rainfall October to December 2022
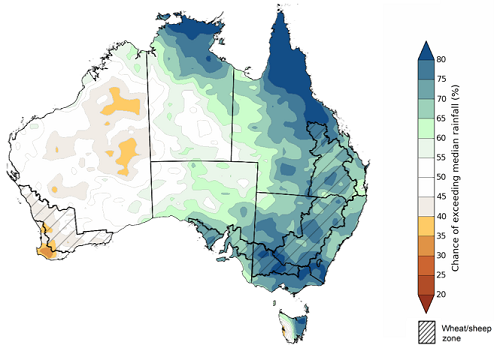
Issued: 1/09/2022
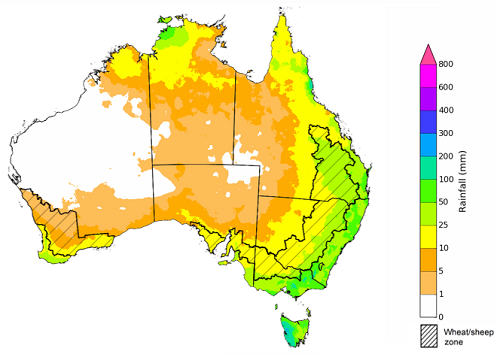
The outlook for October to December 2022 suggests there is a 75% chance of rainfall totals between 50 and 200 millimetres across Victoria, most of New South Wales, Queensland and the Northern Territory, southern parts of South Australia, the south-west and far north of Western Australia and Tasmania. Rainfall totals in excess of 200 millimetres are forecast for alpine areas in New South Wales and Victoria, as well as eastern New South Wales and Victoria, parts of eastern and northern Queensland, the far north of Western Australia and the Northern Territory, and western Tasmania.
Across cropping regions, there is a 75% chance of receiving between 50 and 100 millimetres across south-western New South Wales, north-western Victoria, much of South Australia and south-eastern parts of Western Australia. Totals of between 100 and 200 millimetres are expected across much of New South Wales and Queensland, and eastern Victoria.
Through spring, winter crop potentials are highly sensitive to extreme weather and water availability as they progress through critical stages of flowering and grain filling. Above average rainfall over the coming months in southern New South Wales, Victoria and South Australian cropping regions, combined with below average temperatures, is likely to support strong yield potentials for winter crops. In northern New South Wales and southern Queensland, winter cropping has already been heavily impacted by excessive moisture. Above average rainfall through spring increases the risk of waterlogging, negatively impacting crop development. As crops mature, a continuation of wet conditions may cause quality downgrades and delay harvesting. Moreover, the wet conditions are likely to interrupt planting of summer crops, which is expected to begin in Central Queensland over the coming weeks.
Rainfall totals that have a 75% chance of occurring October to December 2022
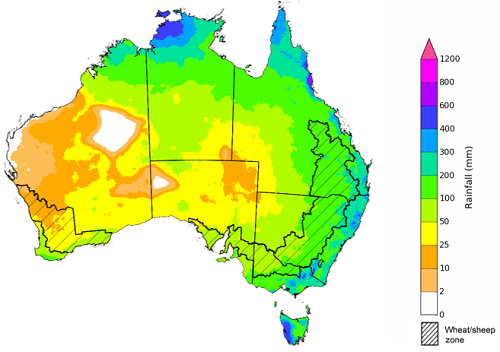
Issued: 1/09/2022
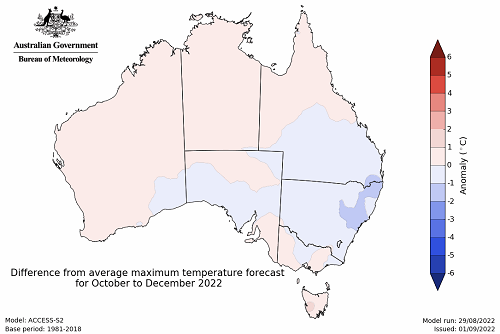
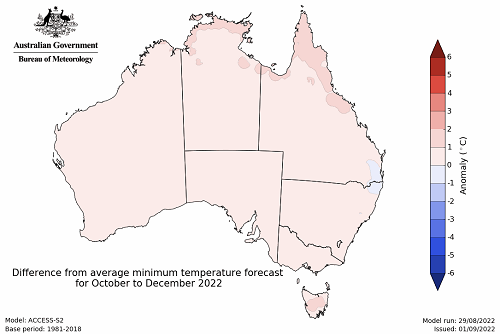
The temperature outlook for October to December 2022 indicates that maximum temperatures across most of Australia are likely to be close to the 1990-2012 average (the difference in the range of - 1°C to +1°C), with slightly lower than average maximum temperatures across north-eastern New South Wales and south-eastern Queensland. Minimum temperatures are expected to be slightly above average for parts of the northern Australia, and close to average for the rest of Australia (Bureau of Meteorology ‘National Climate Outlook’, 1 September 2022).
Predicted maximum temperature anomaly for October to December 2022
Predicted minimum temperature anomaly for October to December 2022
Over the 8-days to 15 September 2022, troughs, low-pressure and frontal systems are forecast to draw down moist, tropical air, resulting in showers and scattered storms across south-eastern and south-western Australia. High-pressure systems will provide clear, dry conditions across remaining parts of the country.
In Australian cropping regions, rainfall totals of between 10 and 50 millimetres are expected across New South Wales, Queensland, Victoria, South Australia, as well as the far southwest of Western Australia. Little to no rainfall is forecast for remaining cropping regions in Western Australia during the next 8-days.
The moderate rainfall forecast across cropping regions in northern New South Wales and southern and central Queensland will increase risk of ongoing waterlogging across low-lying areas. These wet conditions will prolong the inability to access fields for disease management and top dressing. Limited access to aerial applications of pesticides and urea will be a major limiting factor in some growing regions. This may result in increased disease pressure and delays in the timely application of urea, presenting a potential downside risk to the current well above yield expectations in some growing regions.
Waterlogging and frost events remain the biggest potential downside risk to yields over the coming weeks. For the most part, above average soil moisture levels will support strong yield potentials, with crops flowering and grain filling as we enter spring. In Central Queensland, harvesting of winter crops and planting of long-season summer crops will get underway in the coming weeks. Central Queensland growers will be hoping for clear, dry conditions to facilitate timely planting and harvesting operations.
Total forecast rainfall (mm) for the period 8 September to 15 September 2022
Water
Water storages, water markets and water allocations - current week
The Tableau dashboard may not meet accessibility requirements. For information about the contents of these dashboards contact ABARES.

Commodities
Information on weekly price changes in agricultural commodities is now available at the Weekly commodity price update.