
Key issues
- For the week ending 9 August 2023, a low-pressure system brought showers to parts of western and southern Australia. Up to 50 millimetres of rainfall was recorded in Western Australia and eastern Victoria and up to 100 millimetres in western Tasmania. Onshore winds brought showers to coastal Queensland.
- Across cropping regions, rainfall totals of up to 50 millimetres were recorded in southern Western Australia, and up to 25 millimetres in northern Western Australia that has likely only been enough to sustain crop and pasture growth but insufficient to build up soil moisture reserves. Eastern Victoria also received up to 25 millimetres of rainfall. Little to no rainfall was recorded in the remaining cropping regions and these regions will require sufficient and timely rain in the coming weeks and months to maintain current levels of winter crop production, following a gradual decline in soil moisture reserves (see Section 1.1).
- The Bureau of Meteorology’s ENSO outlook remains at El Niño ALERT. A positive IOD can suppress winter and spring rainfall over much of Australia, potentially exacerbating the drying effect of El Niño (see Section 1.2).
- Drier than median conditions are expected in September to November for large areas of Australia. Across cropping regions, during September there is a 75% chance of rainfall totals of between 10 and 25 millimetres across southern and central New South Wales, Victoria, South Australia and western and southern Western Australia. September rainfall totals are expected to be below 10 millimetres for cropping regions in northern New South Wales, Queensland and eastern Western Australia. During September to November 2023, below median rainfall is likely across cropping regions. There is 75% chance of receiving between 25 and 100 millimetres across most winter cropping regions, except for northern cropping regions in Western Australia where falls are expected to be below 25 millimetres. In areas with average or better levels of soil moisture, if realised, these falls may be sufficient to support close to average plant growth, in areas with average or better levels of soil moisture. In areas with low soil moisture, such as southern Queensland, north-western New South Wales and northern and eastern Western Australia, these probable low three-month rainfall totals are unlikely to be sufficient to sustain average levels of crop and pasture production, particularly with higher temperatures and increased water demand for crops and pastures in spring (see Section 1.3).
- Over the 8 days to 17 August 2023, fronts and troughs are expected to bring showers to southern parts of the country early in the week. A high-pressure system is expected to bring mainly dry conditions to the remainder of the country (see Section 1.4).
- Across cropping regions, rainfall totals of up to 25 millimetres are expected across eastern Western Australia and southern Victoria, while falls of up to 15 millimetres are expected in eastern South Australia. Southern New South Wales is expected to receive lighter falls of up to 10 millimetres while little to no rainfall is expected in northern New South Wales and Queensland. Following a dry week in Queensland and northern New South Wales, crops is these areas will be particularly prone to heat and moisture stress, negatively affect crop and pasture growth given the current well below average levels of soil moisture (see Section 1.4).
- Water storage levels in the Murray-Darling Basin (MDB) increased between 3 August 2023 and 10 August 2023 by 57 gigalitres (GL). Current volume of water held in storage is 20 777 GL. This is 2 percent or 513 GL less than at the same time last year.
- Allocation prices in the Victorian Murray below the Barmah Choke increased from $126 on 3 August 2023 to $148 on 10 August 2023. Prices are lower in the Goulburn-Broken and regions above the Barmah choke due to the binding of the Goulburn intervalley trade limit and Barmah choke trade constraint.
Climate
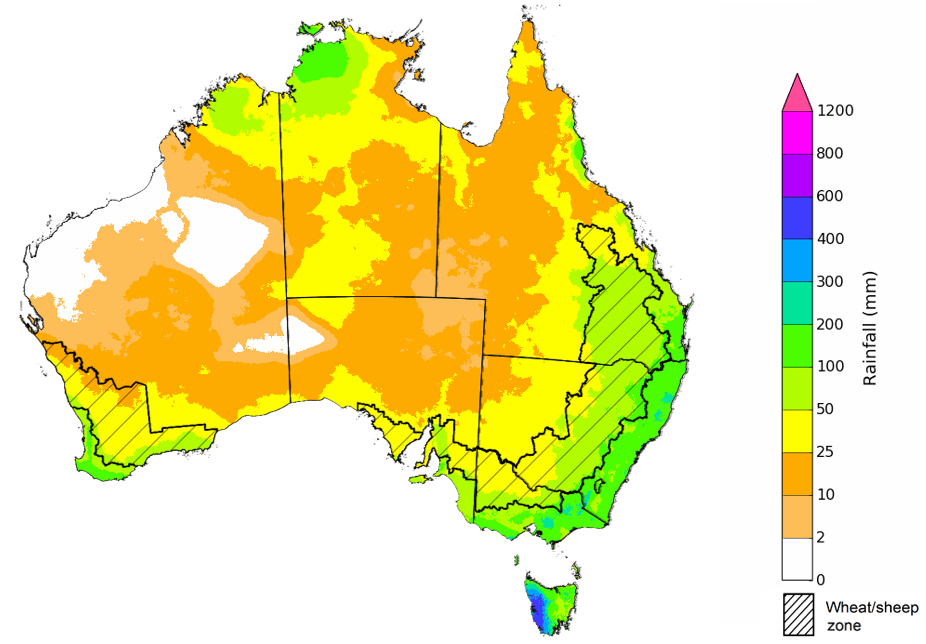
For the week ending 9 August 2023, a low-pressure system brought showers to parts of western and southern Australia. Up to 50 millimetres of rainfall was recorded in parts of Western Australia and eastern Victoria and up to 100 millimetres in western Tasmania. Onshore winds brought showers to coastal Queensland. A high-pressure system kept the remainder of the country dry and clear.
Across cropping regions, rainfall totals of up to 50 millimetres were recorded in southern Western Australia, and up to 25 millimetres in northern Western Australia, which has likely only been enough to sustain crop and pasture growth but insufficient to build up soil moisture reserves. Parts of eastern Victoria also recorded up to 25 millimetres of rainfall. Little to no rainfall was recorded in the remaining cropping regions and these regions will require sufficient and timely rain in the coming weeks and months to maintain current levels of winter crop production, following a gradual decline in soil moisture reserves.
Rainfall for the week ending 9 August 2023
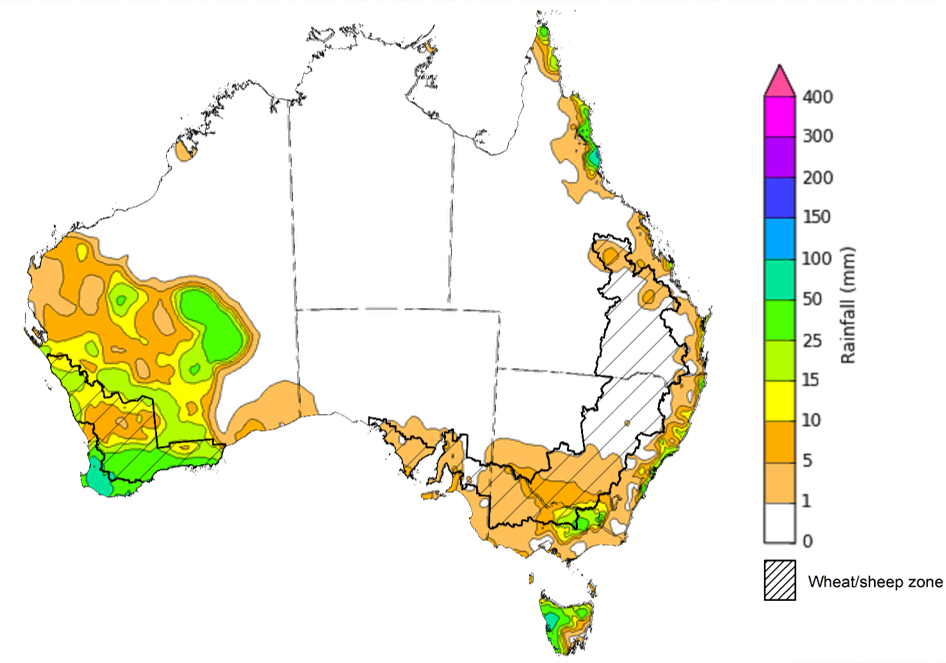
Note: The rainfall analyses and associated maps utilise data contained in the Bureau of Meteorology climate database, the Australian Data Archive for Meteorology (ADAM). The analyses are initially produced automatically from real-time data with limited quality control. They are intended to provide a general overview of rainfall across Australia as quickly as possible after the observations are received. For further information go to http://www.bom.gov.au/climate/rainfall/
The climate drivers with the largest potential impact on Australia’s climate patterns are the El Niño–Southern Oscillation (ENSO), Madden-Julian Oscillation (MJO), Indian Ocean Dipole (IOD) and Southern Annular Mode (SAM). These climate drivers are likely to influence pasture growth across southern Australia and the growth and yield prospects for winter crops.
The Madden–Julian Oscillation (MJO) pulse is currently over the western Pacific. This may contribute to El Niño development. At this time of the year MJO has little influence on northern Australia rainfall.
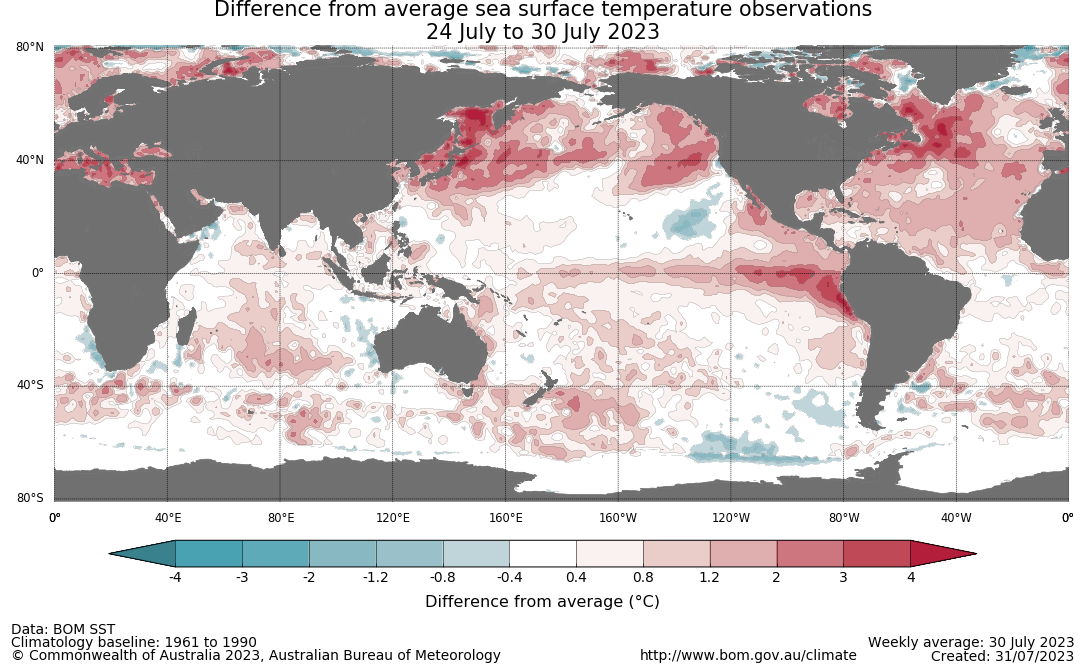
The Bureau of Meteorology’s ENSO outlook remains at El Niño ALERT, indicating that there is a 70% chance of El Niño developing in 2023. Oceanic indicators are measured in terms of the sea surface temperature (SST) anomalies, which have warmed to El Niño thresholds. For the week ending 30 July, SST anomalies were warmer than average over the central and eastern equatorial Pacific Ocean, with anomalies over 4°C in the far east. Typically, during El Niño events, waters off eastern Australia are cooler than average, pushing moisture flow from this region away from Australia. All models surveyed by the Bureau of Meteorology indicate the likelihood of further warming and the warm SSTs will remain above El Niño thresholds until at least end of the year.
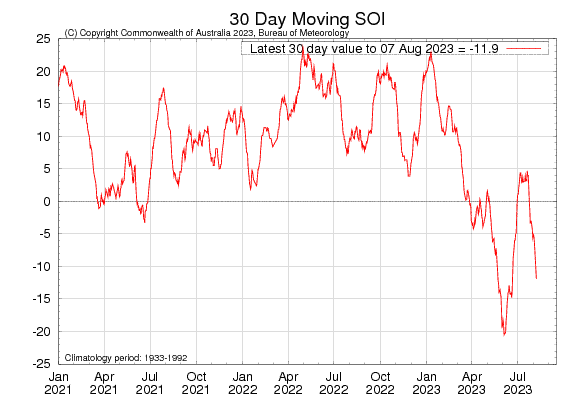
Atmospheric indicators are measured in terms of the surface air pressure difference between Tahiti and Darwin, called the Southern Oscillation Index (SOI), the direction and strength of the trade winds and cloudiness at the date line. Some atmospheric indicators such as the SOI had returned to neutral range. However, the 30-day value has quickly decreased again past the El Niño threshold of -11.9. For the period ending 7 August 2023, the 30-day SOI was -10.4 and the 90-day SOI was -8.8. Additionally, winds, clouds and broadscale pressure patterns indicate that the ocean and atmosphere are yet to reinforce each other, as occurs during El Niño events. This is primarily due to the SSTs being warm globally. For Bureau of Meteorology to declare an El Niño, the contrast in SST between eastern and western Pacific has to be significant in order to drive the changes in wind patterns and surface pressure.
Weekly sea surface temperature anomaly
30-day Southern Oscillation Index (SOI) values ending 7 August 2023
All international climate model surveyed by the Australian Bureau of Meteorology indicate the SST anomaly values will remain above El Niño threshold levels through spring and at least to the end of 2023. Note: the World Meteorological Organisation and other international agencies have declared that an El Niño event has already become established.
International climate model outlooks for the ENSO in NINO 3.4
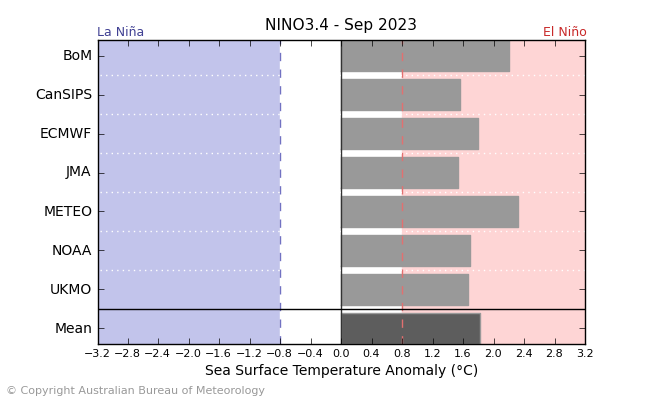
Issued: 1/8/2023
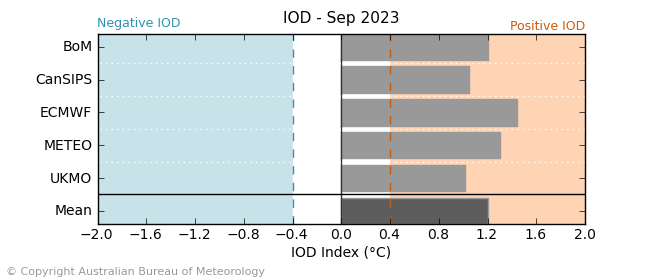
The Indian Ocean Dipole (IOD) is currently neutral with an index value of +0.16°C for the week ending 30 July 2023. Weekly sea surface temperatures (SSTs) for the period ending 30 July are above average across large areas of the tropical and southern Indian Ocean, especially in the mid-latitudes where anomalies are up to 3°C warmer than average. Off the Horn of Africa, a small area of cool anomalies persists. Closer to Australia, SSTs are close to average south of the Maritime Continent and continue to be cooler than average around the western and southern coasts of the Western Australia. All international climate models surveyed by the Bureau of Meteorology suggest that threshold values for a positive IOD event are likely to be reached in late winter or early spring. A positive IOD can supress winter and spring rainfall over much of central and south-eastern Australia, potentially exacerbating any drying effect of El Niño.
International climate model outlook for the Indian Ocean Dipole
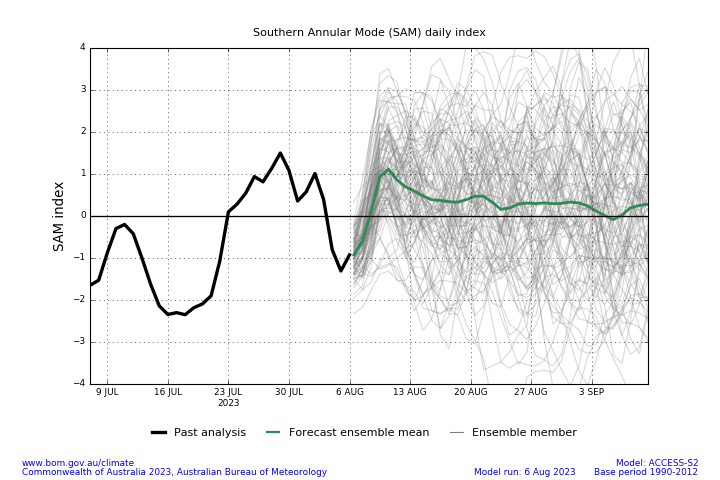
The Southern Annular Mode (SAM) index is currently neutral and is expected to remain at neutral levels for next few weeks. A neutral SAM has little influence on Australian climate.
Southern Annular Mode (SAM) daily index
These climate outlooks are generated by ACCESS–S (Australian Community Climate Earth-System Simulator–Seasonal). ACCESS–S is the Bureau of Meteorology's dynamic (physics-based) weather and climate model used for monthly, seasonal, and longer-lead climate outlooks. For further information, go to http://www.bom.gov.au/climate/ahead/about/.
The Bureau of Meteorology’s latest rainfall outlook for September 2023 indicates drier than average conditions are expected across large areas of northern, eastern and southern Australia.
The ACCESS-S climate model suggests that there is a 75% chance of rainfall totals between 10 and 50 millimetres across eastern New South Wales, scattered areas of coastal Queensland, much of Victoria and Tasmania, southern South Australia, and southwest Western Australia. Rainfall totals in excess of 100 millimetres are expected across western Tasmania, far southwest Western Australia and alpine areas of Victoria.
Across cropping regions, there is a 75% chance of rainfall totals of between 10 and 25 millimetres across southern and central New South Wales, Victoria, South Australia and western and southern Western Australia. September rainfall totals are expected to be below 10 millimetres for cropping regions in northern New South Wales, Queensland and eastern Western Australia.
Rainfall totals that have a 75% chance of occurring in September 2023
Issued: 10/08/2023
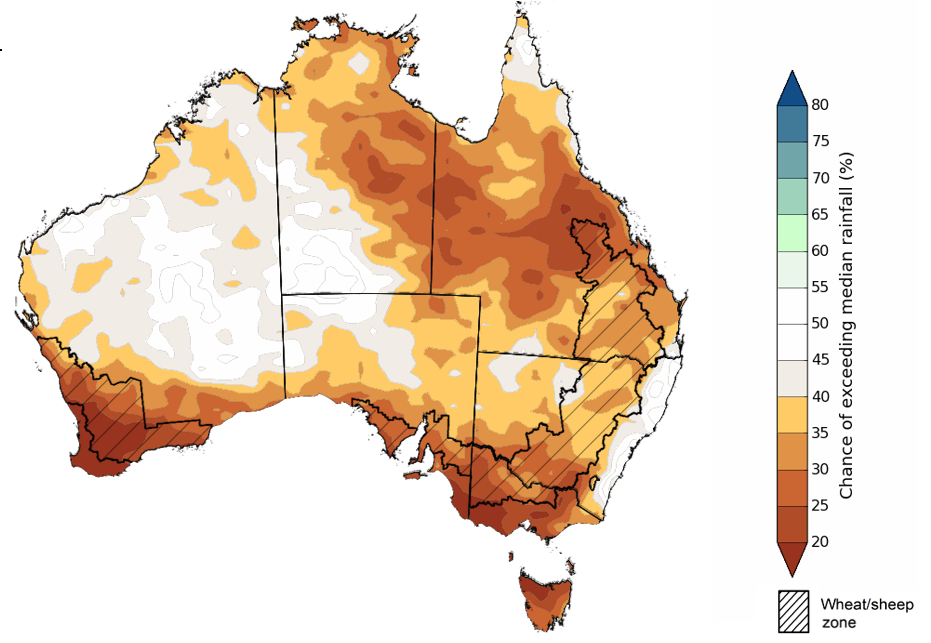
The rainfall outlook for September to November 2023 suggests that there is close to equal chances of above or below median rainfall for much of Western Australia, northern South Australia, coastal New South Wales, and southern parts of Northern Territory. However, below median rainfall is more likely in across remaining areas.
Across cropping regions, below median rainfall is more likely through the September to November period.
Chance of exceeding the median rainfall September to November 2023
Issued: 10/08/2023
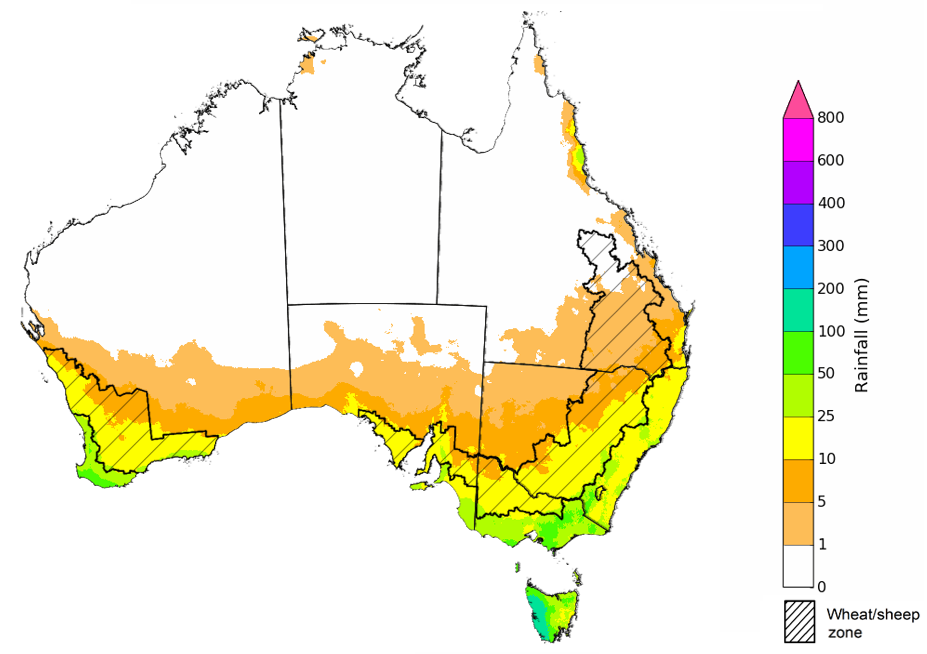
The outlook for September to November 2023 suggests there is a 75% chance of rainfall totals between 25 and 100 millimetres across much of New South Wales, Victoria and Tasmania, parts of south-eastern and coastal Queensland, and southern parts of South Australia and Western Australia. Rainfall totals in excess of 200 millimetres are forecast for alpine regions of Victoria and New South Wales and western Tasmania.
There is a 75% chance of receiving between 25 and 100 millimetres across most winter cropping regions, except for northern cropping regions in Western Australia where falls are expected to be below 25 millimetres. If realised these falls may be sufficient to support close to average plant growth, in areas with average or better levels of soil moisture.
However, in areas with low soil moisture, such as southern Queensland, north-western New South Wales and northern and eastern Western Australia these probable low three-month rainfall totals are unlikely to be sufficient to sustain average levels of crop and pasture production. Particularly as we enter the early months of spring, with higher temperatures and increased water demand for crops and pastures.
Rainfall totals that have a 75% chance of occurring September to November 2023
Issued: 10/08/2023
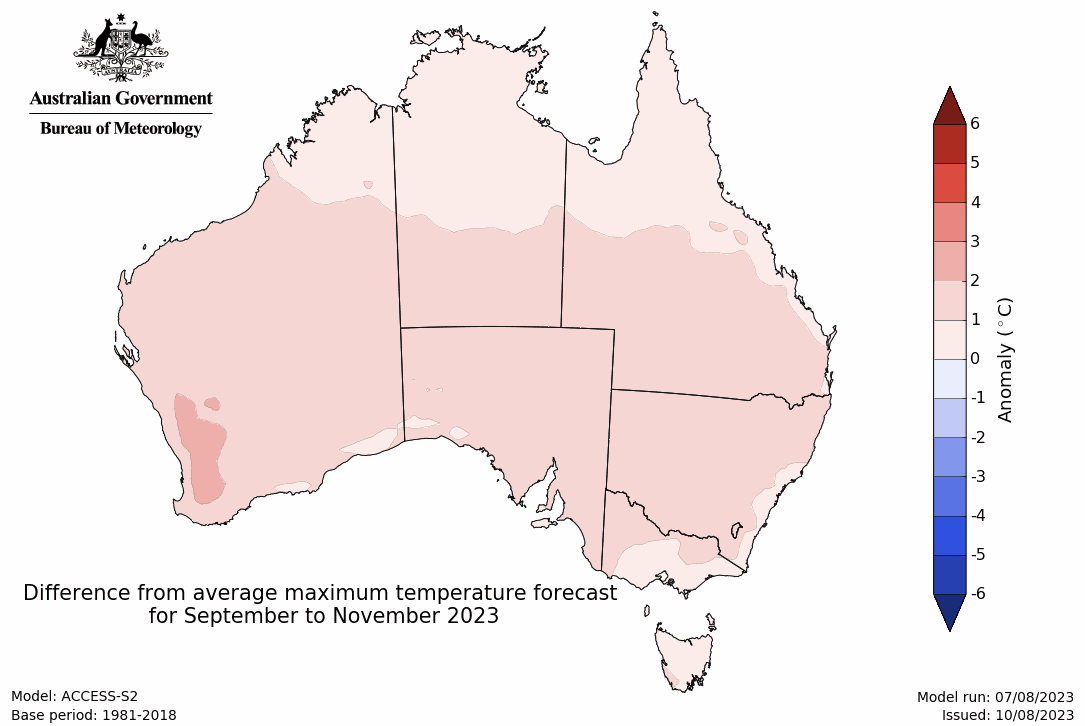
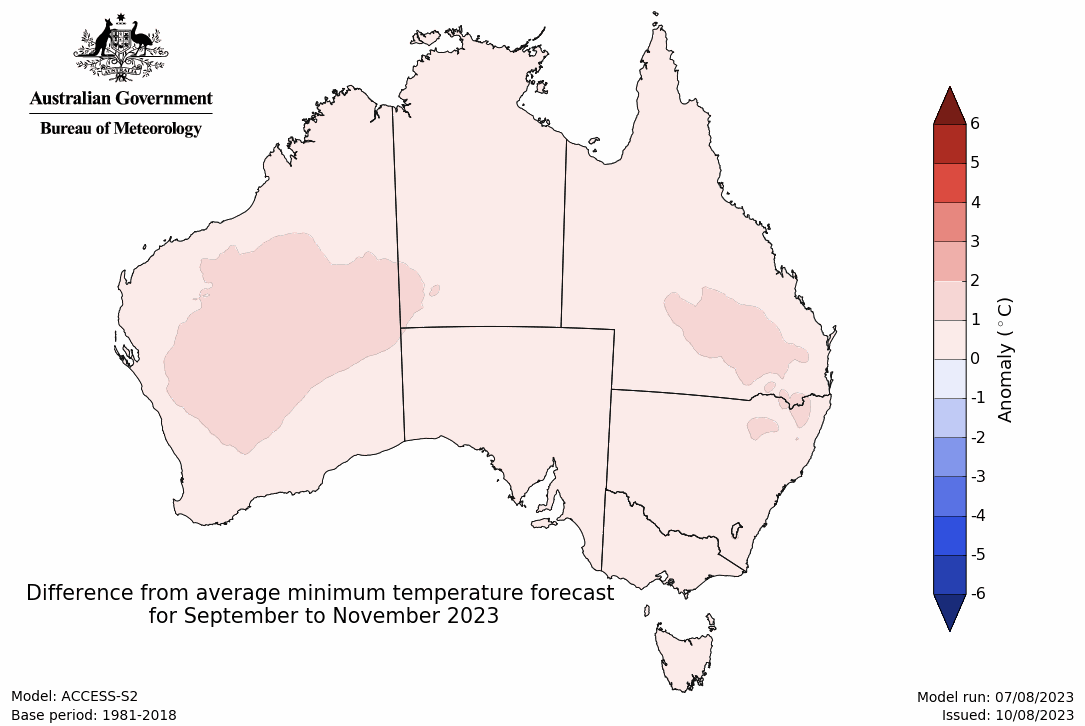
The temperature outlook for September to November 2023 indicates that maximum temperatures across northern Australia, the east coast, Victoria and Tasmania are likely to be close to the 1990–2012 average (-1°C to +1°C). Meanwhile maximum temperatures are expected to be warmer than average (above +1°C) across much of the remainder of southern Australia. Minimum temperatures are expected to be close to the 1990–2012 average (-1°C to +1°C) across most of Australia. The night-time temperatures in central parts of Western Australia are likely to be warmer that average (above +1°C).
Predicted maximum temperature anomaly for September to November 2023
Predicted minimum temperature anomaly for September to November 2023
Over the 8-days to 17 August 2023, fronts and troughs are expected to bring showers to southern parts of the country early in the week. A high-pressure system is expected to bring mainly dry conditions to the remainder of the country.
Across cropping regions, rainfall totals of up to 25 millimetres are expected across eastern Western Australia and southern Victoria, while falls of up to 15 millimetres are expected in eastern South Australia. Southern New South Wales is expected to receive lighter falls of up to 10 millimetres while little to no rainfall is expected in northern New South Wales and Queensland.
Following a dry week in Queensland and northern New South Wales, crops is these areas will be prone to heat and moisture stress, negatively affect crop and pasture growth given the current well below average levels of soil moisture.
Total forecast rainfall for the period 10 August 2023 to 17 August 2023
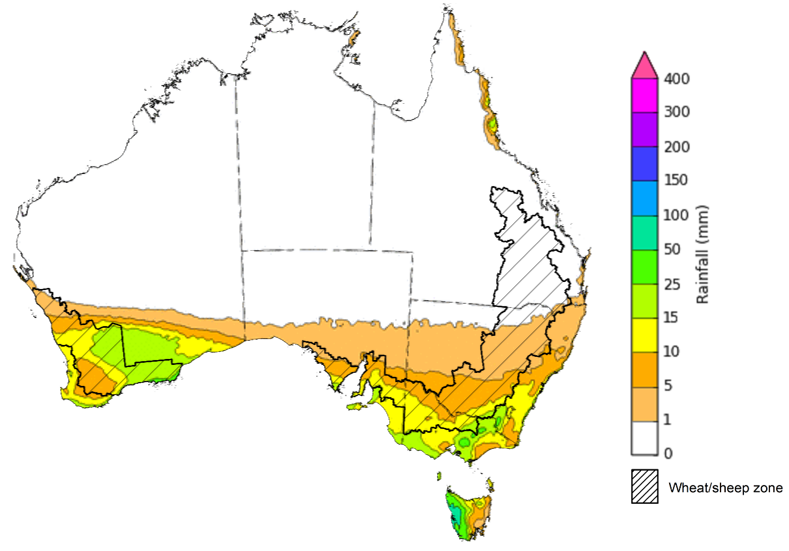
Note: This rainfall forecast is produced from computer models. As the model outputs are not altered by weather forecasters, it is important to check local forecasts and warnings issued by the Bureau of Meteorology.
Water
Water storages, water markets and water allocations - current week
The Tableau dashboard may not meet accessibility requirements. For information about the contents of these dashboards contact ABARES.

Commodities
Information on weekly price changes in agricultural commodities is now available at the Weekly commodity price update.