
Key issues
- For the week ending 10 November 2021, low pressure troughs brought storms and significant rainfall to parts of northern and eastern Australia. In the south, low-pressure systems and associated cold fronts brought substantial rainfall to southern parts of Australia.
- The wet conditions this week across Queensland, northern New South Wales and northern Western Australia have interrupted harvesting activities. Likewise, the planting of summer crops in Queensland and New South Wales may have been briefly interrupted, but is likely to continue over the coming weeks, encouraged by above average soil moisture levels in most growing areas.
- For the 3 months to October 2021, modelled pasture growth was average to well above average across much of New South Wales, Victoria, south-eastern Queensland, parts of southern South Australia and parts of Western Australia. This growth is likely to enable farmers to continue to rebuild stock numbers and provide opportunities to replenish fodder supplies during spring.
- The El Niño-Southern Oscillation (ENSO) conditions currently remain neutral. However, several indicators and all international climate models surveyed suggest the likely formation of a La Niña event in the coming months. The value of the Indian Ocean Dipole (IOD) index returned to neutral values following a brief period below the negative threshold (−0.4 °C) during October. A return to neutral weekly IOD values in late spring or early summer is consistent with the typical life cycle of an IOD event.
- The outlook for November 2021 to January 2022 suggests there is a 75% chance of rainfall totals between 50 and 300 millimetres across much of New South Wales, Queensland, Victoria, northern Western Australia, the Northern Territory and eastern Tasmania. The above average rainfall expected for December across eastern Australia is likely to delay harvesting activities and may adversely impact grain quality.
- A series of troughs and low-pressure systems are expected to bring heavy rainfall to much of northern and eastern Australia in the coming 8-days. The rainfall expected across Queensland and northern New South Wales is likely to continue to assist the establishment of early sown summer crops and boost soil moisture levels. However, the continuation of wet, humid conditions from last week’s heavy rainfall, increases the risk of grain quality downgrades in mature crops.
- Water storage in the Murray–Darling Basin (MDB) increased by 61 gigalitres (GL) between 3 November 2021 and 10 November 2021. The current volume of water held in storage is 22,109 GL, which represents 87% of total capacity. This is 49% or 7,226 GL more than at the same time last year.
- Allocation prices in the Victorian Murray below the Barmah Choke decreased from $123 per ML on 29 October 2021 to $118 per ML on 5 November 2021. Prices are lower in the Goulburn-Broken, Murrumbidgee, and regions above the Barmah Choke due to the binding of the Goulburn intervalley trade limit, Murrumbidgee export limit, and Barmah Choke trade constraint.
Climate
For the week ending 10 November 2021, low pressure troughs brought storms and significant rainfall to parts of northern and eastern Australia. In the south, low-pressure systems and associated cold fronts brought substantial rainfall to Tasmania and southern parts of the mainland over the 7 days to 10 November 2021.
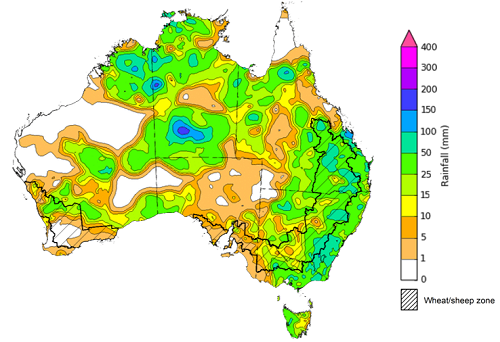
Rainfall totals of between 10 and 50 millimetres were recorded across much of New South Wales, a broad band of Queensland stretching from south-east to north-west, much of Victoria, scattered areas of South Australia, the north and centre of Western Australia, much of the Northern Territory and Tasmania. Rainfall totals in excess of 50 millimetres were recorded across scattered areas of New South Wales, Queensland, the north of Western Australia and parts of the Northern Territory.
In cropping regions, rainfall totals of between 10 and 100 millimetres were recorded across much of New South Wales, Queensland, Victoria, as well as parts of Western Australia. Little to no rainfall was recorded across remaining cropping regions.
The wet conditions across cropping regions in Queensland, northern and central New South Wales and northern Western Australia have interrupted harvesting activities. Likewise, the planting of summer crops in Queensland and northern New South Wales may have been briefly interrupted, but is likely to continue over the coming weeks, encouraged by above average soil moisture levels in most growing areas.
For cropping regions across eastern Australia, the big risk associated with this week’s rainfall is downgrading of wheat quality due to falling protein levels and the potential sprouting of unharvested grain. This has seen the price spread between low protein and high protein wheat increasing for October and November, with the average spread increasing from A$24/t to A$34/t.
Rainfall for the week ending 10 November 2021
Pasture growth during the August to October period is typically low across large areas of central and northern Australia as it is firmly in the dry season. Across southern Australia, August to October pasture growth provides the spring flush which typical allows producers to cease winter supplementary feeding. It also influences the growth and branding and marking rates of lambs and calves, and the production of meat, milk, and wool over this peak production period.
For the 3 months to October 2021, above average rainfall totals and mild temperatures resulted in average to above average pasture production for this time of year across most grazing regions.
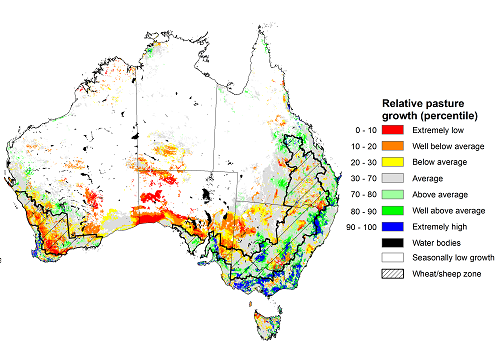
Modelled pasture growth was average to well above average across much of New South Wales, Victoria, south-eastern Queensland, parts of southern South Australia and parts of Western Australia. This growth is likely to enable farmers to continue to rebuild stock numbers and provide opportunities to replenish fodder supplies during spring. In contrast, modelled pasture growth was extremely low to below average across scattered areas of western New South Wales, parts of southern Queensland, eastern and northern South Australia, central Western Australia, and isolated parts of central Northern Territory.
Across parts of western Victoria and the east of South Australia a dry end to winter and start to spring and below average soil moisture levels has resulted in below average to average pasture growth. As a result, livestock producers in western Victoria and eastern South Australia will require substantial rainfalls through the remainder of spring to build soil moisture levels and supplementary feed to maintain current stock numbers. In contrast below average modelled pasture grow rates across parts of Western Australia comes after extremely high pasture growth during winter which has resulted in average to above average pasture availability for this time of year.
Relative pasture growth for 3-months ending October 2021 (1 August to 31 October 2021)
Throughout late spring and early summer the climate drivers with the largest potential impact on Australia’s climate patterns are the El Niño–Southern Oscillation (ENSO), the Indian Ocean Dipole (IOD) and the Southern Annular Mode (SAM). These climate drivers will likely influence the final yield prospects and grain quality for Australia’s winter cropping season, pasture growth rates during this peak growth period and planting and establishment conditions for summer crops.
ENSO conditions currently remain neutral. However, several indicators and all international climate models surveyed suggest the likely formation of a La Niña event in the coming months. The Bureau of Meteorology recently upgraded its ENSO Outlook to La Niña ALERT, with a 70% likelihood of an event forming. La Niña events are associated with above-average rainfall for northern and eastern Australia during spring and summer.
The value of the IOD index returned to neutral values following a brief period below the negative threshold (−0.4 °C) during October. A return to neutral weekly IOD values in late spring or early summer is consistent with the typical life cycle of an IOD event. The increase in the IOD value reflects warmer than average sea surface temperatures in the western Indian Ocean. Warmer than average sea surface temperatures remain in the eastern Indian Ocean. A negative IOD, and warmer sea surface temperatures in the eastern Indian Ocean, is associated with above average rainfall for much of southern Australia in spring.
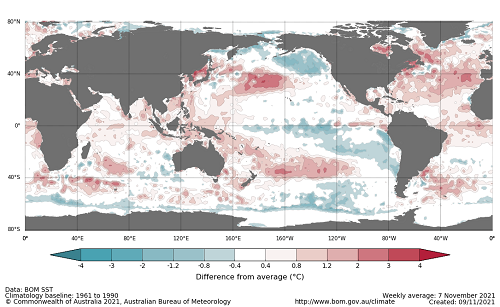
Below average sea surface temperature anomalies increased in the central and eastern tropical Pacific Ocean over the past week. Despite these temperature anomalies remaining within the neutral ENSO range, a continued cooling is anticipated across the equatorial Pacific, contributing to the development of a La Niña event in the coming months. Meanwhile, above average anomalies in the western Pacific Ocean and Maritime Continent have eased slightly
Difference from average sea surface temperature observations 1 November to 7 November 2021
International climate model outlooks for the NINO 3.4 region in November 2021
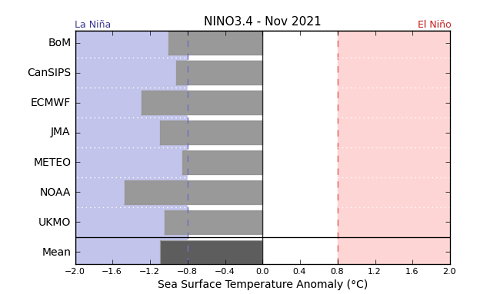
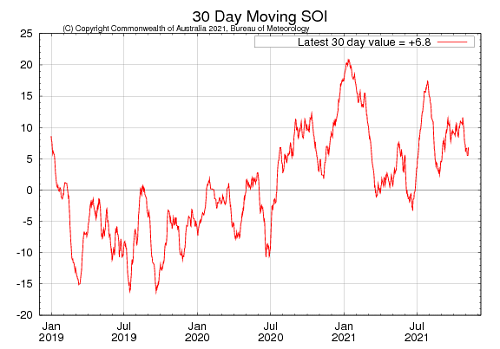
Atmospheric and oceanic indicators increasingly suggest the likely formation of a La Niña event during November. Although monthly sea surface temperatures remain within the neural range, all international models surveyed predict the formation of a La Niña event in November 2021. The anticipation of a La Niña event is underpinned by a cooling of sea surface temperatures in the central and eastern equatorial Pacific Ocean, a strengthening of tropical trade winds and consistently below average cloudiness near the Date Line. Furthermore, for the period ending 7 November the 30‑day Southern Oscillation Index (SOI) value was 6.8 and the 90‑day value was 7.9, both of which are around the La Niña threshold of +7.
30-day Southern Oscillation Index (SOI) values ending 7 November 2021
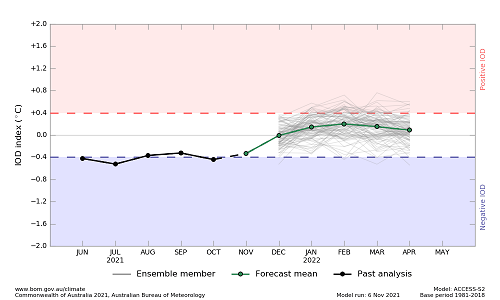
As at 7 November 2021, the Indian Ocean Dipole (IOD) weekly value was -0.13°C, which is firmly within neutral bounds. The majority of international climate models surveyed by the Bureau of Meteorology expect the IOD to return to neutral in November and remain neutral throughout summer. Above average sea surface temperatures in the eastern Indian Ocean are likely to persist as the negative IOD event dissipates and will continue to influence rainfall patterns.
Monthly sea surface temperature anomalies for IOD region
These climate outlooks are generated by ACCESS–S (Australian Community Climate Earth-System Simulator–Seasonal). ACCESS–S is the Bureau of Meteorology's dynamical (physics-based) weather and climate model used for monthly, seasonal and longer-lead climate outlooks.
For further information, go to http://www.bom.gov.au/climate/ahead/about/
The Bureau of Meteorology’s latest rainfall outlook indicated wetter than average conditions are expected for much of eastern and central Australia during December. The wetter than average conditions expected for most eastern Australian (including South Australia) cropping regions may delay the harvesting of winter crops but support the germination and establishment of summer crops in New South Wales and Queensland. The ACCESS-S climate model suggests there is close to a 65% chance of exceeding median December rainfall totals across much of eastern and central Australia.
The outlook for December 2021 indicates that there is a 75% chance of rainfall totals between 10 and 100 millimetres across much of eastern, northern, central Australia. Rainfall totals in excess of 100 millimetres are expected in parts of north-eastern New South Wales, northern Queensland, the north of the Northern Territory and Western Australia, and western Tasmania.
Across cropping regions there is a 75% chance of rainfall totals of between 10 and 100 millimetres across New South Wales, Queensland, Victoria and eastern South Australia. There is a 75% chance of rainfall less than 10 millimetres for most of Western Australia and western areas of South Australia. The expected rainfall across eastern growing regions is likely to boost soil moisture levels and support the establishment of summer crops. On the other hand, the rainfall is likely to disrupt harvesting of winter crops.
Rainfall totals that have a 75% chance of occurring December 2021
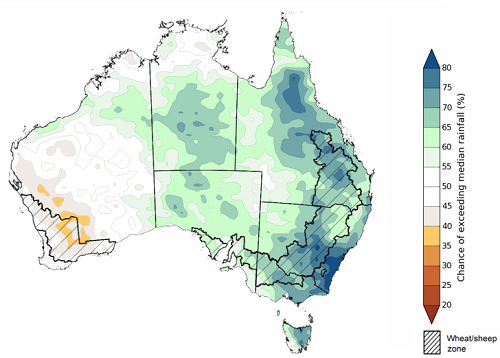
The rainfall outlook for December 2021 to February 2022 suggests there is a greater than 65% chance of exceeding median rainfall across much of New South Wales, eastern Queensland, Victoria, Tasmania and parts of South Australia and the Northern Territory. For remaining regions of Australia, there is a 50% of above chance of exceeding median rainfall, with only isolates areas of southern Western Australia expecting to receive below average rainfall between December 2021 to February 2022 (Bureau of Meteorology ‘National Climate Outlook’, 4 November 2021).
Bureau of Meteorology rainfall outlooks for December to February have greater than 55% past accuracy across most of Australia. Outlook accuracy is greater than 65% across parts of southern Queensland, north-western Western Australia and the north of the Northern Territory. On the other hand, there is low past accuracy for large areas of the east of the Northern Territory, western Queensland and scattered areas of southern Australia.
Chance of exceeding the median rainfall December 2021 to February 2022
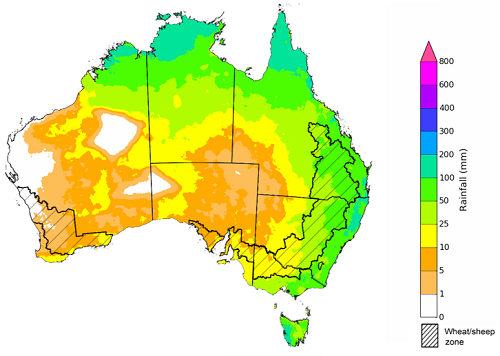
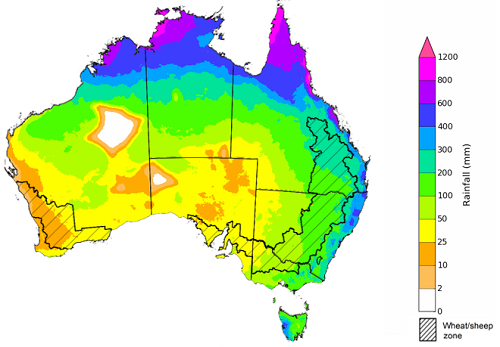
The outlook for December 2021 to February 2022 suggests there is a 75% chance of rainfall totals between 50 and 300 millimetres across much of New South Wales, Queensland, Victoria, northern Western Australia, the Northern Territory and eastern Tasmania. Rainfall totals in excess of 300 millimetres are likely across parts of eastern New South Wales and Queensland, much of northern Australia and western Tasmania.
Across cropping regions, there is a 75% chance of receiving between 50 and 200 millimetres across much of New South Wales, southern Queensland, and eastern and central Victoria. Rainfall totals in excess of 200 millimetres are forecast eastern and northern Queensland. Totals of less than 50 millimetres are expected across remaining cropping regions in Victoria, and South Australia and Western Australia.
These rainfall totals are close to average for this three-month period across most New South Wales and Queensland cropping regions, but slightly below average for cropping regions in Victoria, South Australia and Western Australia. Harvesting of winter crops will continue to progress southwards as we enter the late spring, early summer period. The above average rainfall expected for December across eastern Australia is likely to delay harvesting activities and may adversely impact grain quality. As the winter crop season draws to a close, attention turns to northern growing regions and the summer crop. The above average rainfall expected between December to February will support the establishment and development of summer crops, as well as boosting soil moisture and water storage levels and supporting yield potentials.
Rainfall totals that have a 75% chance of occurring December 2021 to February 2022
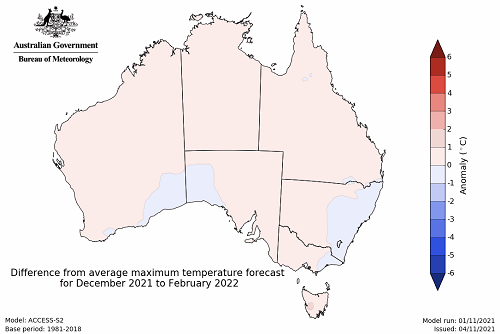
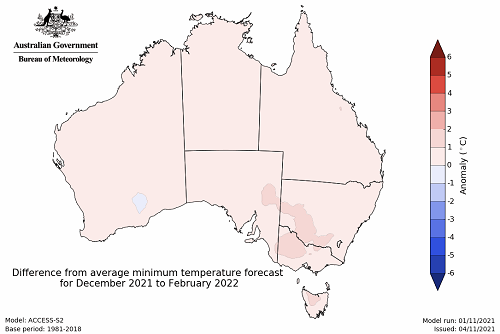
The temperature outlook for December 2021 to February 2022 indicates that maximum temperatures across most of Australia are likely to be close to the 1990-2012 average (- 1°C to 1°C). Minimum temperatures are expected to be slightly above average for isolated patches across south-eastern Australia and close to average for the rest of Australia (Bureau of Meteorology ‘National Climate Outlook’, 4 November 2021).
Predicted maximum temperature anomaly for December 2021 to February 2022
Predicted minimum temperature anomaly for December 2021 to February 2022
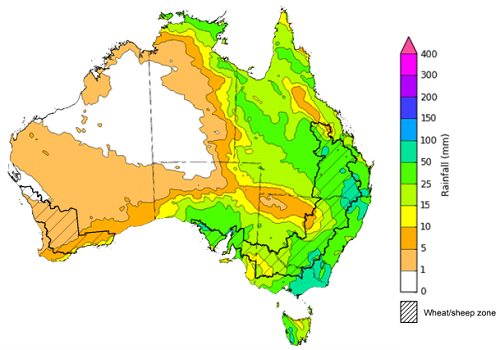
Over the 8-days to 18 November 2021 a series of troughs and low-pressure systems are expected to draw down moist, tropical air across much of northern and eastern Australia, resulting in storms and substantial rainfall. In contrast much of western and central Australia, are expected to receive little to no rainfall over the next 8 days.
Rainfall totals of between 10 and 50 millimetres are forecast for most of New South Wales, Queensland, Victoria, southern South Australia, the far north and east of the Northern Territory and Tasmania. Rainfall in excess of 50 millimetres is expected in parts of eastern New South Wales, south-east Queensland, eastern Victoria, as well as isolated parts of South Australia and Tasmania.
In Australian cropping regions, rainfall totals of between 10 and 50 millimetres are expected across much of New South Wales, Queensland, Victoria and South Australia. Rainfall totals in excess of 50 millimetres is expected in some cropping regions in eastern New South Wales and the north and south-east of Queensland. Little to no rainfall is forecast for cropping regions in Western Australia during the next 8-days.
The rainfall expected across Queensland and northern New South Wales is likely to continue to assist the establishment of early sown summer crops and boost soil moisture levels. However, the conditions may interrupt further planting activity and harvesting of winter crops in northern growing regions. The continuation of wet, humid conditions from last week’s heavy rainfall, increases the risk of grain quality downgrades in mature crops. In southern cropping regions, the expected rainfall is likely to improve plant available moisture and support yield potentials as crops progress through grain filling. The rainfall will be of particular value in parts of southern New South Wales, northern Victoria and South Australia, where soil moisture levels are below average to average.
Total forecast rainfall (mm) for the period 11 November to 18 November 2021
Note: This rainfall forecast is produced from computer models. As the model outputs are not altered by weather forecasters, it is important to check local forecasts and warnings issued by the Bureau of Meteorology.
Water
Water storages, water markets and water allocations - current week
The Tableau dashboard may not meet accessibility requirements. For information about the contents of these dashboards contact ABARES.

Commodities
Information on weekly price changes in agricultural commodities is now available at the Weekly commodity price update.